
List of Report Template Visualizations (EX)
What's on this page
Qtip: This page describes functionality available to Engagement, Lifecycle, and Ad Hoc Employee Research projects. For more details on each, see Types of Employee Experience Projects.
About Report Template Visualizations
Dashboard report templates have many different visualizations you can add. Some of these, like the engagement summary and scorecard, are almost exactly like their dashboard counterparts. Others, like the breakdown bar and statistics table, can communicate similar data to widgets you’d find in a dashboard, but with a unique and simple setup.
Bar Chart Visualization
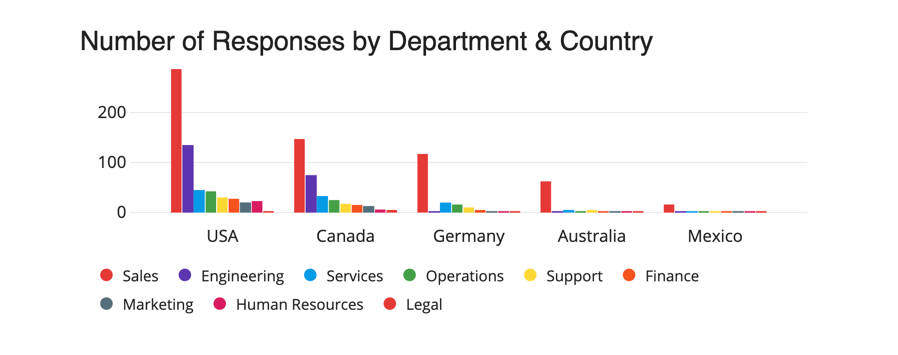
The Bar Chart visualization allows you to see data about a selected field in a bar format. You can then breakout your bars by another field, allowing you to get granular in your data analysis.

Customizing a Bar Chart
To learn more about editing the title, configuring the metric, breaking out data by additional fields, display logic, or other general style settings shared by other visualizations, see the Visualization Overview.
For information on customizing Bar Charts, read Bar Chart Customization. Please note that the linked page is for a similar feature in the Survey Platform, and only the linked section is applicable.
To learn about visualization-level filters, see visualization-level filters.
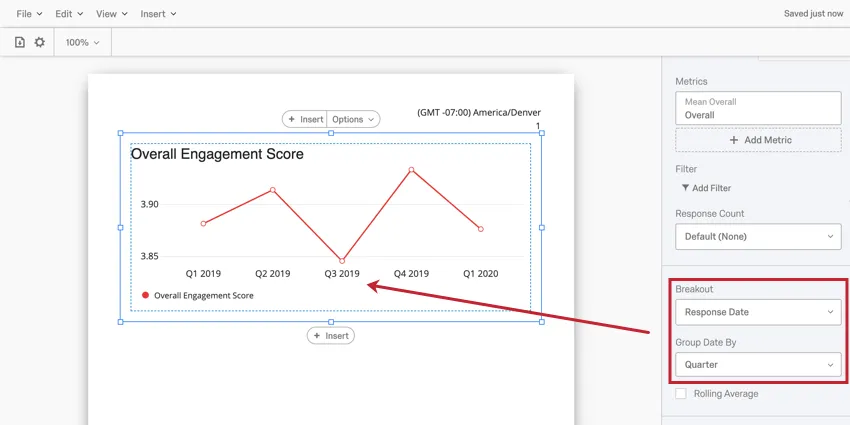
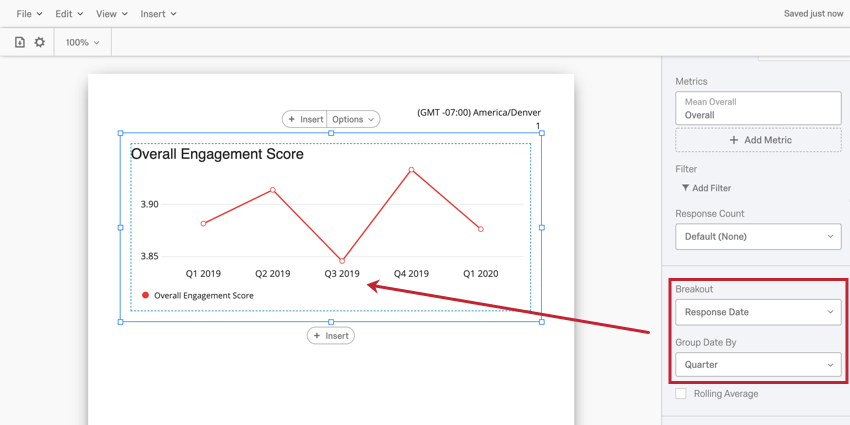
Line Chart Visualization
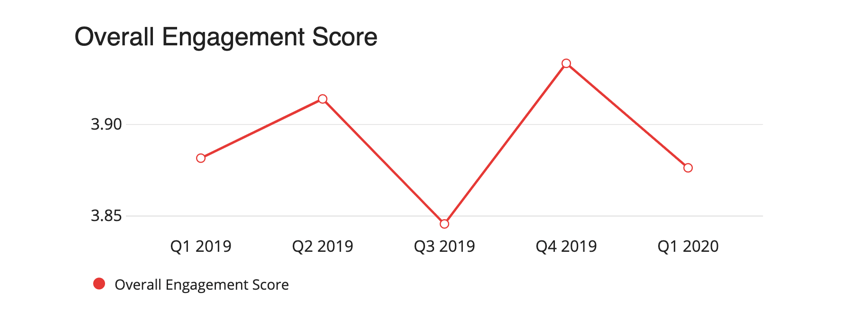
Line Chart visualizations are used to view your data points in a chart connected by lines. This visualization type is particularly useful in analyzing trends over time.
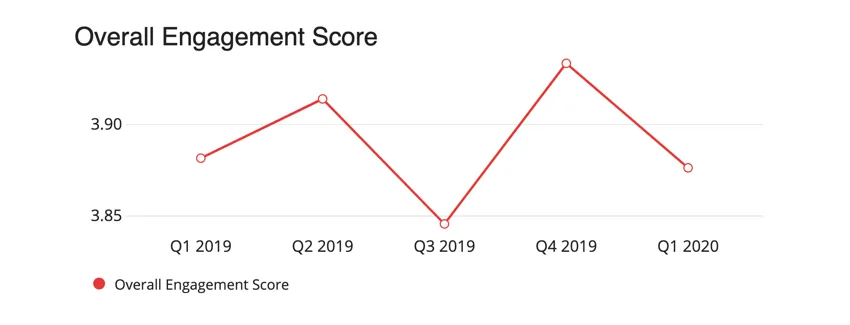
Qtip: Since Line Charts usually show data over time, add a Breakout by a date field to start analyzing your trends.
Customizing a Line Chart
To learn more about editing the title, configuring the metric, breaking out data by additional fields, display logic, or other general style settings shared by other visualizations, see the Visualization Overview.
For information on customizing Line Charts, read Line Chart Customization. Please note that the linked page is for a similar feature in the Survey Platform, and only the linked section is applicable.
To learn about visualization-level filters, see visualization-level filters.
Pie Chart Visualization
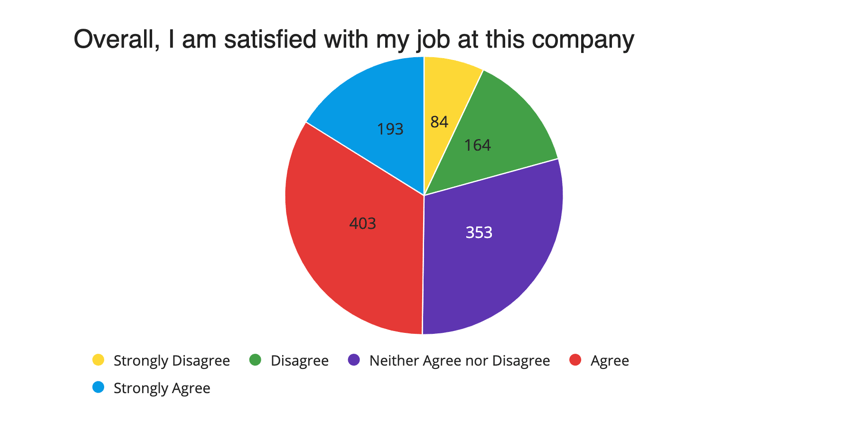
Pie Chart visualizations show your data in a circular graphic that is divided into slices. The entire “pie” is the total number of choices, while each “slice” of the pie shows the proportional number of times a choice was selected.

Customizing Pie Charts
To learn more about editing the title, configuring the metric, breaking out data by additional fields, display logic, or other general style settings shared by other visualizations, see the Visualization Overview.
For information on customizing Pie Charts, read Pie Chart Customization. Please note that the linked page is for a similar feature in the Survey Platform, and only the linked section is applicable.
To learn about visualization-level filters, see visualization-level filters.
Breakdown Bar Visualization
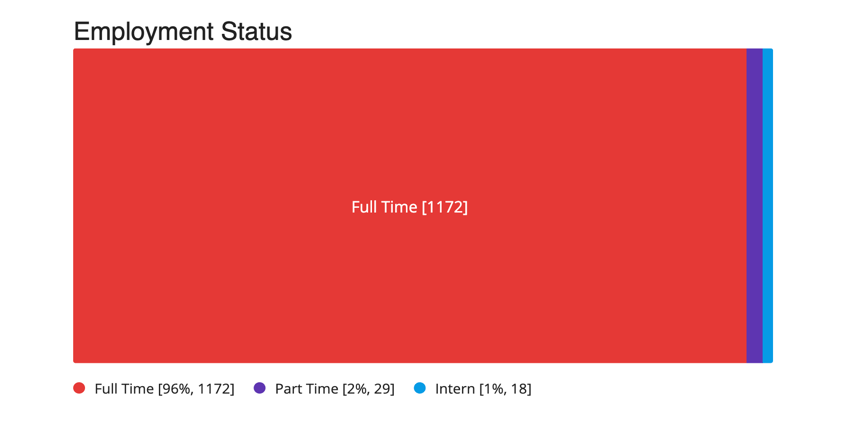
Breakdown Bar visualizations show your data in a linear graphic that is divided into pieces. The entire bar is the total number of choices, while each piece of the bar shows the proportional number of times a choice was selected. These display information similarly to Pie Charts, but with a different look.

Customizing Breakdown Bars
To learn more about editing the title, configuring the metric, breaking out data by additional fields, display logic, or other general style settings shared by other visualizations, see the Visualization Overview.
For information on customizing Breakdown Bars, read Breakdown Bar Customization. Please note that the linked page is for a similar feature in the Survey Platform, and only the linked section is applicable.
To learn about visualization-level filters, see visualization-level filters.
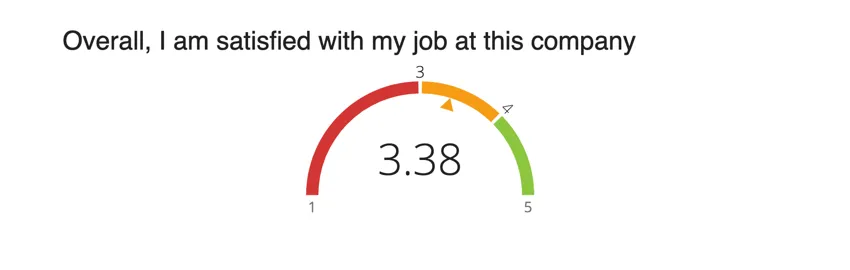
Gauge Chart Visualization
Gauge Charts can help you quickly determine how a given field is performing versus how it is expected to perform. With a Gauge Chart, the visualization displays your chosen metric along a scale that displays color according to where your metric falls on the expected scale. The arrow below the value ranges will show you where your current metric falls on the scale.
Gauge Chart Customization
To learn more about editing the title, configuring the metric, breaking out data by additional fields, display logic, or other general style settings shared by other visualizations, see the Visualization Overview.
For information on customizing Gauge Charts, read Gauge Chart Customization. Please note that the linked page is for a similar feature in the Survey Platform, and only the linked section is applicable.
To learn about visualization-level filters, see visualization-level filters.
Engagement Summary Visualization
The Engagement Summary visualization is used to analyze the favorability of a selected field. You can also add comparisons into your Engagement Summary visualization to compare against historical data or industry benchmarks. This visualization lets you rebuild the Engagement Summary widget from your dashboard in a report.

Qtip: This visualization is WCAG 2.1 AA compliant.
Differences from the Widget
The Engagement Summary visualization has the same setup and customization options as the widget, with some exceptions.
- The scale’s color is taken from the reports Global Settings, particularly the Favorability Scale.
- Reduced customization options – the compact view is not available in reports.
Participation Summary Visualization
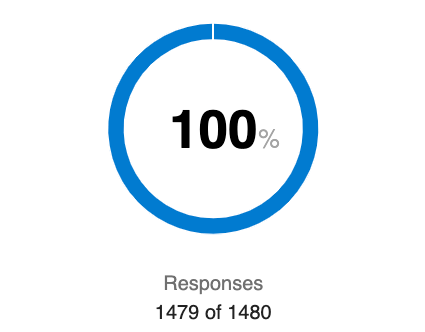
The Participation Summary visualization gives you an overview of how many of your participants have taken your survey.
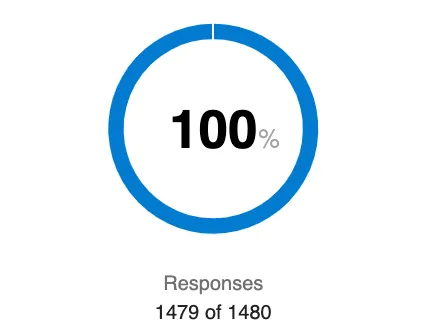
Qtip: This visualization is WCAG 2.1 AA compliant.
Differences from the Widget
The Participant Summary visualization has the same setup and customization options as the widget, with some exceptions.
- Reduced customization options – the visualization will always display the response count and percentage.
- The scale’s color is taken from the reports Global Settings, particularly the Favorability Scale.
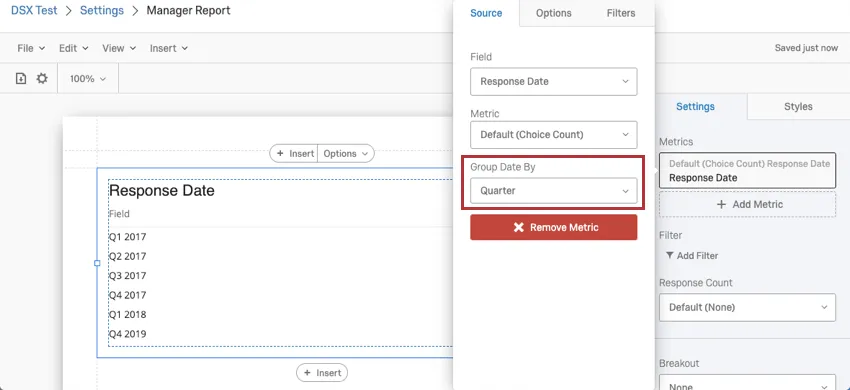
Data Table Visualization
The Data Table visualization allows you to view basic information about a selected field. You can also break out this information by other fields, such as metadata.
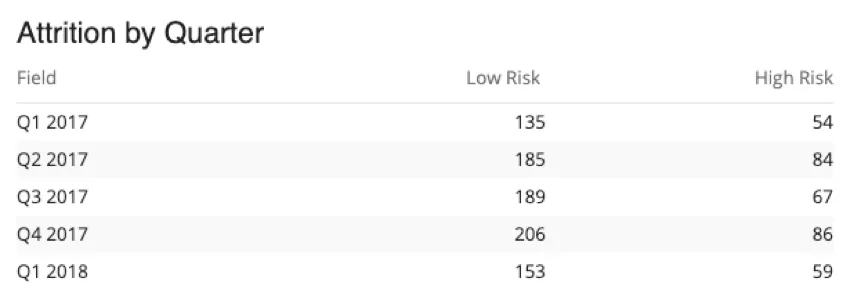
Qtip: By default, this table pulls in all sources mapped to your dashboard. If you have multiple sources mapped to your dashboard, and you only want to pull from one, you will need to add a visualization filter.
Qtip: If you report on a date field, you can decide how periods of time are grouped.

Customizing a Data Table
To learn more about editing the title, configuring the metric, breaking out data by additional fields, display logic, or other general style settings shared by other visualizations, see the Visualization Overview.
To learn more about customization unique to Data Tables, see Data Table Customization. Please note that the linked support page is for a similar feature in the Survey Platform, and only the linked section is relevant.
To learn about visualization-level filters, see visualization-level filters.
Statistics Table Visualization
Statistics Tables help you see key statistics about a chosen field, such as mean and standard deviation.
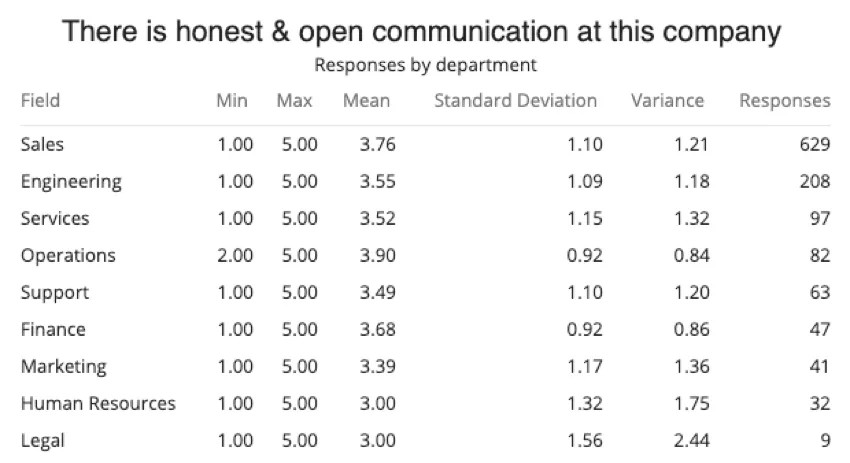
Qtip: By default, this table pulls in all sources mapped to your dashboard. If you have multiple sources mapped to your dashboard, and you only want to pull from one, you will need to add a visualization filter.
Unlike its counterpart in the Survey Platform, Report Templates cannot display median.
Learn more about these options and how to hide or display them at Statistics Table Customization Options. Please note that the linked support page is for a similar feature in the Survey Platform, and only the linked section is relevant.
Additional Customization Options
For customizing display logic, breaking out visualizations by other data (such as department), and style settings shared by other visualizations, see Visualization Overview.
Results Table Visualization
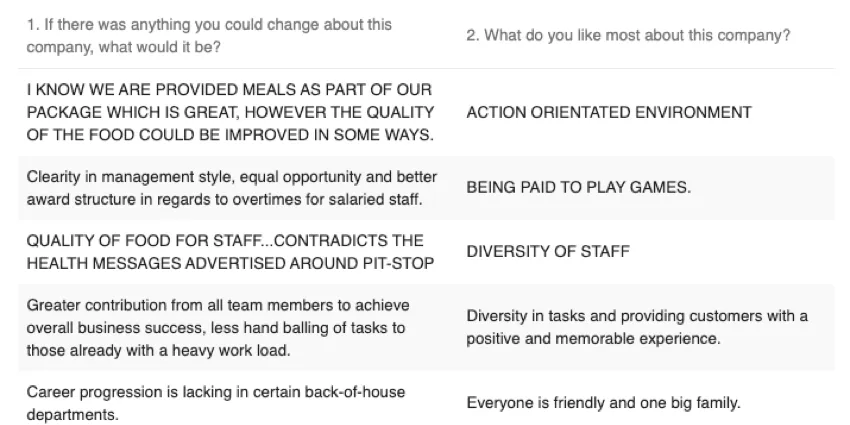
The Results Table visualization displays data in a list format. It breaks out each response as a separate row, and allows you to customize what columns of collected data to include. The Results Table is best if you want to see individual responses or open-ended feedback; if you want to display data on response counts or statistics, use the Statistics Table or a Data Table.
Qtip: By default, this table pulls in all sources mapped to your dashboard. If you have multiple sources mapped to your dashboard, and you only want to pull from one, you will need to add a visualization filter.
Customizing Results Tables
For more details on adding additional fields, styling you can apply, and other customization options, see Results Table Customization Options. Please note that the linked support page is for a similar feature in the Survey Platform, and only the linked section is relevant.
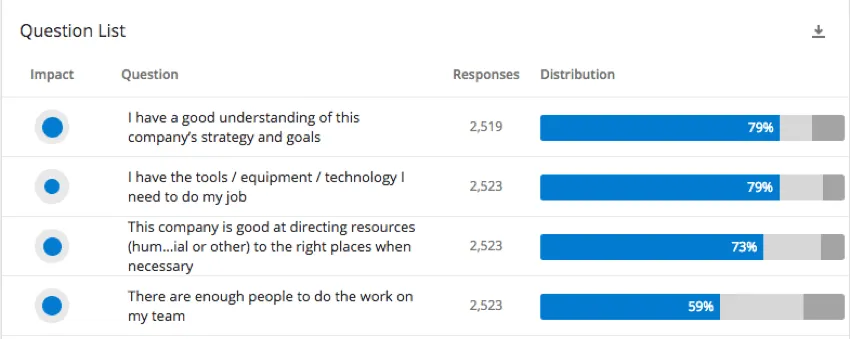
Question List Visualization
The Question List visualization is a way to rebuild the Question List widget from your dashboard to your report template.
Attention: By default, this visualization will show data from all data sources in report templates. (In dashboards, the heat map only shows the primary data source by default.) To limit data to one data source, add a visualization filter for that data source. If you do not add a filter, the report template and dashboard may show different data.


Differences from the Widget
The Question List visualization has the same setup and customization options as the widget, with some exceptions.
- The scale’s color is taken from the reports Global Settings, particularly the Favorability Scale.
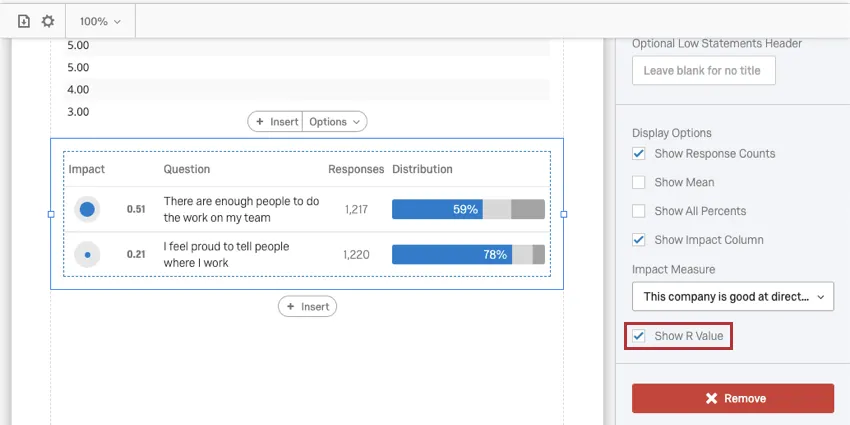
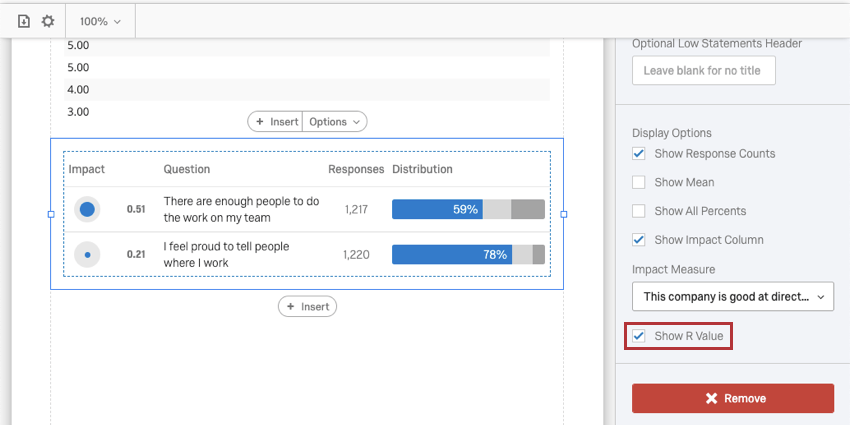
- When you select the impact measure, you can also select to Show R Value. This is the R Value of the Impact.
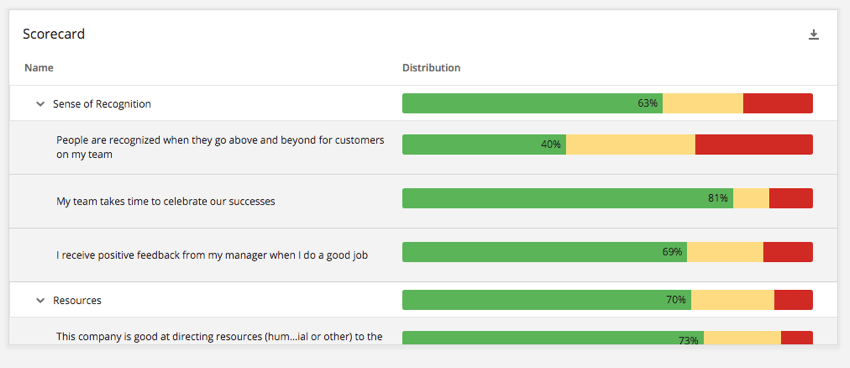
Scorecard Visualization
The Scorecard visualization is a way to rebuild the Scorecard widget from your dashboard to your report.
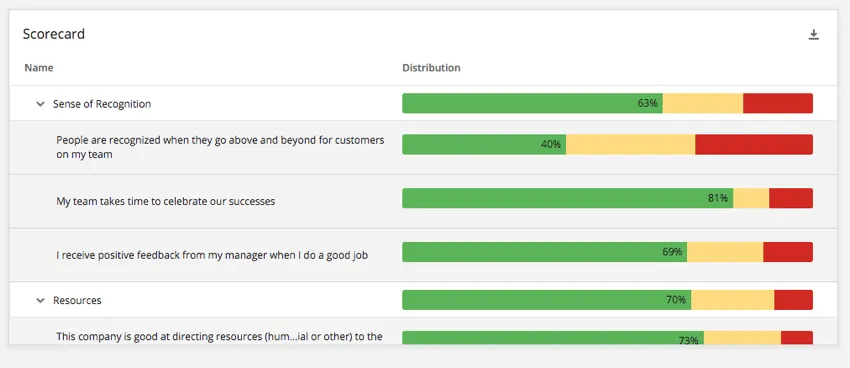
Attention: By default, this visualization will show data from all data sources in report templates. (In dashboards, the heat map only shows the primary data source by default.) To limit data to one data source, add a visualization filter for that data source. If you do not add a filter, the report template and dashboard may show different data.
Differences from the Widget
The Scorecard visualization has the same setup and customization options as the widget, with some exceptions.
- Reduced display options – you can show response counts, show the mean, and show all percents, but you cannot show action planning or disable column sorting.
- The scale’s color is taken from the reports Global Settings, particularly the Favorability Scale.
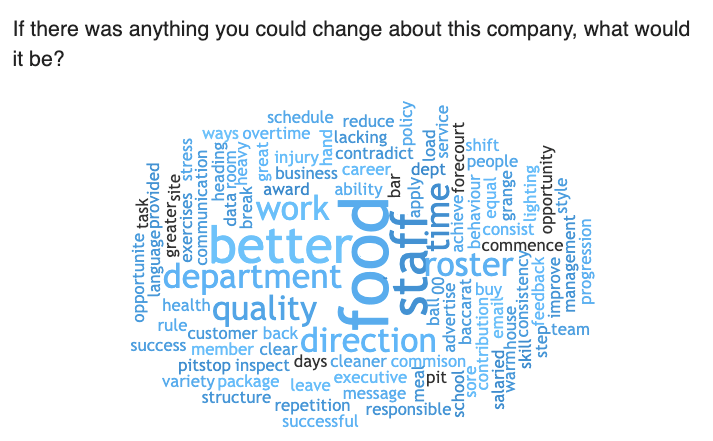
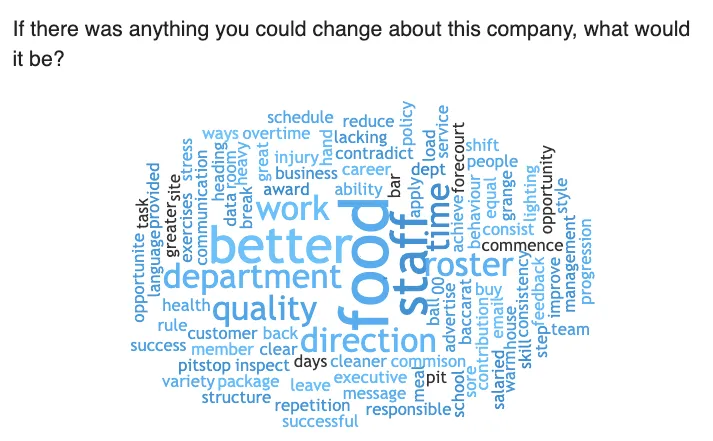
Word Cloud Visualization
Word Cloud visualizations allow you to view the words repeated most often in your open-ended text results. The most frequent words appear in a cluster, with the font size increasing the more often that word was included in a response.
Despite sharing a name with the dashboard Word Cloud widget, the look and feel of this visualization are more similar to the World Cloud in survey project advanced-reports.
Qtip: By default, word clouds pull in all sources mapped to your dashboard. If you have multiple sources mapped to your dashboard, and you only want to pull from one, you will need to add a visualization filter.
Customizing a Word Cloud
To learn more about editing the title, configuring the metric, breaking out data by additional fields, display logic, or other general style settings shared by other visualizations, see the Visualization Overview.
To learn more about customization unique to Word Clouds, such as colors, stop words, and word rotation, see Word Cloud Customization Options. Please note that the linked support page is for a similar feature in the Survey Platform, and only the linked section is relevant.
To learn about visualization-level filters, see visualization-level filters.
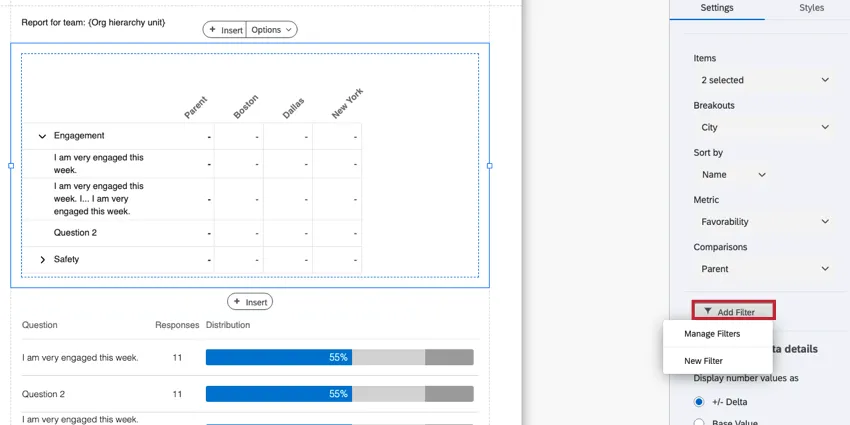
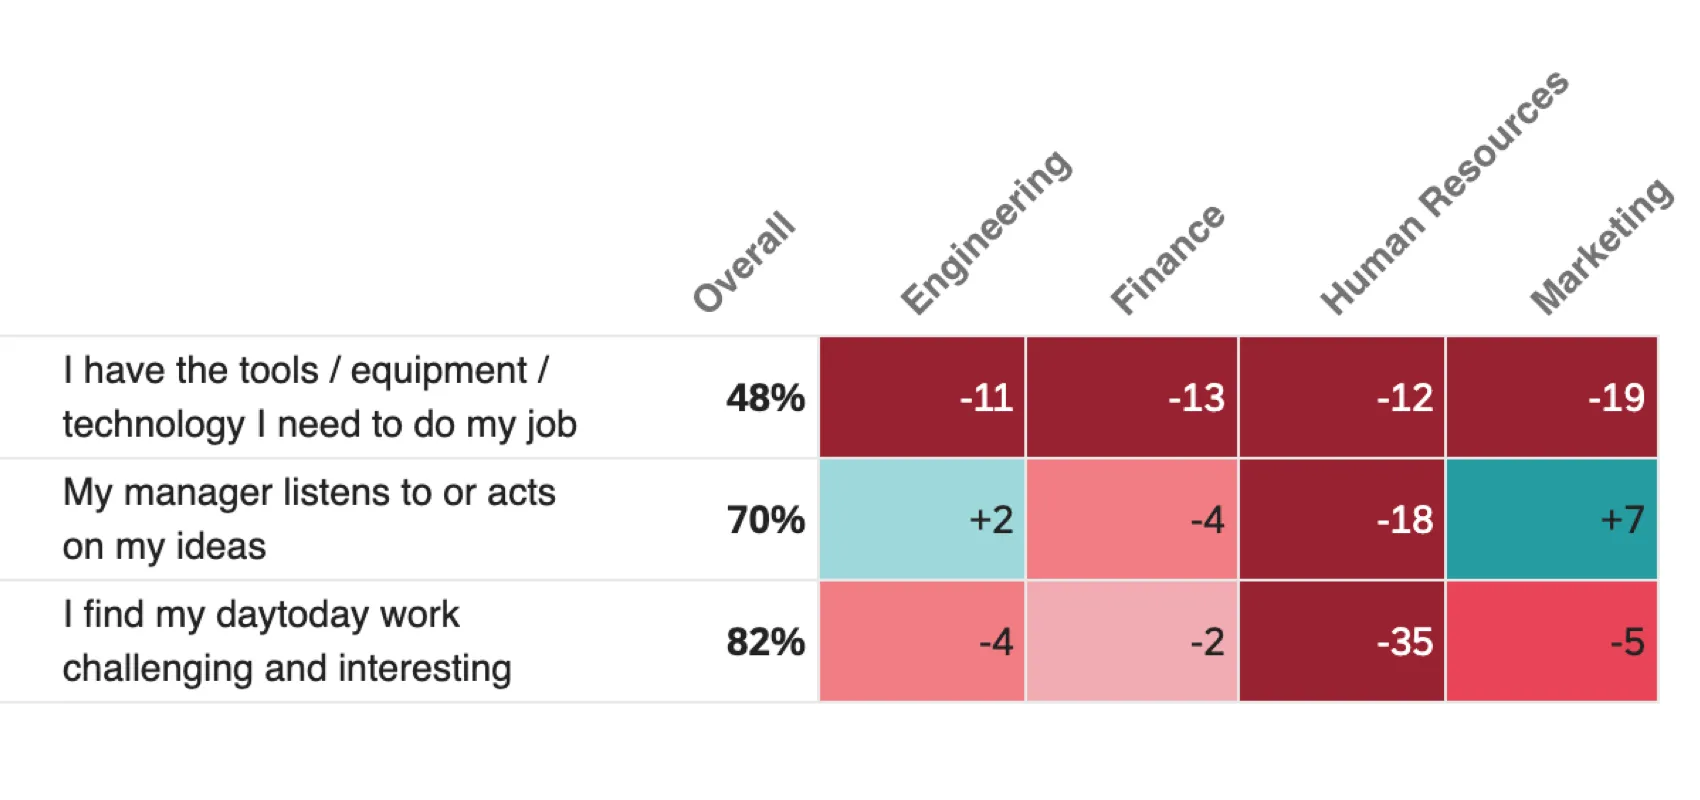
Heat Map Visualization
The Heat Map visualization is a way to rebuild the Heat Map widget from your dashboard to your report template.
Qtip: To use the heat map visualization, you must have at least one comparison in your dashboard.
Attention: By default, the heat map visualization will show data from all data sources in report templates. (In dashboards, the heat map only shows the primary data source by default.) To limit data to one data source, add a visualization filter for that data source. If you do not add a filter, the report template and dashboard may show different data.

Qtip: If you see the error message, “This dashboard is using an unsupported version of scales,” then you must update your dashboard’s scales before you can use this widget. See the Scales Error Messages & Troubleshooting page for more information.
Differences from the widget
For the most part, the heat map has the same setup in reports and dashboards, with a few exceptions:
- The visualization can display up to 100 items and categories total.
- Only one comparison or benchmark for the visualization.
- Only one breakout for the visualization.
- No dynamic benchmarks.
- If there are more rows and columns than fit on a single page, those rows and columns will be carried over to a new page (first rows, then columns).
That's great! Thank you for your feedback!
Thank you for your feedback!