Insights Basic Overview
About Insights Basic Overview
The Insights overview page is a great place to see the total number of mentions tracked in a topic, the sources they came from, the sentiment they have and much more. Click on a topic to pull up more information about it.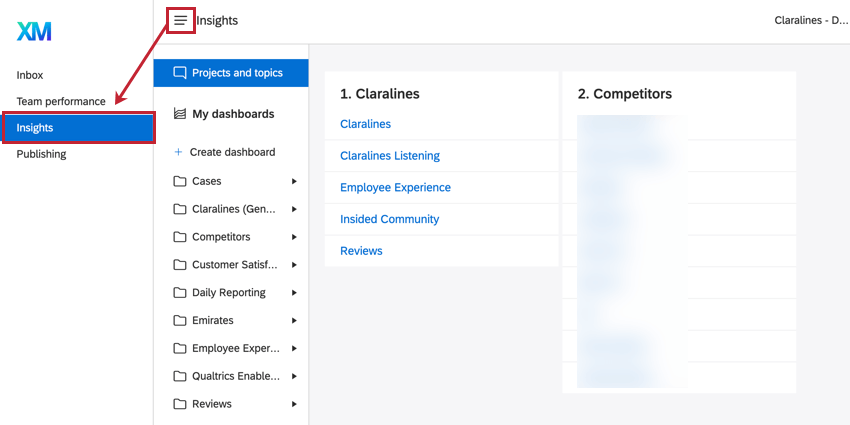
Total Mentions
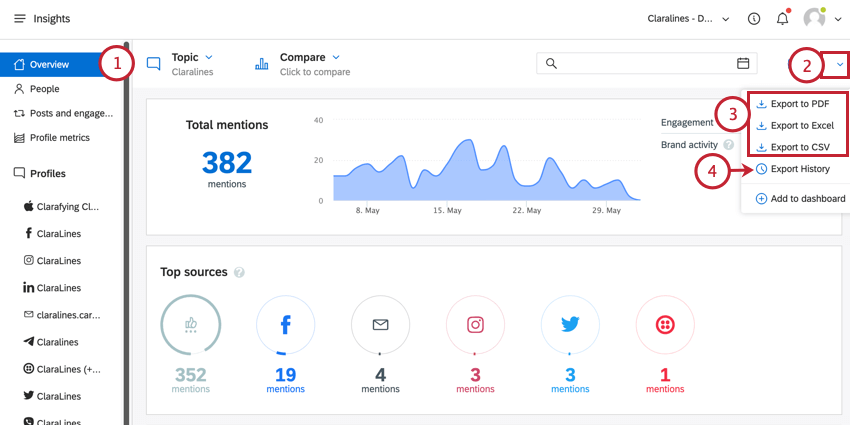
When looking at the Insights overview, the first section is the total mentions widget. In this widget, the total number of mentions tracked matching the topic setup is displayed for the selected date range. 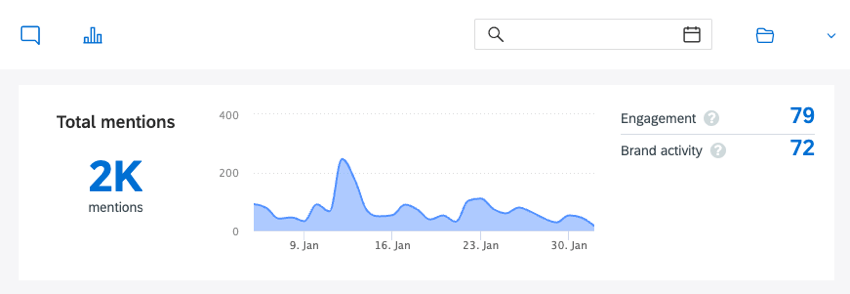
On the right hand side the Engagement and Brand Activity is displayed. See below for more information about each of these fields.
Engagement
Engagement is the total number of times the community engaged with the social profiles connected to your topic(s).
Depending on the source, this includes different data:
- Facebook: Comments, replies, wall posts and private messages by others on the Page.
- Twitter: Private messages, replies, @-mentions and retweets by others towards the Twitter account.
- LinkedIn: Comments by others in relation to content by the page.
- Instagram: Comments and replies by others on uploads from the Profile.
- YouTube: Comments and replies by others on your Youtube posts.
Brand Activity
Brand activity includes all activity by the social profiles connected to the selected topic.
Depending on the source, this includes:
- Facebook: Posts, comments and private messages sent by the profiles itself.
- Twitter: Tweets, replies, native retweets and direct messages.
- LinkedIn: Posts and comments made by the profile.
- Instagram: Posts, comments and likes.
- YouTube: Uploaded videos and comments.
Top Sources
The top sources widget displays a breakdown of which sources represent the biggest parts of the dataset for the selected topic(s). The widget displays the amount of mentions per source. When hovering over the source, a detailed breakdown of these mentions will be shown.
By default the top 8 social sources are displayed. You can click Show all at the right top to see the mentions for all available sources.
Sentiment, CSAT, and NPS
The Sentiment, CSAT, and NPS widgets give the option to either dive deeper into the sentiment of the dataset or look into the CSAT and NPS scores in the dataset.
All three widgets follow the same structure where the left side shows a general breakdown of the dataset for the selected period, while the right side displays a chart that breaks data up into the selected date grouping.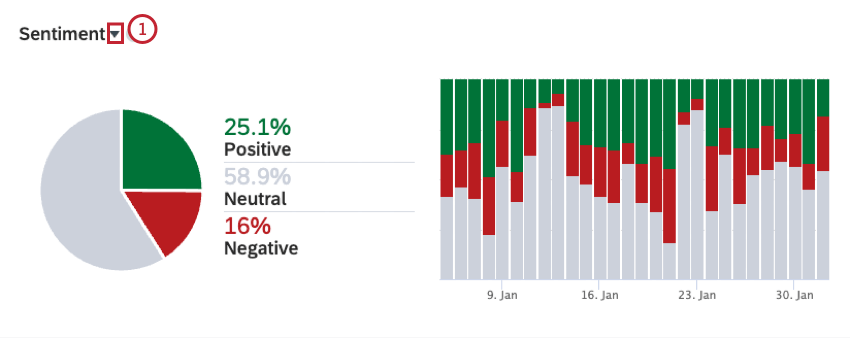
- Click the dropdown arrow next to the title of the widget to display a different widget:
- Sentiment: Displays the sentiment breakdown for all mentions (from selected topic(s) and filter) both generally and split into the chosen date grouping. These numbers are entirely based on the number of mentions in the Inbox and grouped by sentiment value.
- CSAT: Displays a CSAT breakdown for all mentions (from selected topic(s) and filter) both generally and split into the chosen date grouping.
- NPS: Displays an NPS breakdown for all mentions (from selected topic(s) and filter) both generally and split into the chosen date grouping.
Trends, Word Clouds, and Hashtags
The trends, word cloud, and hashtag widgets provide different visualizations of trending topics and words used in your selected dataset. All of these are calculated in real time based on the selected dataset and filtering.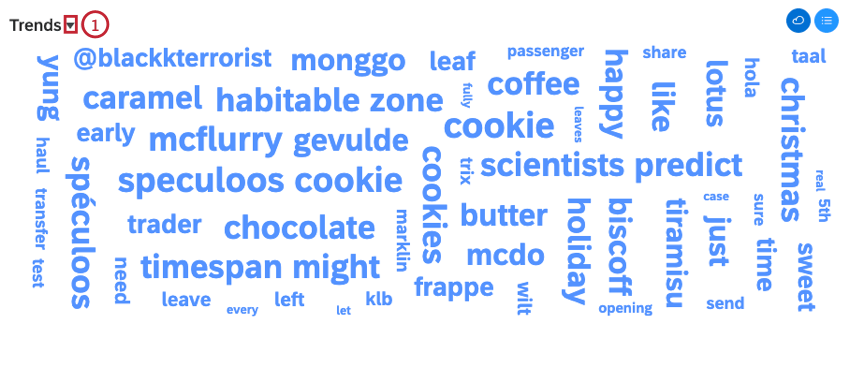
- Click the dropdown arrow next to the title of the widget, in the top left corner, to display a different visualization:
- Trends: Shows headline phrases instead of just individual words or hashtags. Phrases may contain more than two words because these are computed from bigram frequencies only (pairs of words).
- Word Cloud: Shows individual words, where more frequent words are shown in a larger font. Stop words are not shown.
- Hashtags: Shows hashtags, where hashtags that are more frequently used are shown in a bigger font size.
- Advanced: The Advanced option will give you a larger variety of word clouds in XM Discover.
- Category Tags: When category tags are activated in your account, the dropdown will also include the names of the active category models. When selected, the widget will render a word cloud based on the frequency of these tags.
Top Photos, Videos and Links
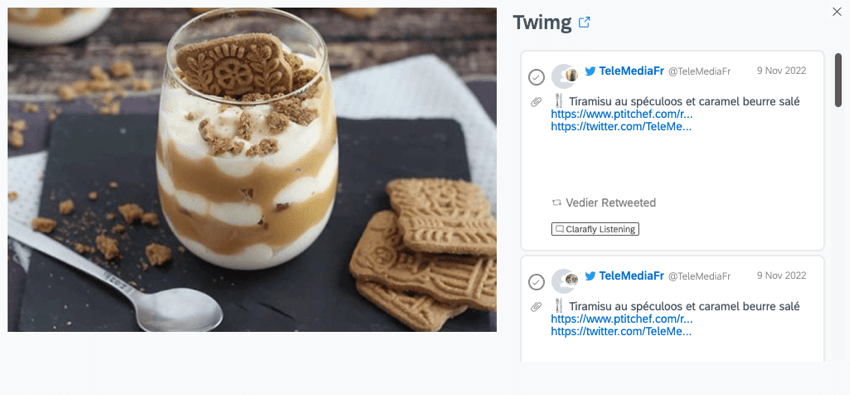
The top photos, videos, and links widgets display valuable information about the visual content that most frequently appears in your selected dataset.
- The dropdown menu next to the title in the top left corner allows you to pick between three options:
- Top Photos: See the photos that are most often included or referred to in mentions in the dataset.
- Top Videos: See the videos that are most often included or referred to in mentions in the dataset.
- Top Links: See the links that are most often included or referred to in mentions in the dataset.
Top Websites and Most Shared Websites
The top websites and most shared websites widgets display simple sets of data that can be helpful when trying to understand which websites provide the most value for the business.
- Top Websites: Ranked according to the number of mentions on that website about your topic. This list will typically contain user content driven sites such as Facebook, Twitter, and forums or message boards relating to your field.
- Most Shared Websites: Ranked according to how much they are mentioned by others in relation to your topic. So if a mention of your topic also contains a link to a website, that site is a candidate for this list.
Exporting Insights
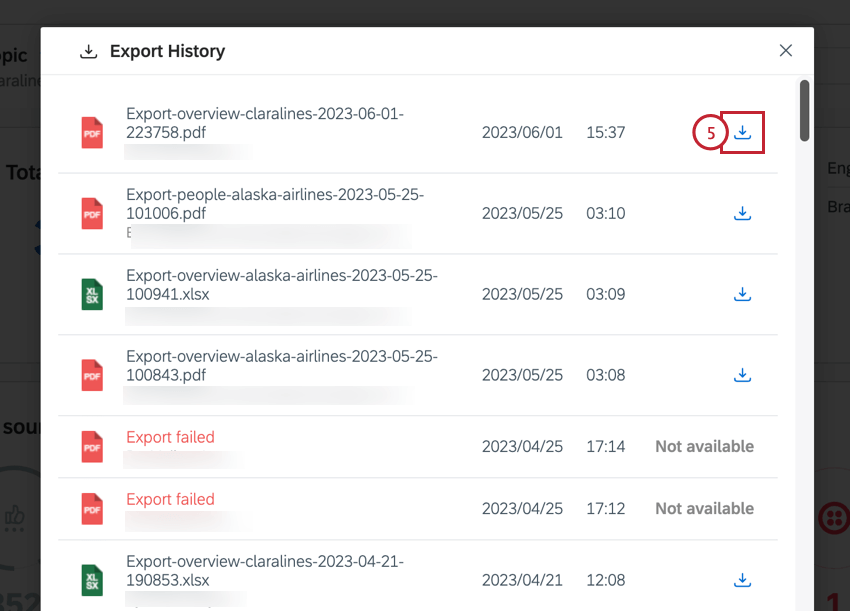
You can export your Insights at any time. You can also view any past exports and download them as needed.
To export your Insights:
