
Distributions Table Widget (CX)
What's on this page
About Distributions Table Widgets
Attention: This widget has been deprecated. Brands created after April 9, 2026 cannot create distributions table widgets. Use the XM Directory Respondent Funnel to report on distribution data.
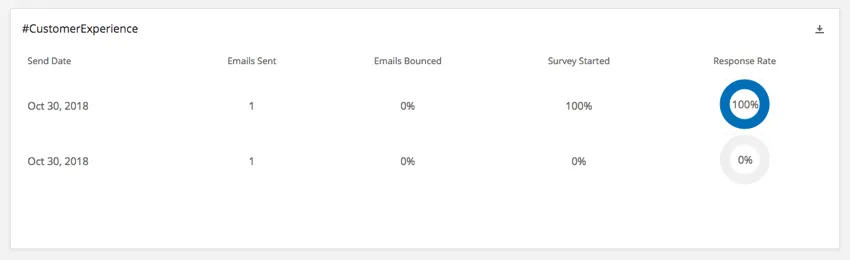
The distributions table widget displays a summary of the distributions that have been sent out for all surveys that are mapped to the dashboard.
This widget will automatically pull in information from distributions of surveys mapped to the dashboard. It does not require that you manually map any data fields.
Qtip: SMS and WhatsApp distributions cannot be displayed in this widget.
Attention: If the dashboard is shared, those users will need to have the distribute permission enabled for that survey in order to view its data in the distributions table widget. Alternatively, use the XM Directory Respondent Funnel to share distribution data without sharing the survey.
Columns Displayed
- Send Date: The date the distribution was sent.
Email Sent: The number of emails in the distribution that have left the Qualtrics server.

Qtip: Email reminders are not included in this count.
Qtip: Once an email has left our server, we cannot guarantee that the email will not be affected by any filters or blocklist set up on the opposing end.
- Emails Bounced: The number of emails that did not reach the recipient’s inbox. This could be for a number of reasons: the email address doesn’t exist, the receiving server has a high security firewall, the receiving mailbox is full, the recipient server is offline, etc.
- Surveys Started: The number of surveys where the recipient has at least clicked on the link, but hasn’t submitted the survey.
- Response Rate: The percentage of responses that have been completed, not just started.
You cannot customize the columns in this widget. For more freedom over distribution reporting, consider the XM Directory Respondent Funnel.
Widget Customization
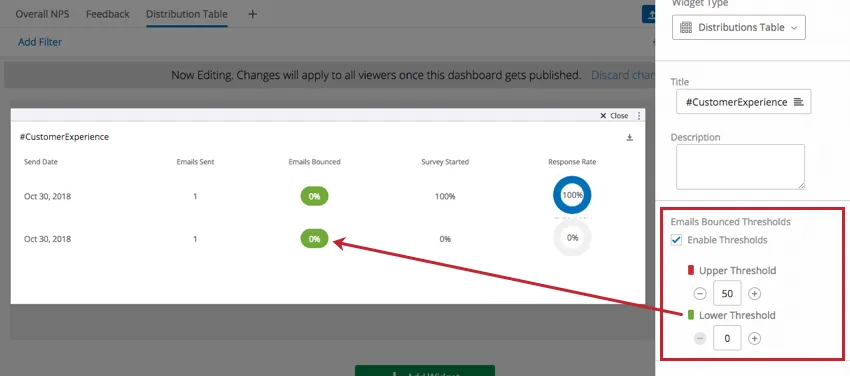
Enable Thresholds
Selecting this option allows you to choose the color that the Emails Bounced percentage should be if it reaches certain thresholds. The Lower Threshold should be set to a lower percent value than the Upper Threshold. When the Bounced Email percentage reaches the Lower Threshold, it will change to be the selected color. The color will change again when the Bounced Email percentages reaches the Upper Threshold.
FAQs
Does distribution information for personal links appear in the Distributions Table widget in CX Dashboards?
Does distribution information for personal links appear in the Distributions Table widget in CX Dashboards?
How is response rate calculated in the Distributions Table widget in CX Dashboards?
How is response rate calculated in the Distributions Table widget in CX Dashboards?
That's great! Thank you for your feedback!
Thank you for your feedback!