
Custom Math Metrics (Studio)
What's on this page
About Custom Math Metrics
Use a custom math metric to build different mathematical expressions, using different metrics and attributes.
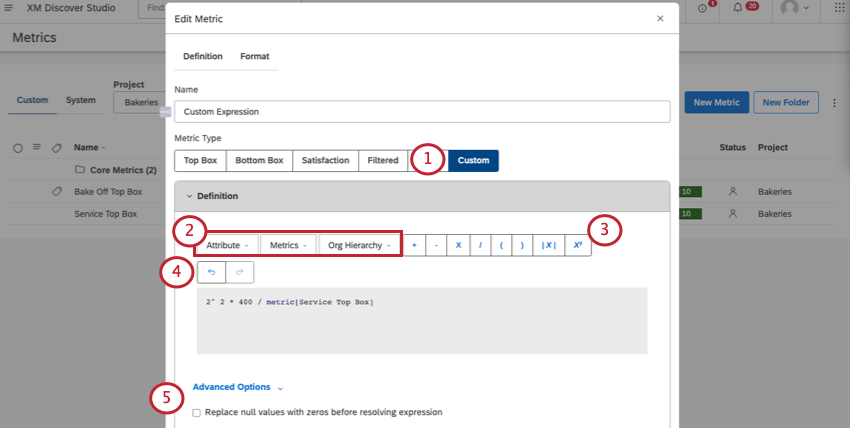
Defining a Custom Math Metric
This section describes what you need to fill out in the Definition tab of your custom math metric.
Qtip: For steps to create and format a metric, see Creating Metrics.
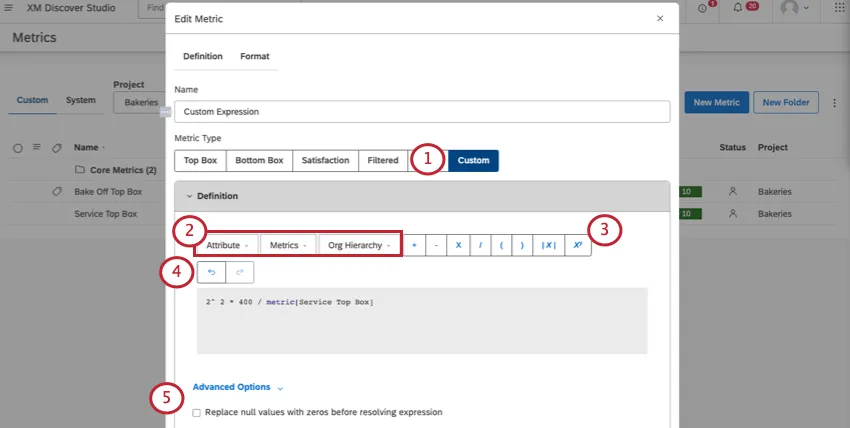
- Attributes: Select an attribute from the list and choose how you want to aggregate it. For a list of ways you can aggregate your attributes, see the Attributes section below.

Qtip: Instead of selecting from the list, you can also pull attributes using the following syntax:
Aggregation-type[attribute-name]
Example:
average[Age] - Metrics: Select a metric from the list. See Metrics below for a list of everything available.
- Org Hierarchy: Select an enrichment parameter defined for a Studio org hierarchy.
Qtip: Instead of selecting from the list, you can type the name of the parameter using the following format:
hierarchy[org-hierarchy-name >> parameter-name]Example:
hierarchy[Acme Hotels >> Target Sentiment]
Qtip: This is particularly useful for weighted combinations of multiple scores. See Custom Metric Examples.
Attention:You can add up to 10 variables (metrics and / or attributes) to your custom math metrics.
Metrics
You can add metrics to your custom math formulas. A list of all the metrics you created, metrics shared with you, and scorecard metrics will also appear.
Qtip: You will not be able to use custom math metrics in your formulas.
You will also see the following premade metrics at the top of the list:
- Volume: Count the number of records from the dataset.
- % Total: Figure out what percent of the total data your filtered subset is. The following formula is used:
Percent Total = (Number of filtered records from the subset) / (Total number of records) - % Parent: Find the subset’s filtered volume percentage to the unfiltered volume of the group. The following formula is used:
Percent Parent = (Number of filtered records from the subset) / (Number of unfiltered records for the group)Example: Let’s say we have a metric that calculates percent parent for feedback from Boston. If we use it in a top 10 topics report, each topic’s value for the filter metric will be calculated as follows:
Percent Parent for Topic A = (Volume where CITY is Boston AND TOPIC is Topic A) / (Volume where TOPIC is Topic A) - Sentiment: Find the average sentiment of sentences from the dataset.
- Effort: Find the average effort score of sentences from the dataset.
- Emotional Intensity: See Emotional Intensity.
Qtip: You can create reusable numbers with a value metric in order to use these numbers in your formulas. This way you can update the variable’s value in one place and have that change reflected in all custom math metrics that use it.
Syntax
Instead of selecting metrics, you can type the following in your formula:
- For premade metrics, you do not need a prefix.
Example:
[Volume] - For scorecard metrics, use the “scorecard” prefix.
Example:
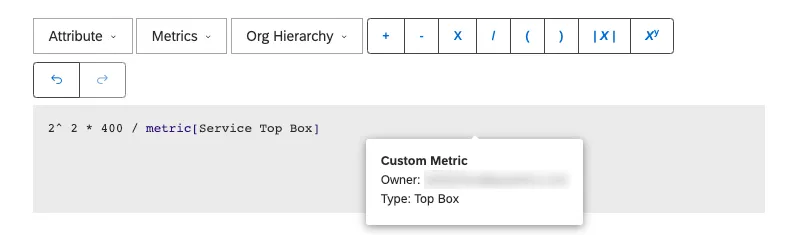
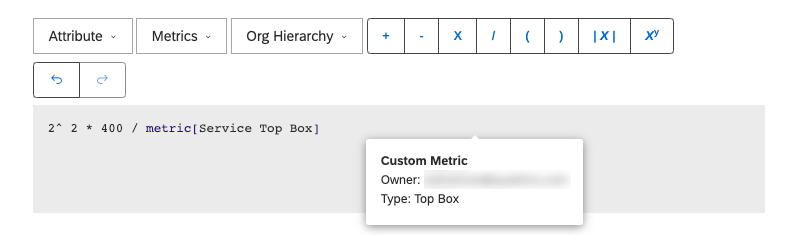
scorecard[% Failing - Opening/Closing] - For user-created metrics, use the “metric” prefix.
Example:
metric[My Top Box]
Available Math Operations
Addition, Subtraction, Multiplication, and Division
1 + 2 - 3 / 4 * 8 resolves to -3. Parentheses
Parentheses may be added to specify order of operations.
( 1 + 2 - 3 ) / 4 * 8 resolves to 0. Exponents
6 ^ 2 resolves to 36. Absolute Value
To define an absolute value, click the absolute button ( |x| ) and place the value, attribute, or metric inside the parentheses.
abs(-2) would resolve to 2.

abs(average[Bake-Off Score]) would calculate the absolute value of your average Bake-Off Score.
Attributes
You can use an attribute in your metric. Non-numeric attributes are counted as a total number of distinct attribute values (i.e., “count distinct”).
Example: If your attribute is “Country”, and you have 20 countries saved, your result would be 20.
If your attribute is numeric, you’ll be able to set your attribute to any of the following:
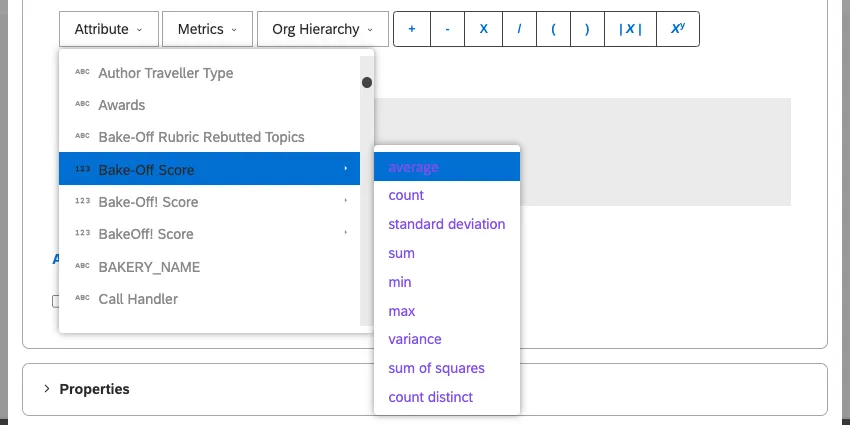
- average: The average value of the attribute.
- count: The total number of records containing this attribute.
- count distinct: The total number of distinct attribute values. Qtip: If you’re interested in having “count distinct” enabled for numeric attributes, reach out to your Discover representative.
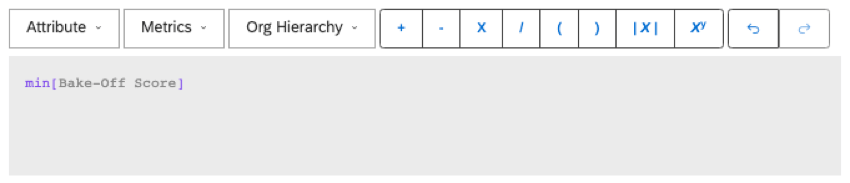
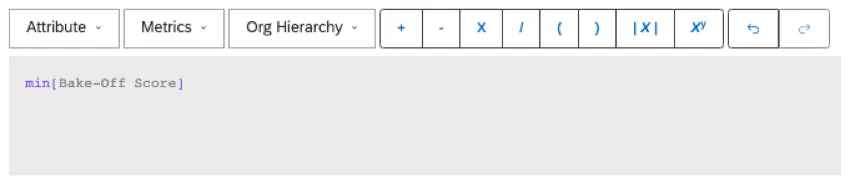
- max: The maximum value of the attribute.
- min: The minimum value of the attribute.
- sum: The sum of the attribute’s values.
- standard deviation: Standard deviation is a statistical measure of the amount of variation of an attribute’s values relative to its mean. The higher the standard deviation, the further an attribute’s values are from the mean.
- variance: Variance is a statistical measure of how far an attribute’s values are spread out from the mean. Variation is the standard deviation squared.
- sum of squares: The sum of squares is a statistical measure of the deviation of an attribute’s values from the mean. The higher the sum of squares, the larger the variability within the dataset.
Tips for Creating Formulas
- In addition to attributes, metrics, and org hierarchy parameters, you can use exact numeric values in your math operations.
- There is a limit of 15 variables (metrics and/or attributes) per custom calculation. Value metrics do not count toward this limit.
- If any part of the custom math metric expression contains a null value, the whole metric will also return a null.
- Start typing the name of an attribute or metric to see a list of suggestions.
- Hover your mouse over an attribute or metric to see additional details.
- Use the undo and redo buttons as needed.
Mouse and Keyboard Shortcuts
| Shortcut | Result |
|---|---|
| Single-click an attribute or metric | Highlight the component and display suggestions for replacement. |
| Double-click an attribute or metric | Set the cursor in the clicked point to type inline. |
| Control + Z (Windows) or Command + Z (Mac) | Undo the last edit. |
| Control + Y (Windows) or Command + Y (Mac) | Redo the most recently undone edit. |
Examples of Custom Math Metrics
Adjusting Numeric Attributes
By default, when you add a numeric attribute to a widget (such as a score), they’re formatted as averages. You can change this to a sum, but if you want to use something else, like a minimum, custom math metrics can help.
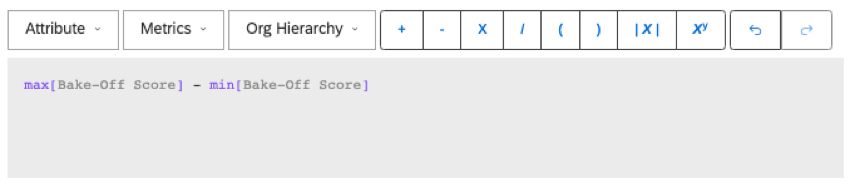
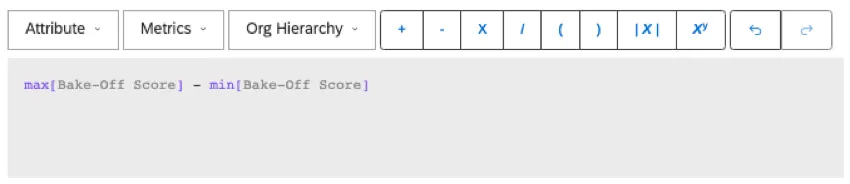
Calculating a Scoring Range
To calculate the score’s range, calculate the difference between the maximum and minimum value of your scoring attribute.
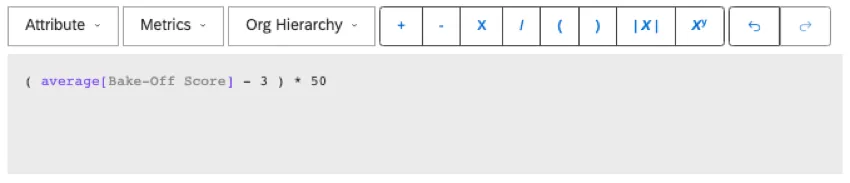
Changing the Scale of a Score
If you want to adjust the scale of a score, you can use a custom match metric.
Example: We have an attribute that rates our company’s services from 1 to 5. We want to show these scores on a scale from -100 to 100 instead.
We use number 3 in the formula to center the scale so that the average score of 3 corresponds to a 0 on the new scale. Everything below 3 will count towards the negative, and everything above 3 will count towards the positive.
Creating a Weighted Average
Here is a weighted average formula with 2 ratings. For every rating you add, make sure to add a sum to the numerator and a count to the denominator.
( sum[Rating1] + sum[Rating2] ) / (count[Rating1] + count[Rating2] ) Qtip: When using weighted averages, we recommend enabling Replace null values with zeros before resolving expression so that empty values do not break the metric.
Calculating Period over Period Change
Report on change over time with a period over period percentage or delta change metric.
Example: For the top 10 topics by volume in the last month, you’d like to display the change in sentiment week over week. Here are some of the metrics you’d need to create:
Qtip: Try color coding with conditional formatting to show the contrast between positive and negative sentiments.
That's great! Thank you for your feedback!
Thank you for your feedback!