
Journeys in Customer Experience Programs
What's on this page
About Journeys in Customer Experience Programs
We can learn a lot about how to help our customers by tracking their journey. Rather than just collecting feedback with no context, we can research a specific process and figure out which milestones in the journey create the least friction for our customers, and which ones need to be adjusted. In Customer Experience programs, it’s easy to set up the journey you want to track, with both pre-made templates and completely customizable journeys available to create.
Example: Think of a customer’s journey at an airline. There’s check-in at a kiosk. There’s security, boarding, and baggage claim. You may give your customers an initial satisfaction survey at the kiosk in the beginning, then text or email them for feedback about the last milestones at the end of their experience. CX Programs allow you to track this journey from start to finish, from distribution to reporting.
We recommend setting up your journey when you first create your Customer Experience program, before you distribute your surveys.
Attention: If you edit an existing journey after you’ve collected data, you may negatively impact the rest of your program.
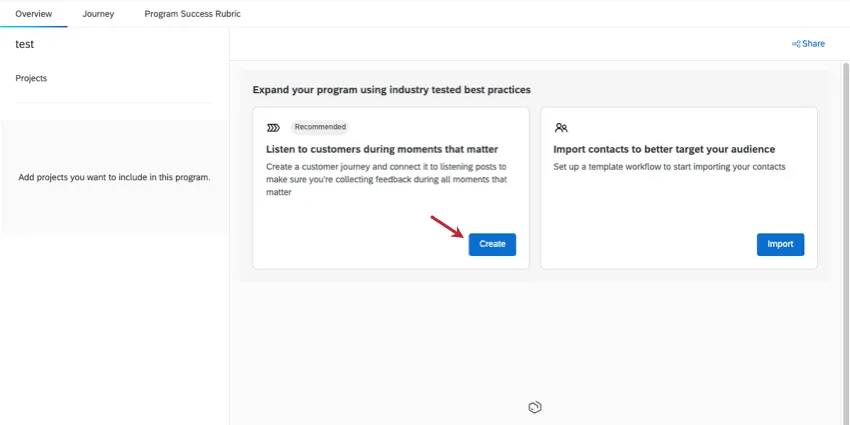
Step 1: Creating a Customer Journey
Attention: The steps to create a Customer Experience program journey are different from other Qualtrics journeys. Please stay on this support page to learn more about Customer Experience program journeys.
Qtip: You can only have 1 journey per program. Journeys can have up to 20 milestones.
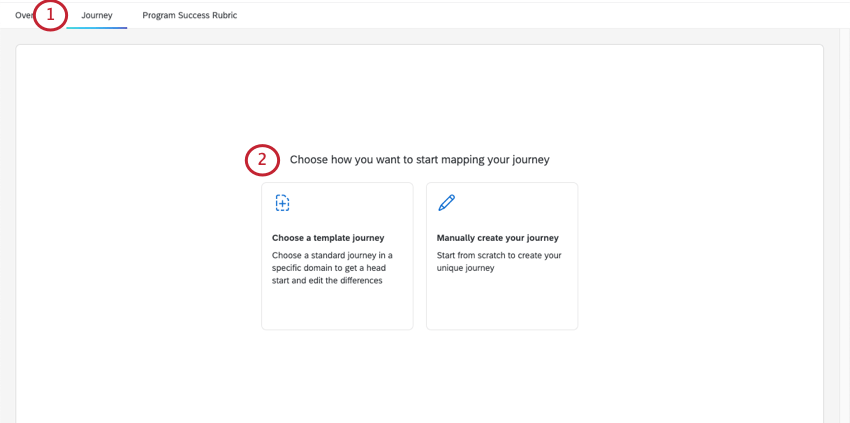
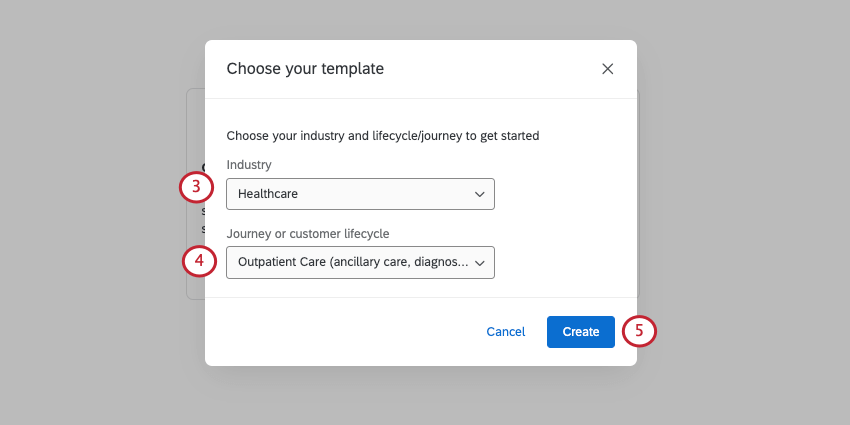
- Choose a template journey: Choose from a list of common customer journeys, as defined by industry experts.
- Manually create your journey: Start from scratch. Create your own stages for a unique journey.
Qtip: If you chose to manually create a journey, you won’t have steps 3-5. Instead, you’ll go straight to the next section.
Step 2: Customizing a Journey
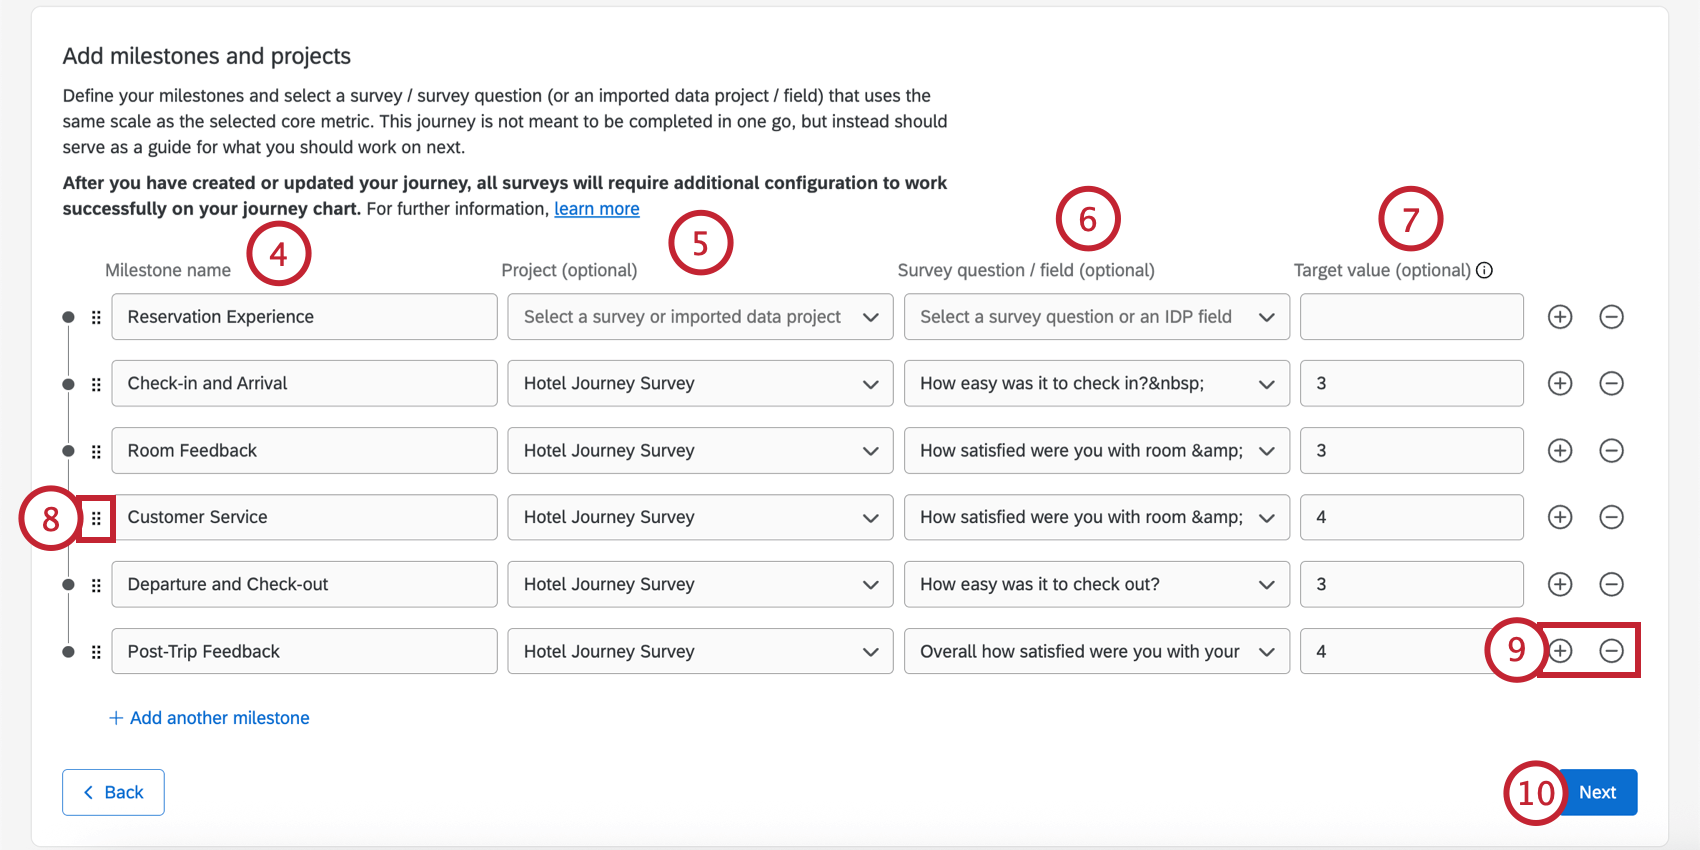
If you chose to manually create a journey, this is the step where you’ll create your milestones.
If you’re creating a journey from a template, this is where you can view the milestones of your journey and edit milestones as needed.
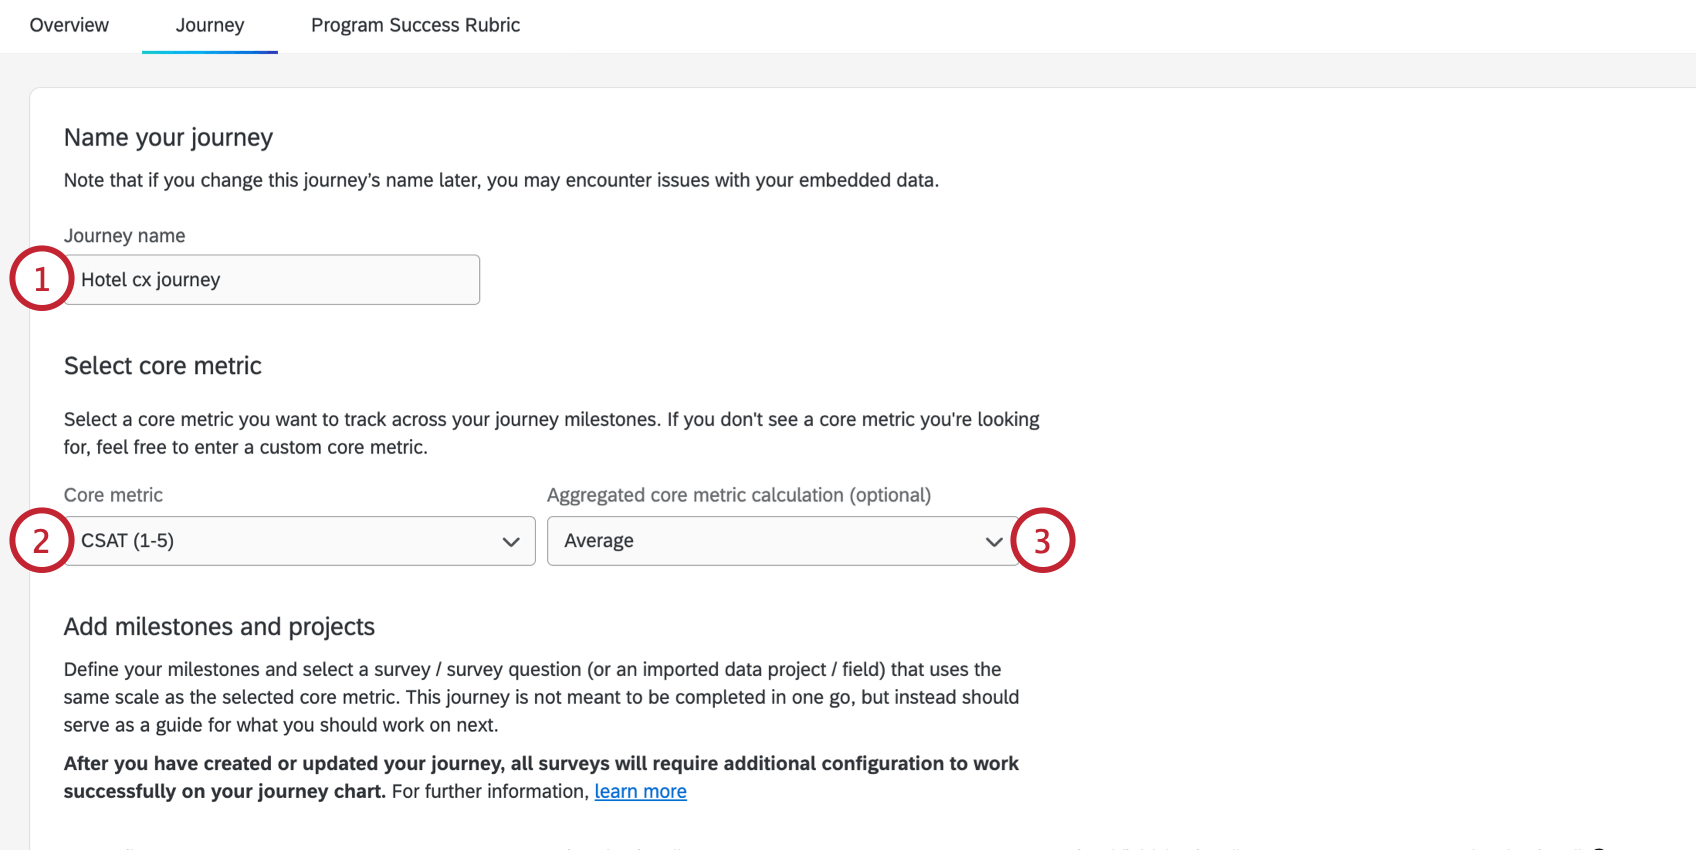
- CES (1-5 or 1-7)
- CSAT (1-5 or 1-7)
- NPS (0-10)
- Custom: Define a custom metric by typing the metric name directly in the metric box.
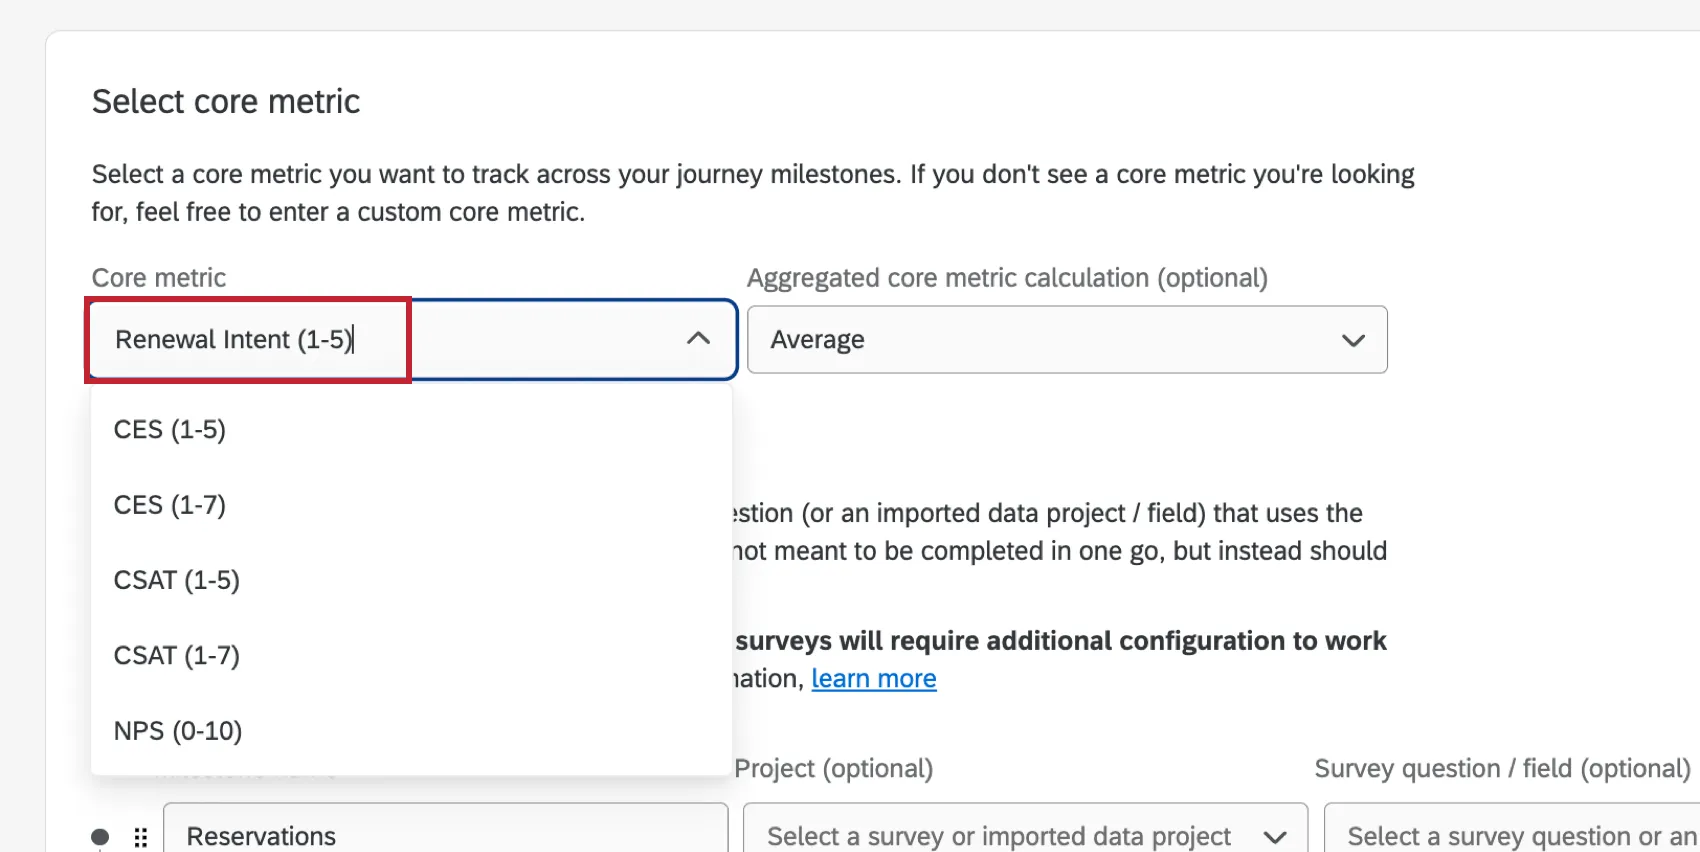

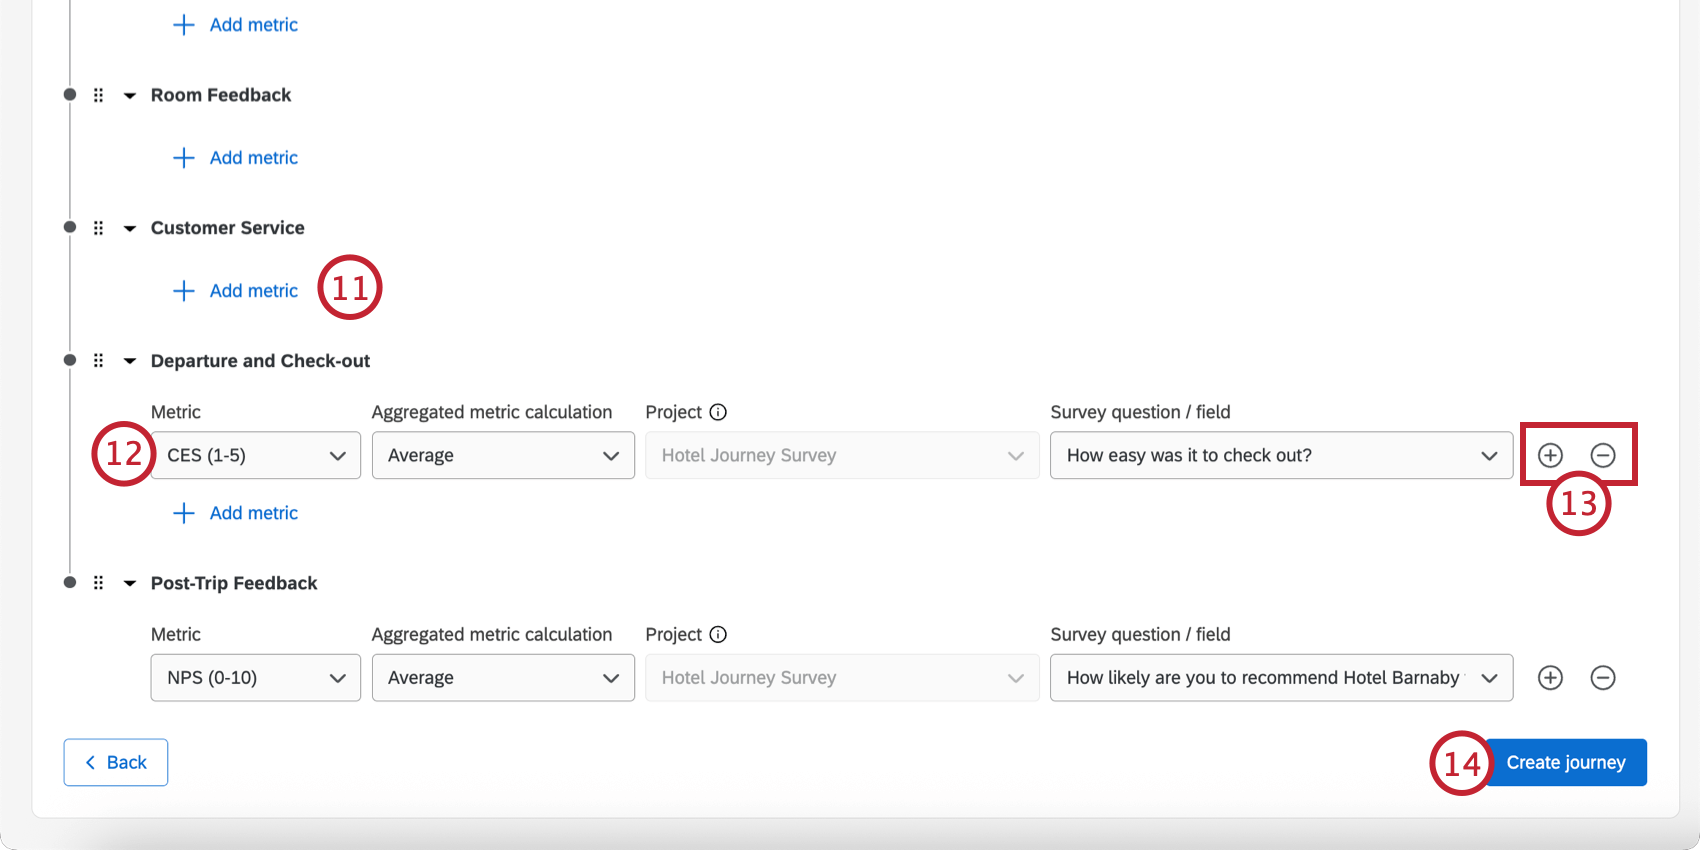
- Metric: Choose the metric to measure (CSAT, CES, NPS, or enter a custom metric).
- Aggregated metric calculation: Choose the calculated metric (e.g., average).
- Survey question / field: Choose the survey question or imported data project field that corresponds to the metric. Qtip: For each milestone, you cannot select a different project from the one you chose for the core metric. However, you can select a different survey question or field.

Step 3: Editing a Journey
It’s common to edit a journey after it’s been created. You may identify additional milestones later down the road, or change the metrics you’re measuring.
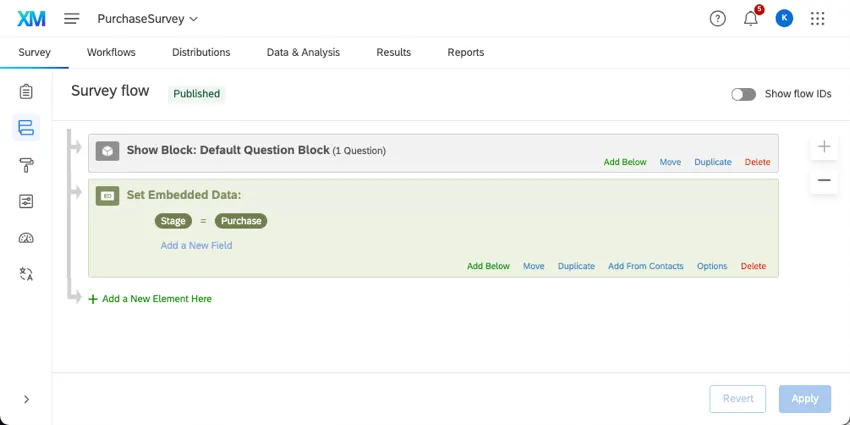
Step 4: Making Sure Embedded Data is Set
Once you have your survey projects connected to different milestones, embedded data will be added to the survey flow for you. This embedded data is important to determining that each milestone (or stage) is identified correctly.
If you are setting multiple milestones in the same survey, you will have to edit your survey to identify each milestone.
See Setting Up Surveys for Journeys for a guide on how to best create your survey. You have 2 options: 1 survey for each milestone and every milestone all in 1 survey.
Qtip: If you’re using an imported data project for a milestone, see this section instead.
Once your surveys are created, see the Programs page on how to add new or existing surveys to your Customer Experience Program. (This step is optional and not required to make journeys work.)
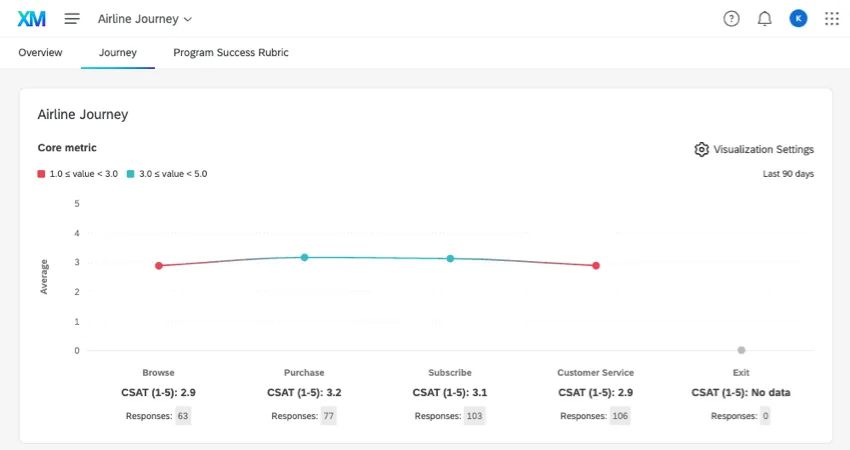
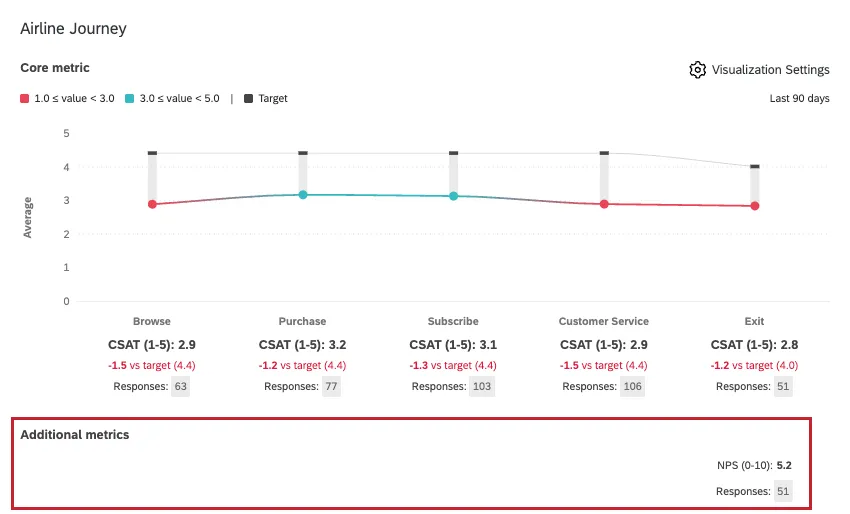
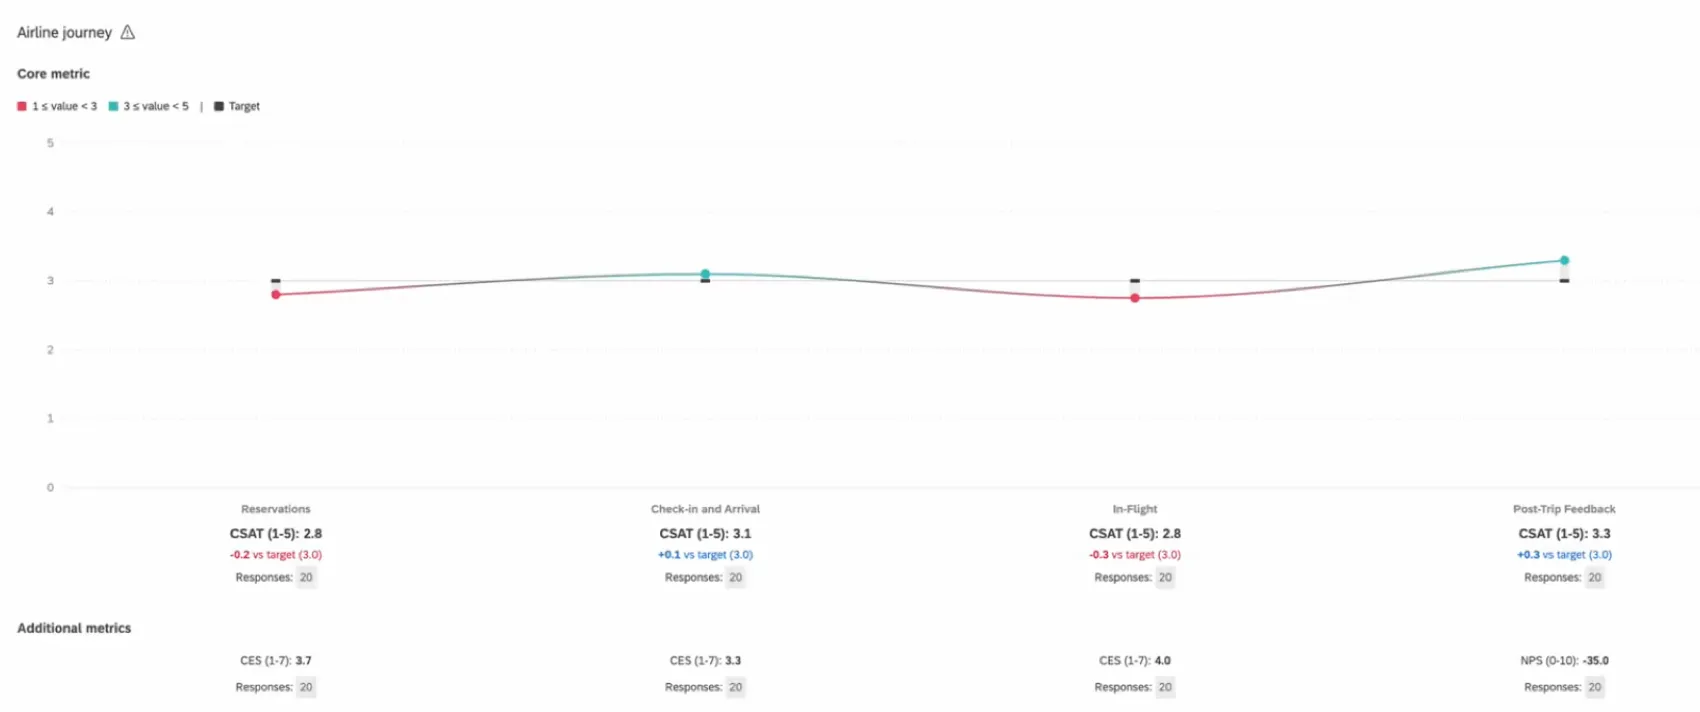
Program Journey Chart
At the top of the Journey section of your CX program is a journey chart, showing metric performance for each stage. This journey chart is similar to the dashboard widget, with a simpler setup and customization.
Required chart setup
Before your journey chart will display data, you need to have set up your program’s journey. The following journey steps are required for this chart:
- Journey name
- Core metric
- Aggregated core metric
- For each milestone:
- Milestone name
- Project
Survey question / field
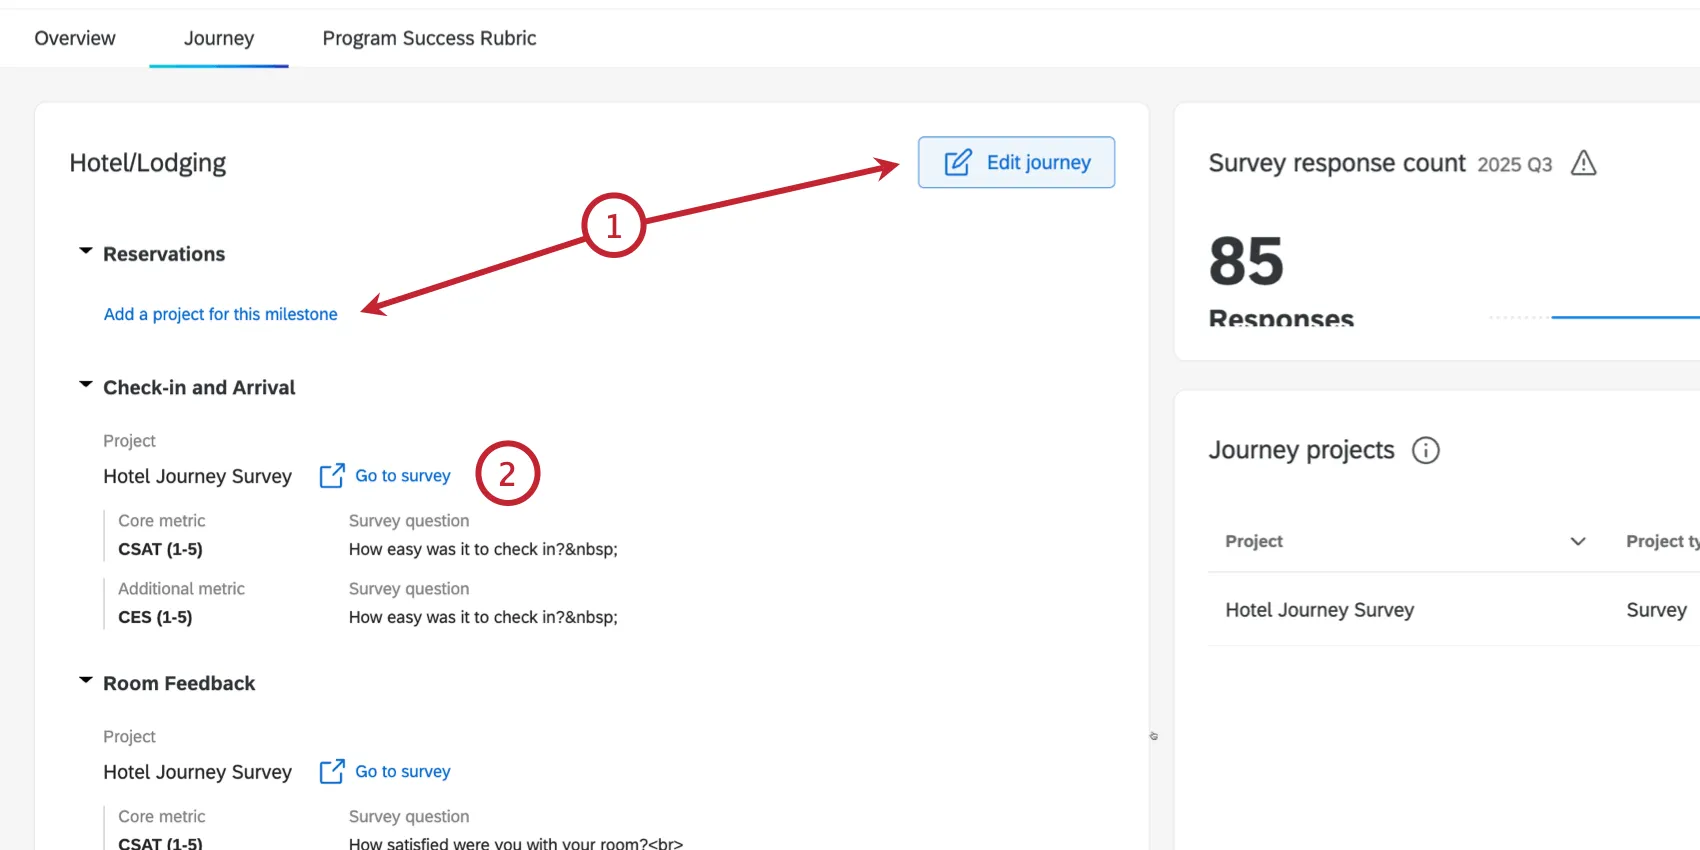
If you’re missing key setup, a banner will appear that you can click to edit your journey. You can also select Edit Journey.
Target value comparisons
Milestone target values are optional in the journey chart. If you include them during your journey setup, the chart will indicate how close each stage is to its individual goal.
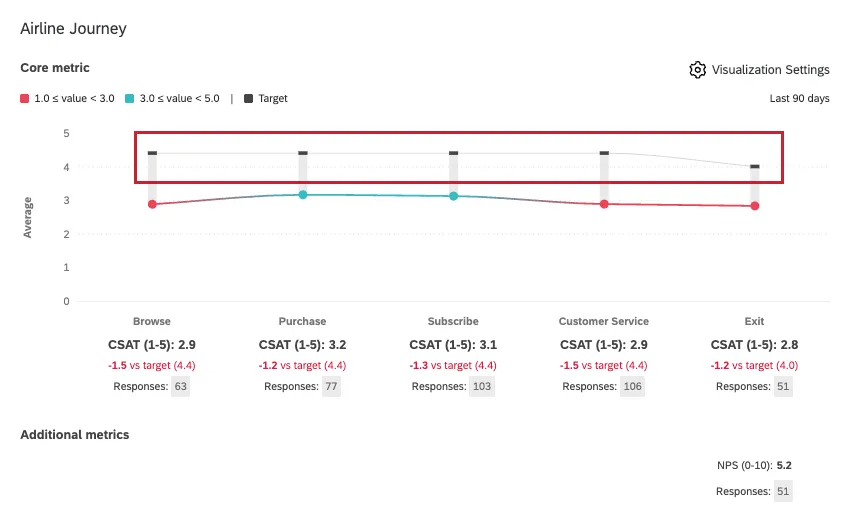
Additional metrics
Additional metrics are optional in the journey chart. If you include them during your journey setup, the chart will show your additional metrics under the chosen milestone(s).
Visualization settings
Click Visualization Settings for more options.
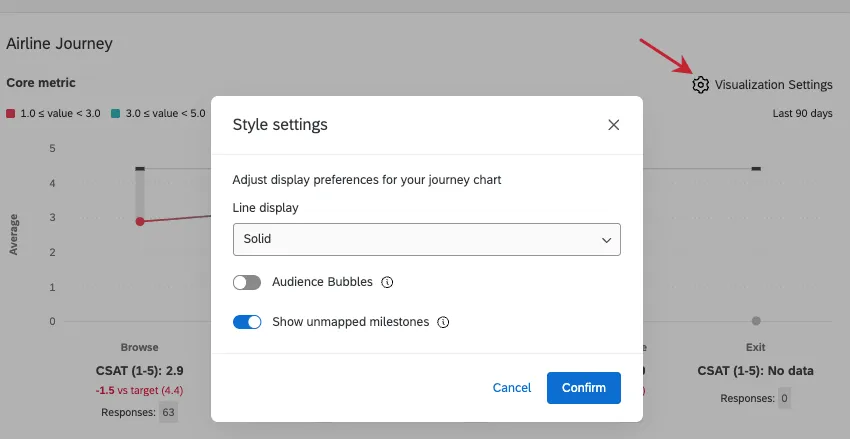
- Line display: Choose between solid, dashed, or none. When “none” is selected, only data points will be displayed without a line.
- Audience bubbles: When enabled, bubbles will display over each data point, increasing in size relative to the response count for that milestone.
Show unmapped milestones: You may have milestones missing a survey field / question that maps back to the core metric. If this is the case, you can use this setting to decide whether the milestones should still appear. For example, you may want to display an unmapped milestone if it has a target value.
When you’re finished, click Confirm.
Using Journey Data
Once you’ve set up your journeys and collected data, you can create dashboards full of journey data. See Configuring Dashboard Data for Journeys and Journey Chart Widget for more details.
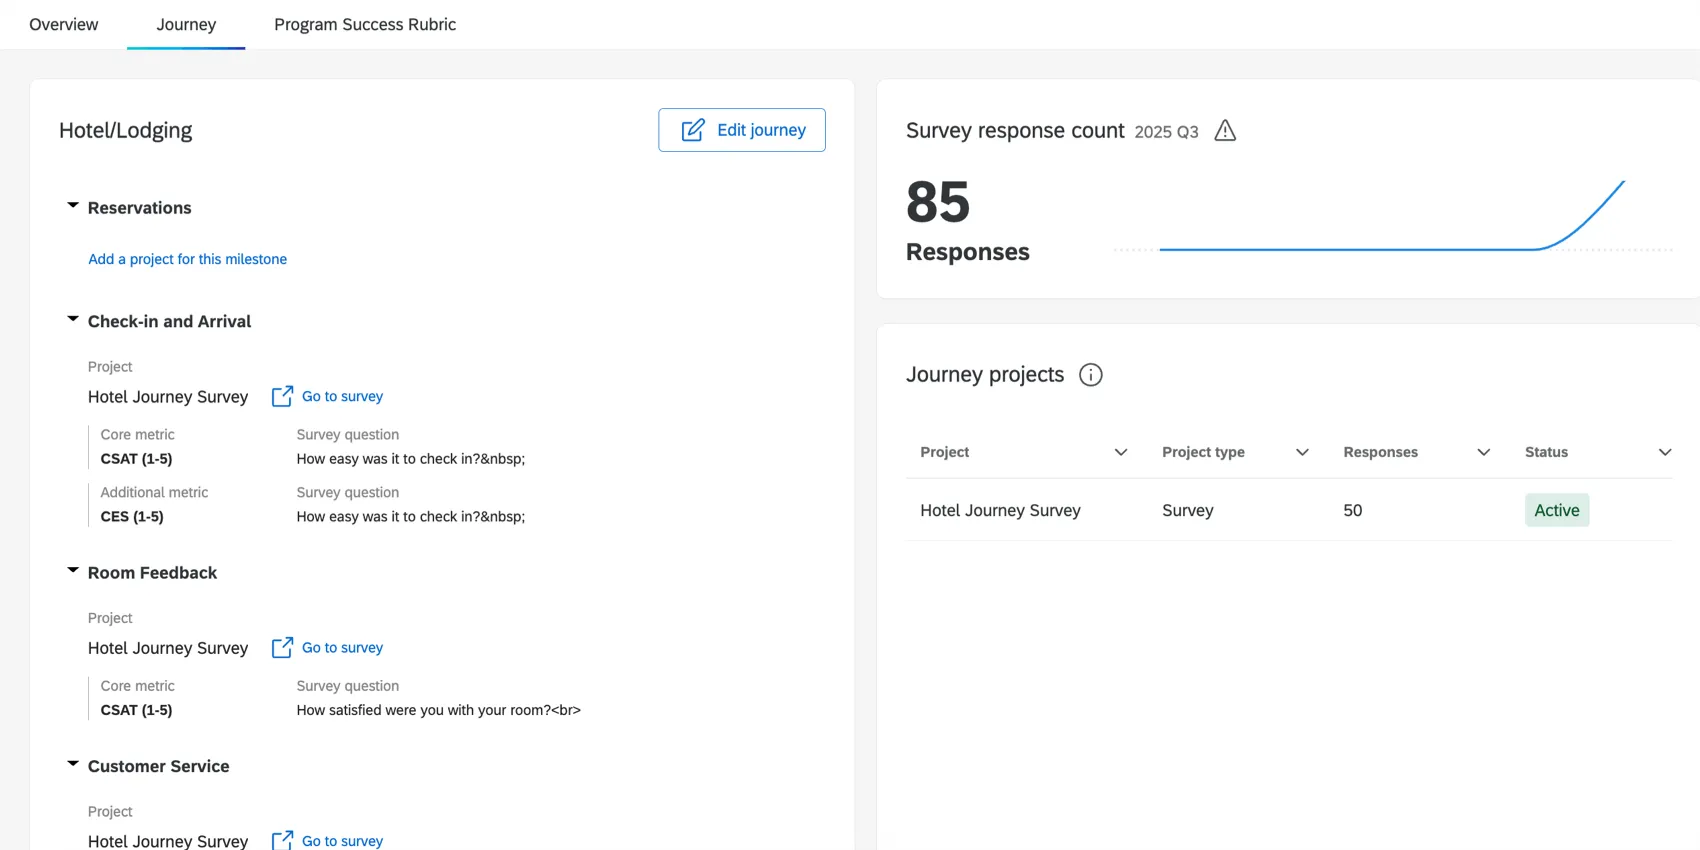
You can also see high level response rates for your journey surveys on the Journeys tab of your Customer Experience Program. This will show you the number of recent responses you’ve collected, what type of project you’ve mapped to each milestone, and whether those projects are actively collecting data.
FAQs
Can I use journeys I made on the Journeys page in my Customer Experience Program?
Can I use journeys I made on the Journeys page in my Customer Experience Program?
Can I use the journey chart widget for my Customer Experience Program?
Can I use the journey chart widget for my Customer Experience Program?
That's great! Thank you for your feedback!
Thank you for your feedback!