
Setting Up Surveys for Journeys
What's on this page
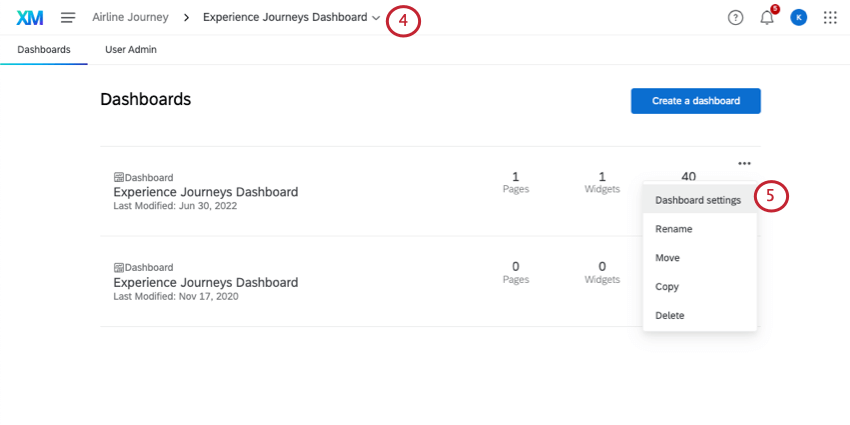
About Setting Up Surveys for Journeys
Before you collect any data, you need to make sure your surveys are set up correctly for journey data. There are 2 different ways you can create your surveys:
You can also use an imported data project to represent a milestone.
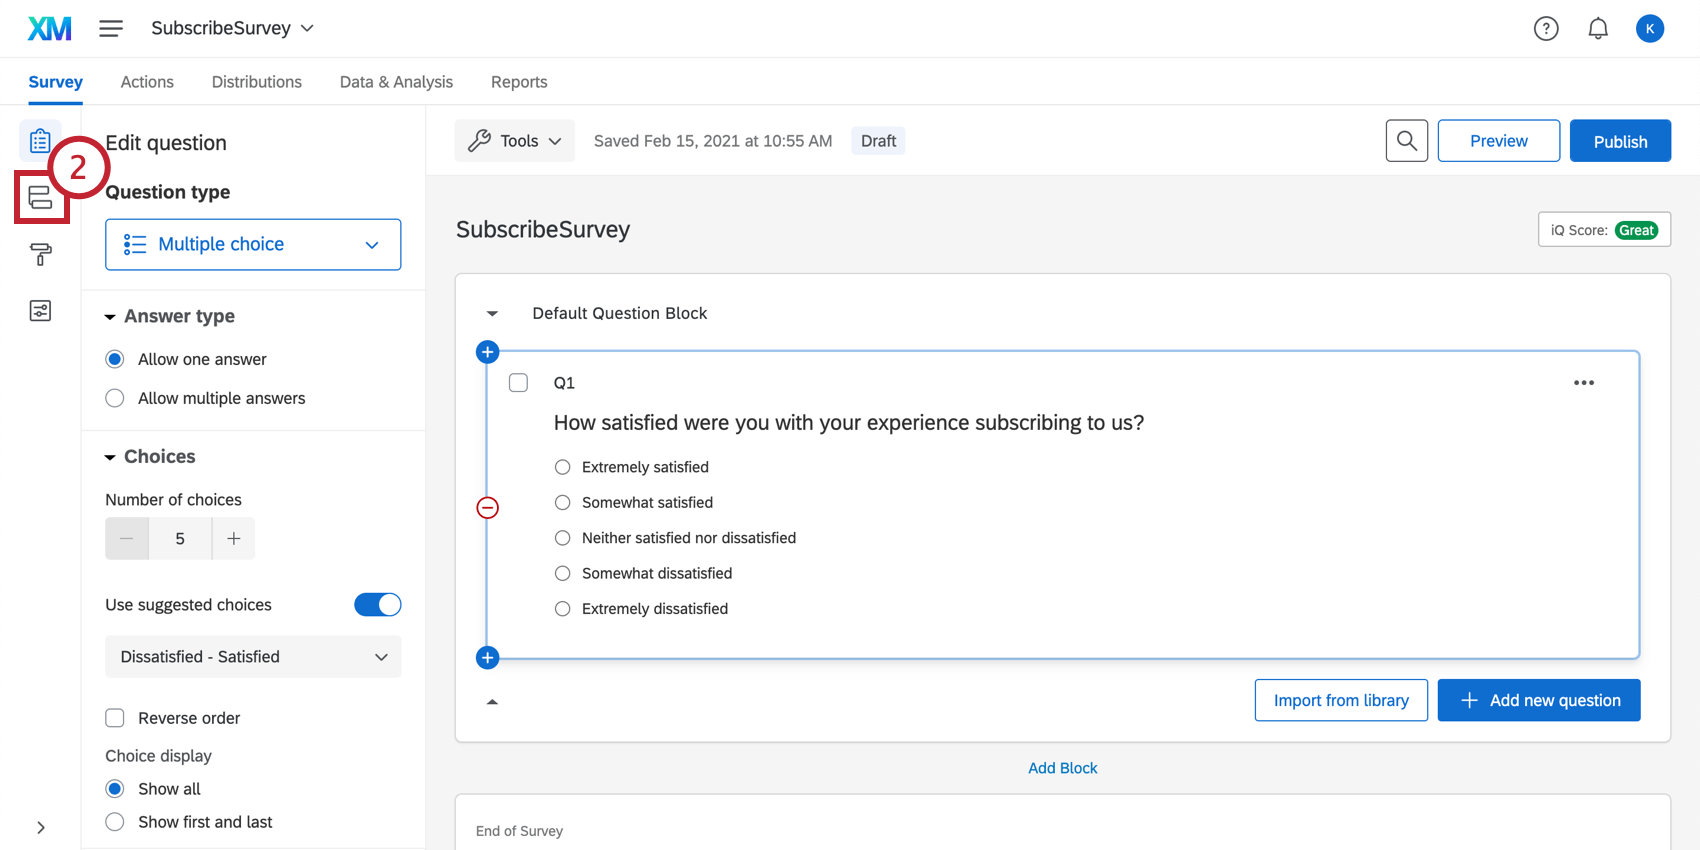
Creating an Outcome Metric
If you want to compare the performance of each stage of your journey, it helps to have a consistent outcome metric. Create the same question in each stage’s survey or branch. You can create multiple matching questions if you’d like to create multiple journey charts analyzing different metrics.
To learn more about what makes a good outcome metric, see this page. You can follow this advice to create an effective outcome metric regardless of whether you’re using the legacy journey setup, a Customer Experience program, or Employee Experience projects.
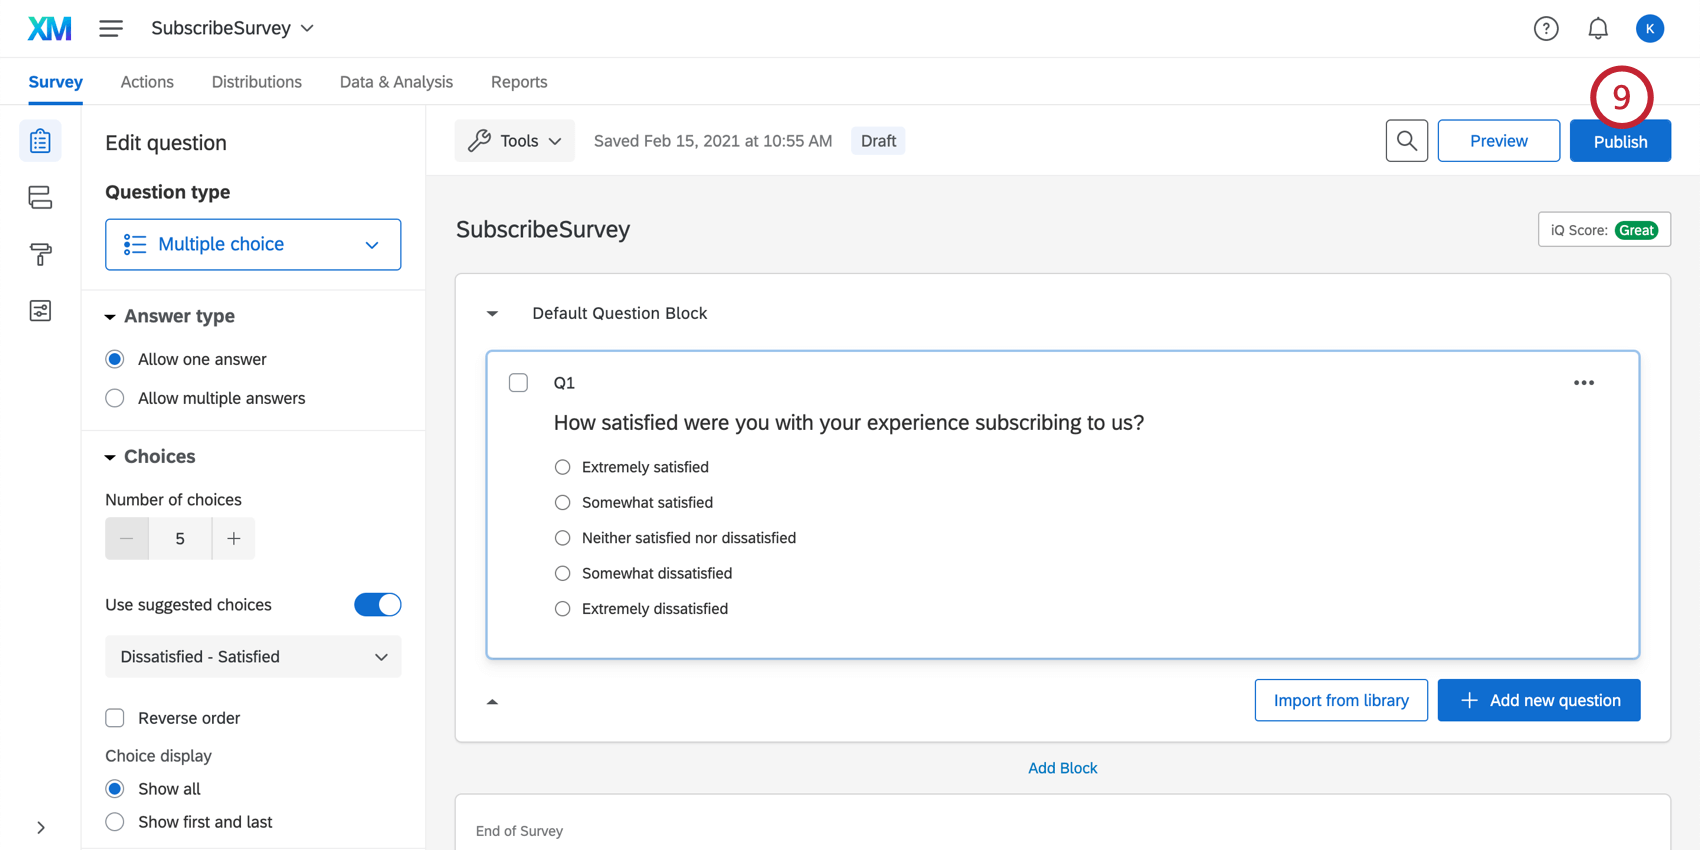
Qtip: We recommend using a simple multiple choice question or an NPS question.
Example: If you’re conducting Customer Experience research, here are some common outcome metrics:
- Customer Satisfaction (CSAT) 1-5
- Customer Satisfaction (CSAT) 1-7
- Customer Effort Score (CES) 1-5
- Customer Effort Score (CES) 1-7
- Net Promoter Score (NPS) 0-10
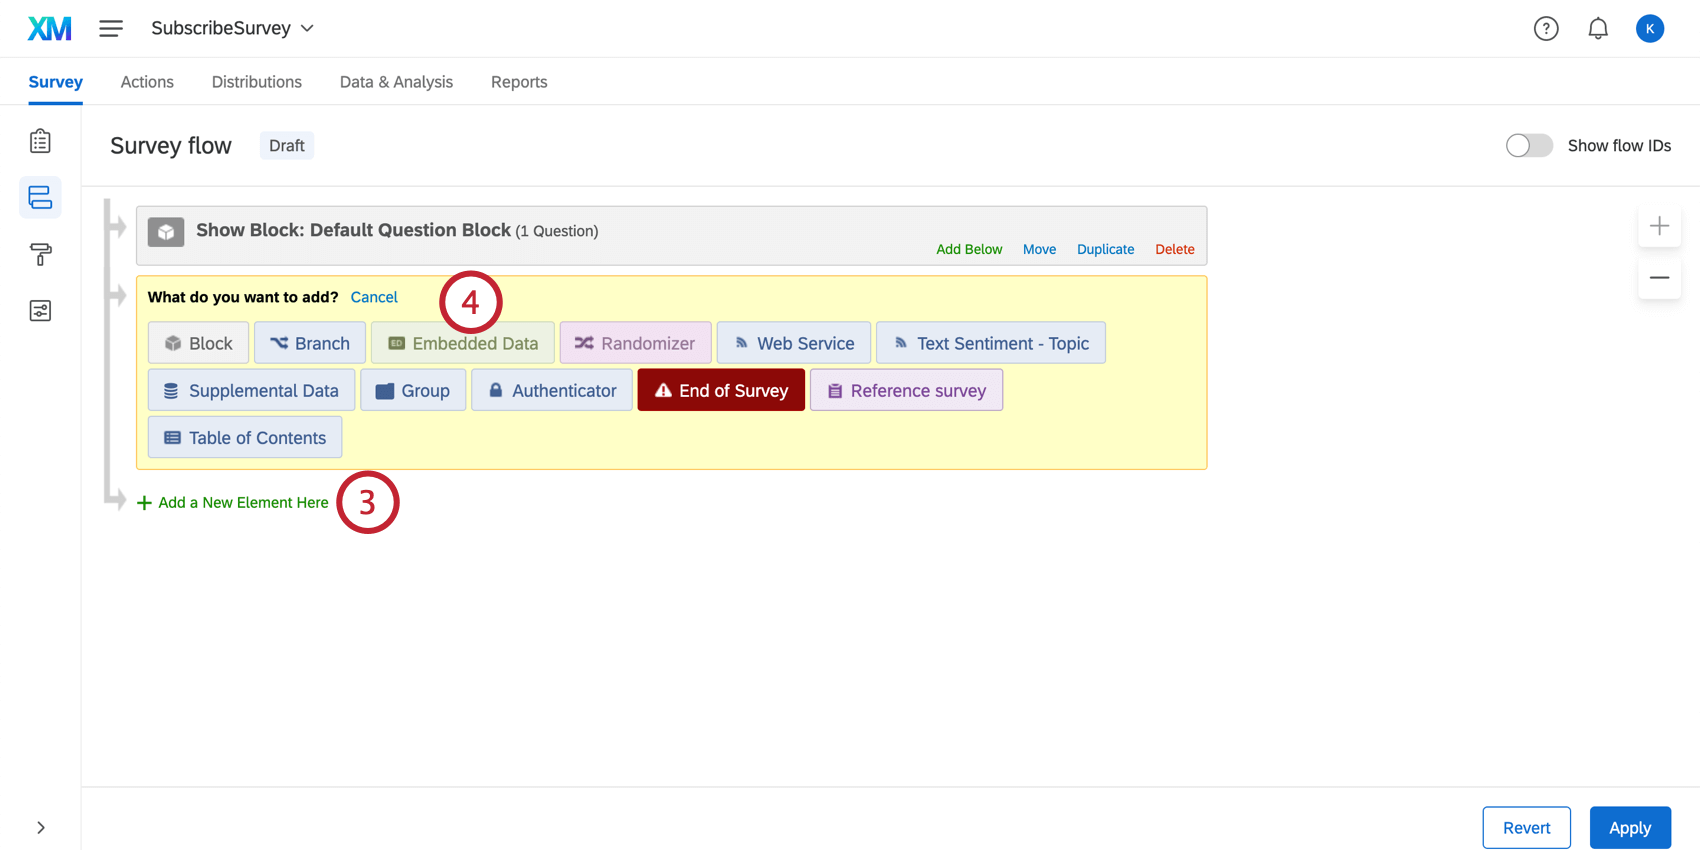
Using Separate Surveys for Each Milestone
Qtip: If you created and mapped a journey in a program, these steps will already be complete.
Each survey should only map to 1 milestone, and each milestone should only map to 1 survey. You may prefer this method if you want to be able to analyze data from each milestone separately before you combine all the milestones together.
Example: An airline has surveys for different milestones, such as:
- Check-In stage
- Boarding stage
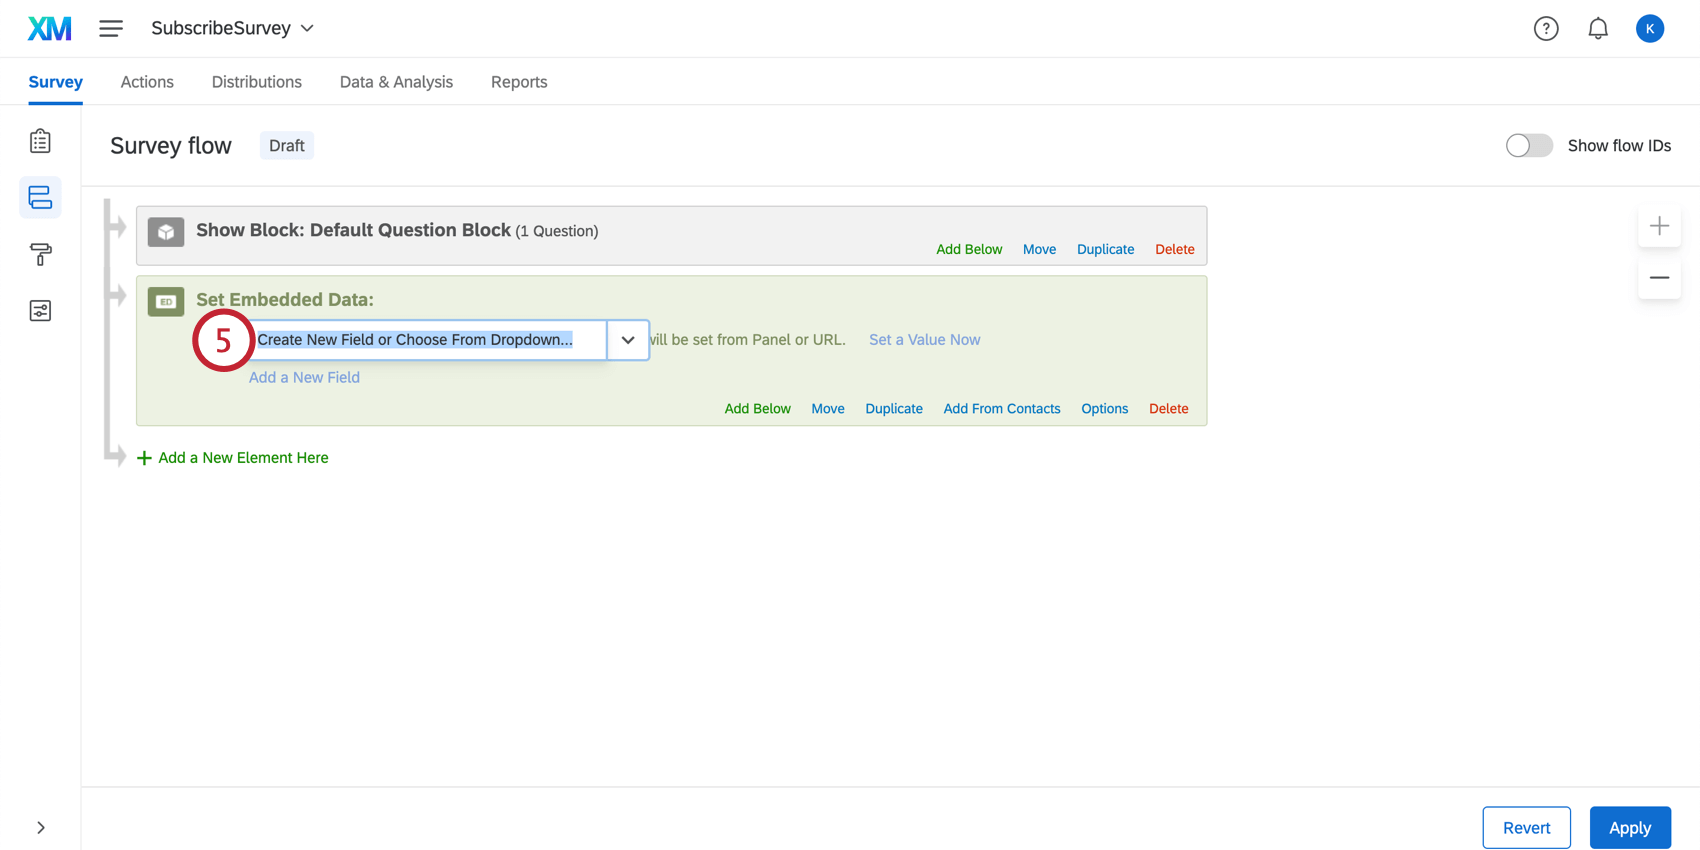
Qtip: This field does not explicitly have to be named “Stage” in order for journeys data to map correctly. However, we recommend that you choose a name that you will be able to easily remember and identify.
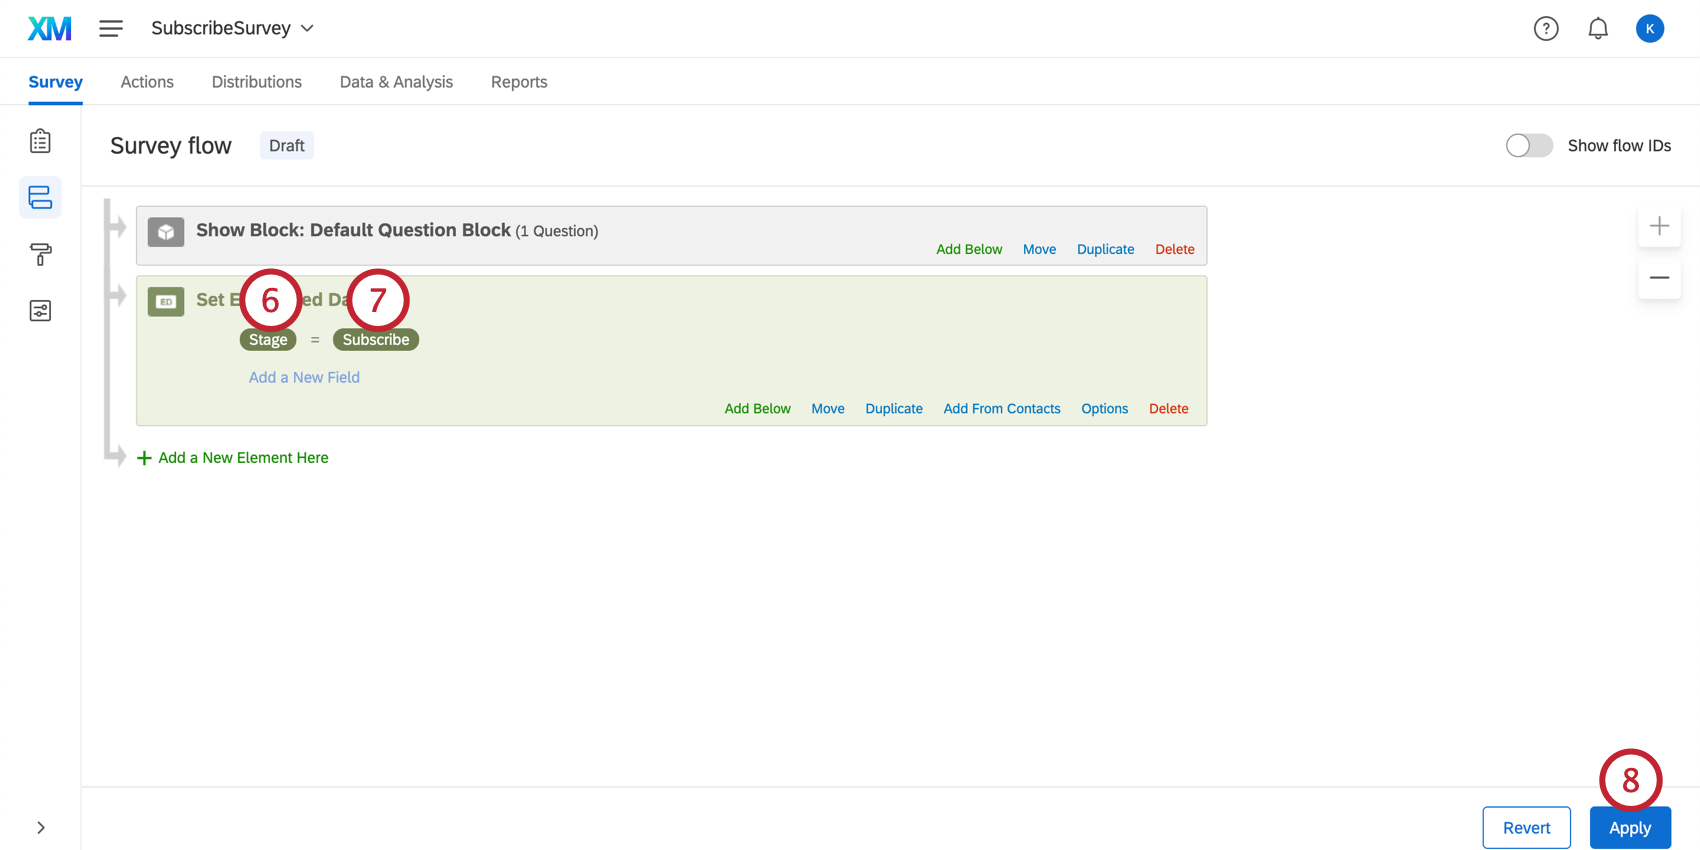
Attention: You must use the same milestone names you used when you created your journey.
Example: In this example, we’re mapping this survey to the subscription milestone of a journey. Therefore in this survey, the Stage embedded data is set to Subscribe.
You can now map your journey to a dashboard.
Using One Survey to Support All Milestones
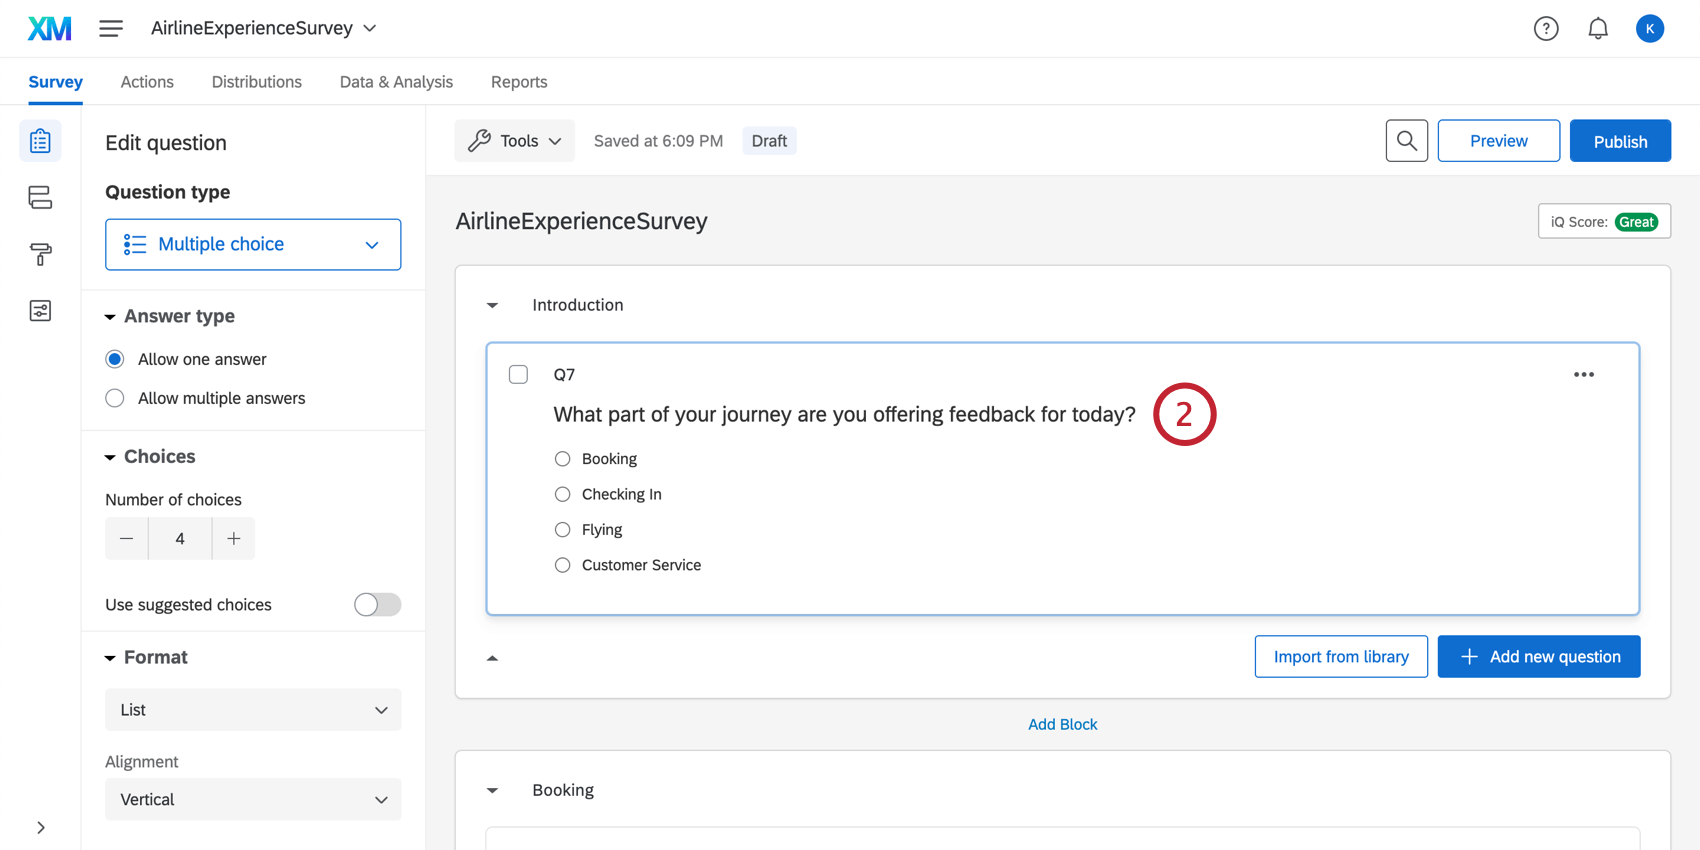
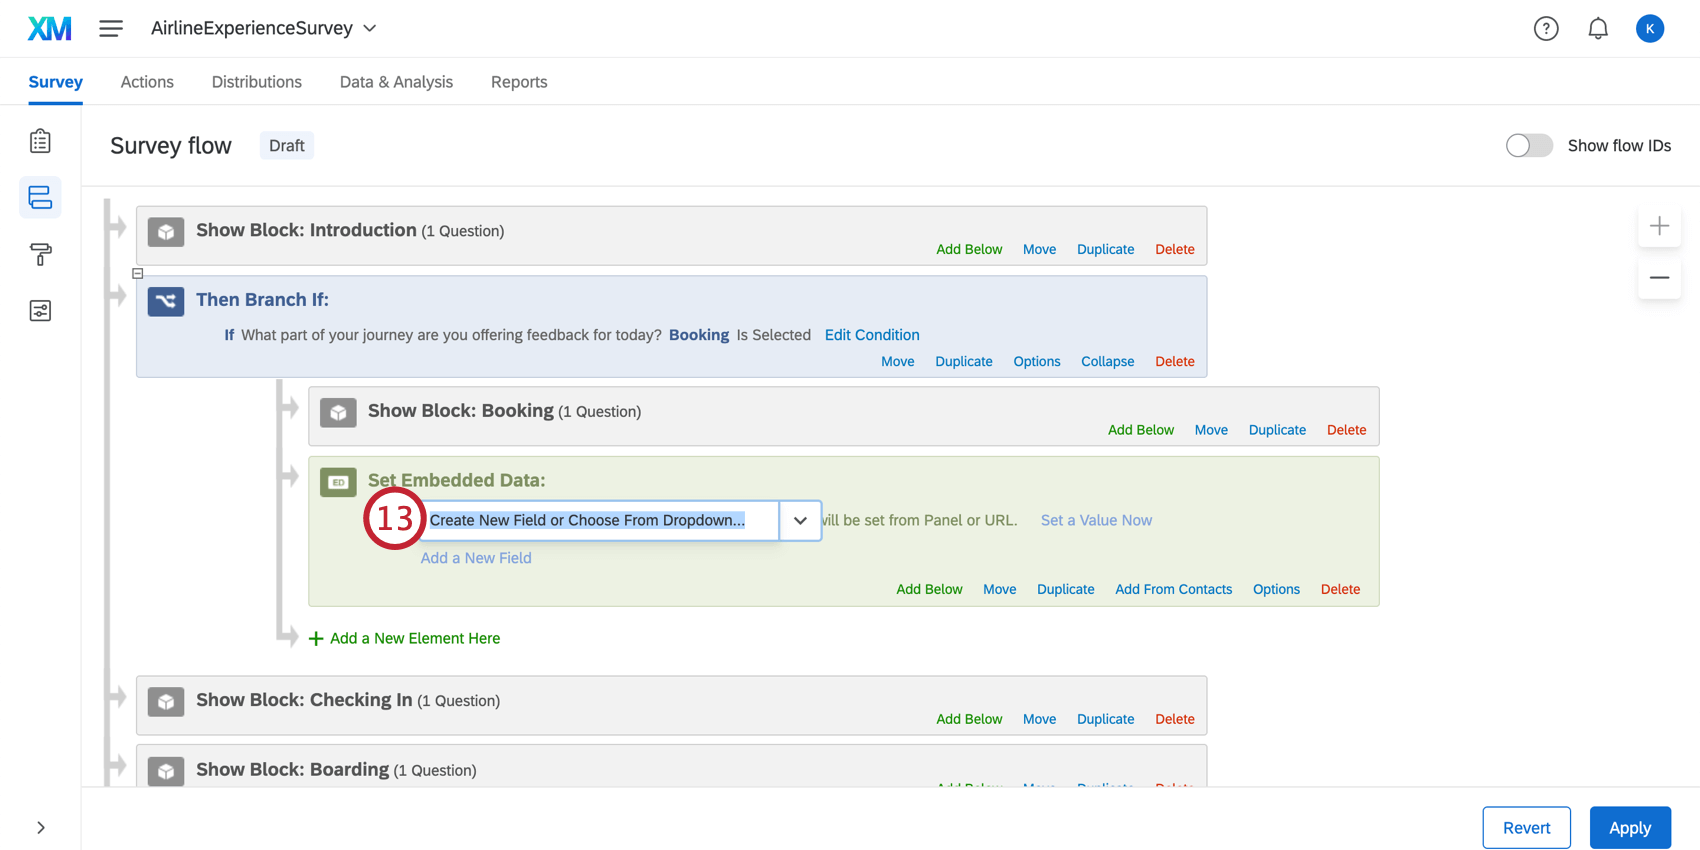
You can also define all of your milestones using just 1 survey. You’ll create different paths in your survey using the survey flow, so that each respondent will be assigned to the correct milestone. Creating different blocks, branch logic, and embedded data for each milestone will help you visualize journey data.
Qtip: It’s important to follow the steps below to map these different questions to 1 Stage embedded data field. The journey chart widget is not compatible with multiple questions and needs 1 field it can refer back to.
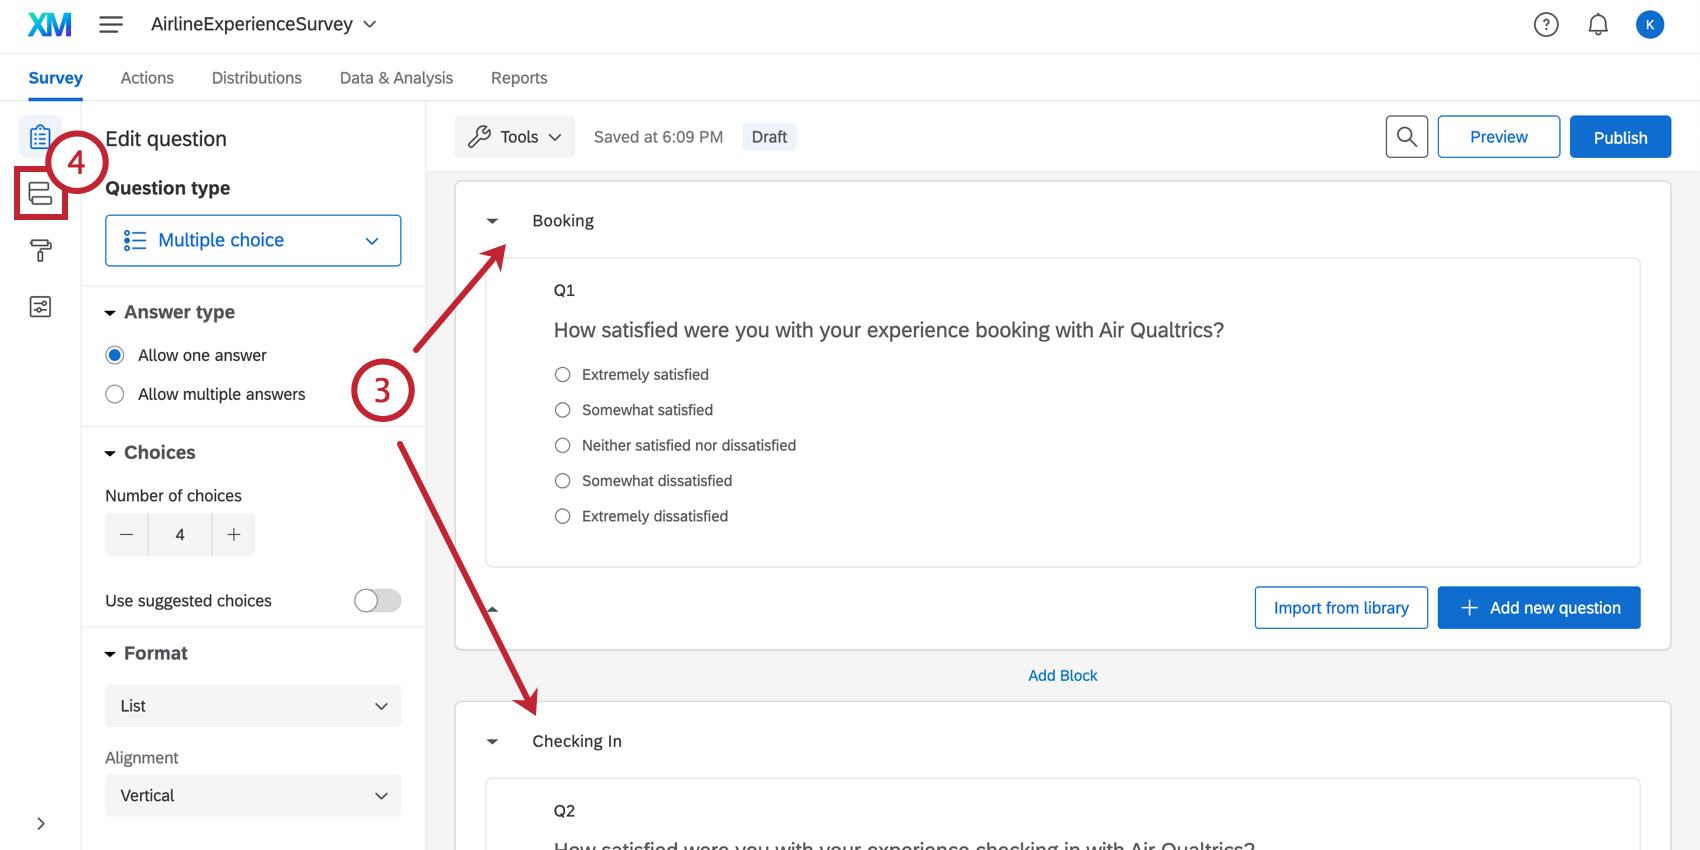
Qtip: You can rename your blocks so that they are easily recognizable, for organizational purposes.
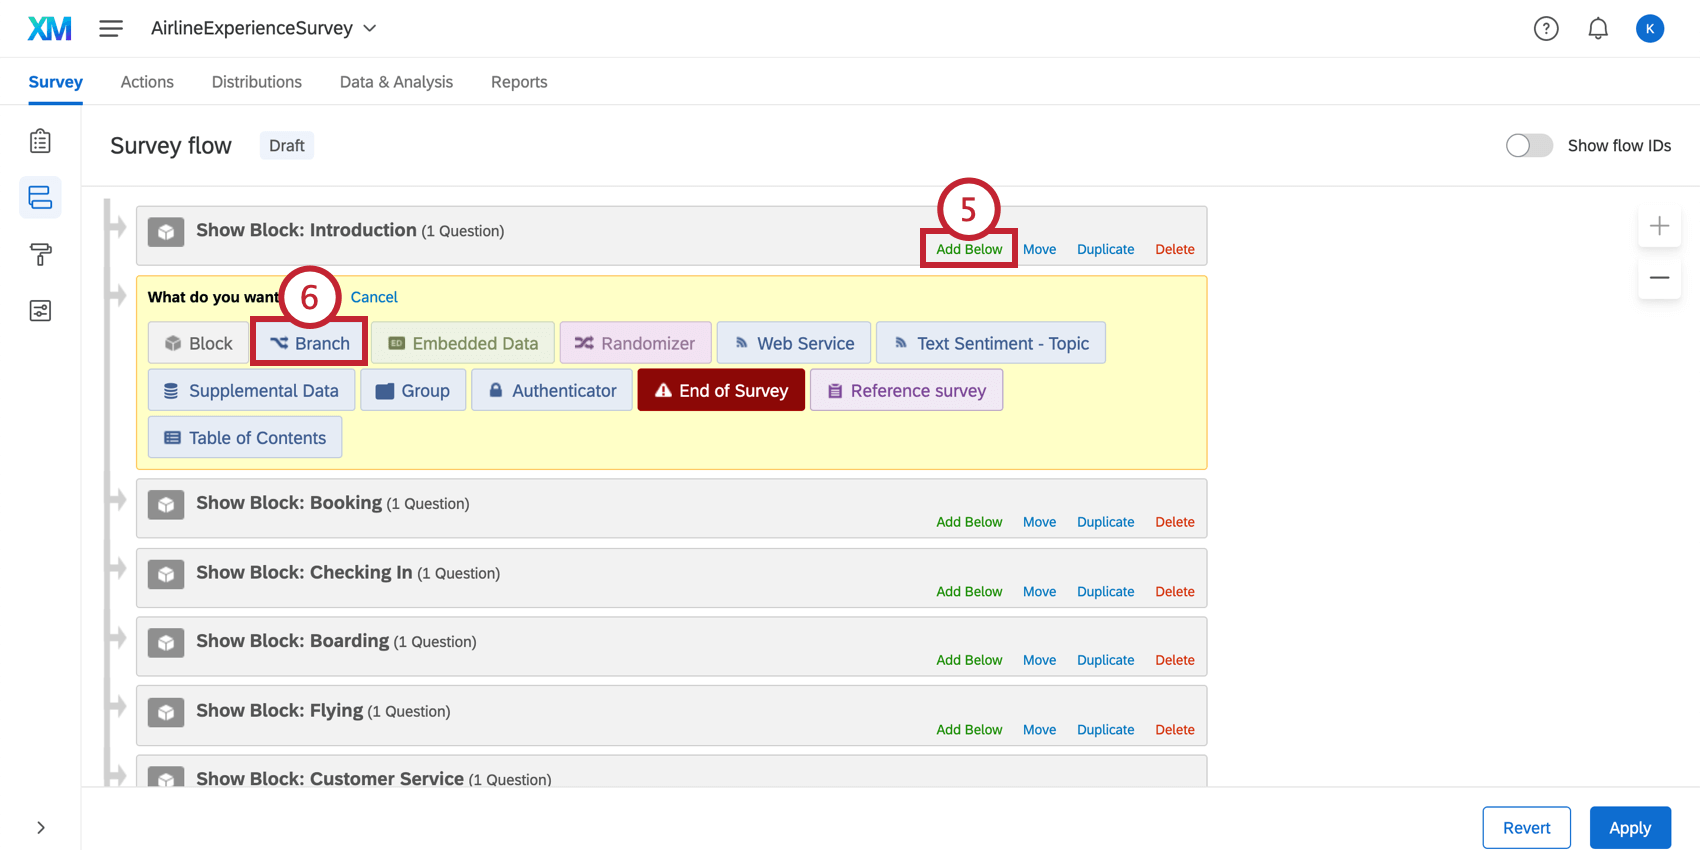
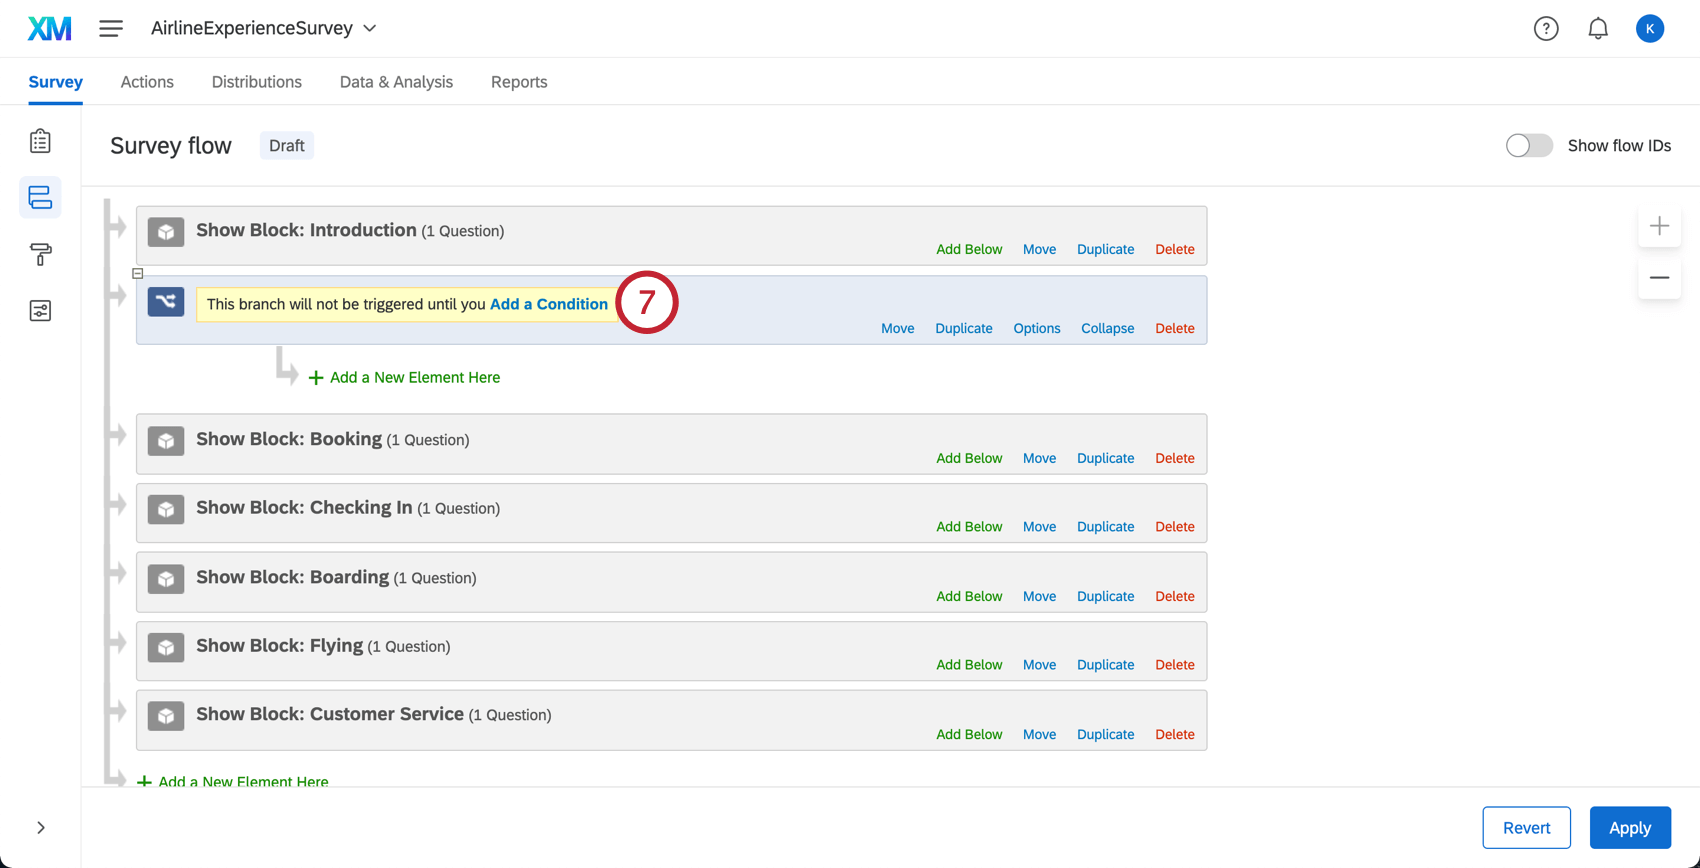
Qtip: For more information on setting logic conditions, see Using Logic.
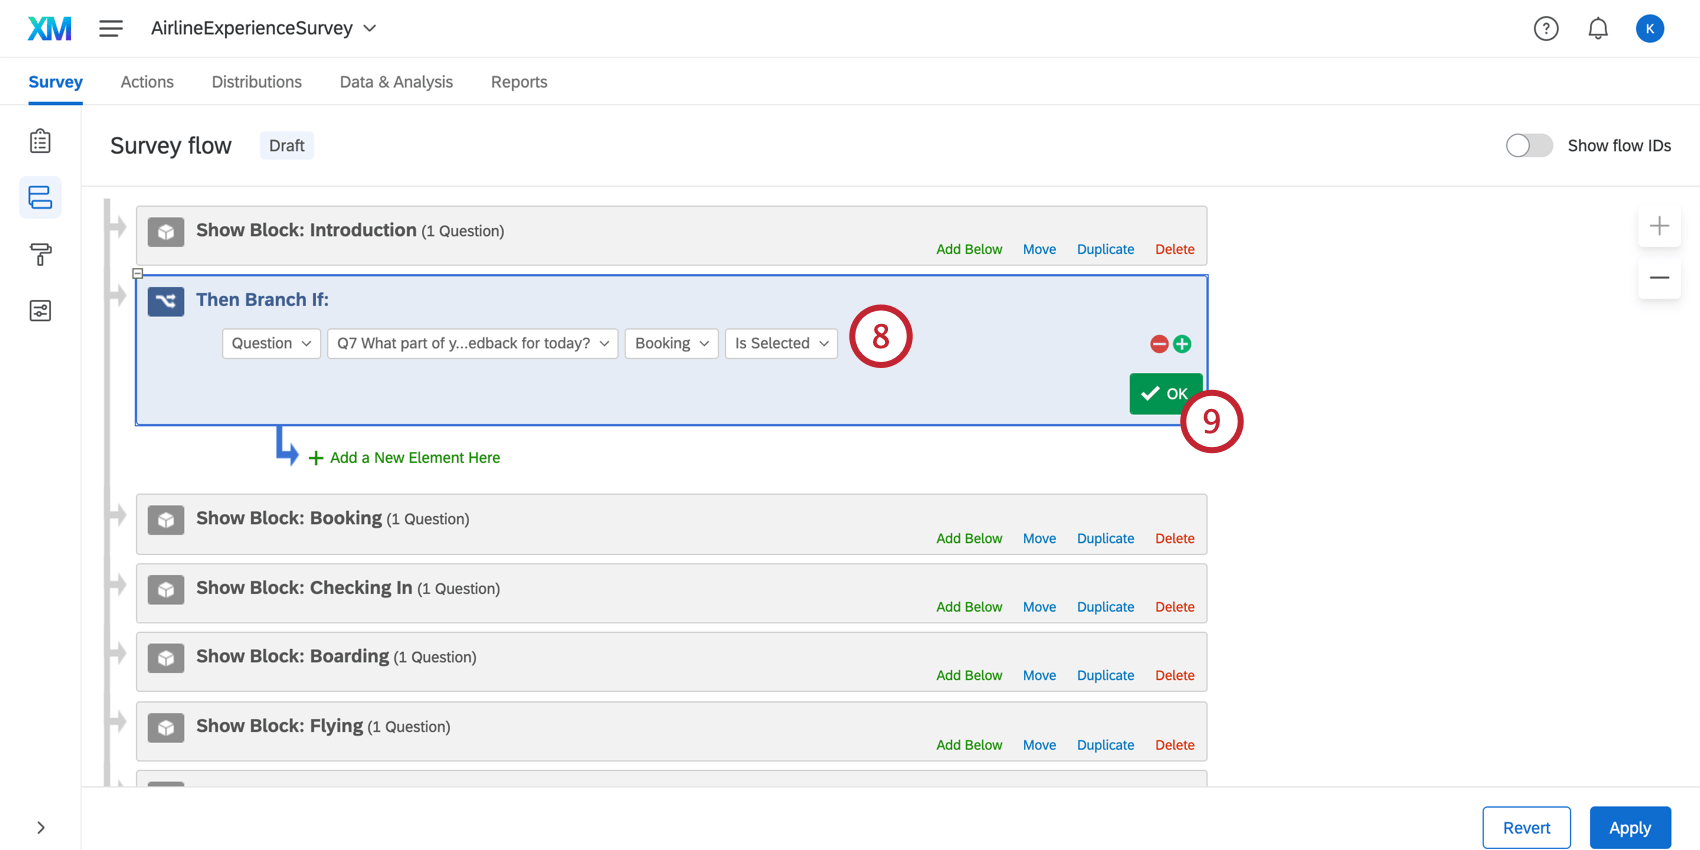
Example: In the example below, we chose to create the condition based on whether the respondent selected “Just Browsing” in the question, “What part of the process were you a part of today?”


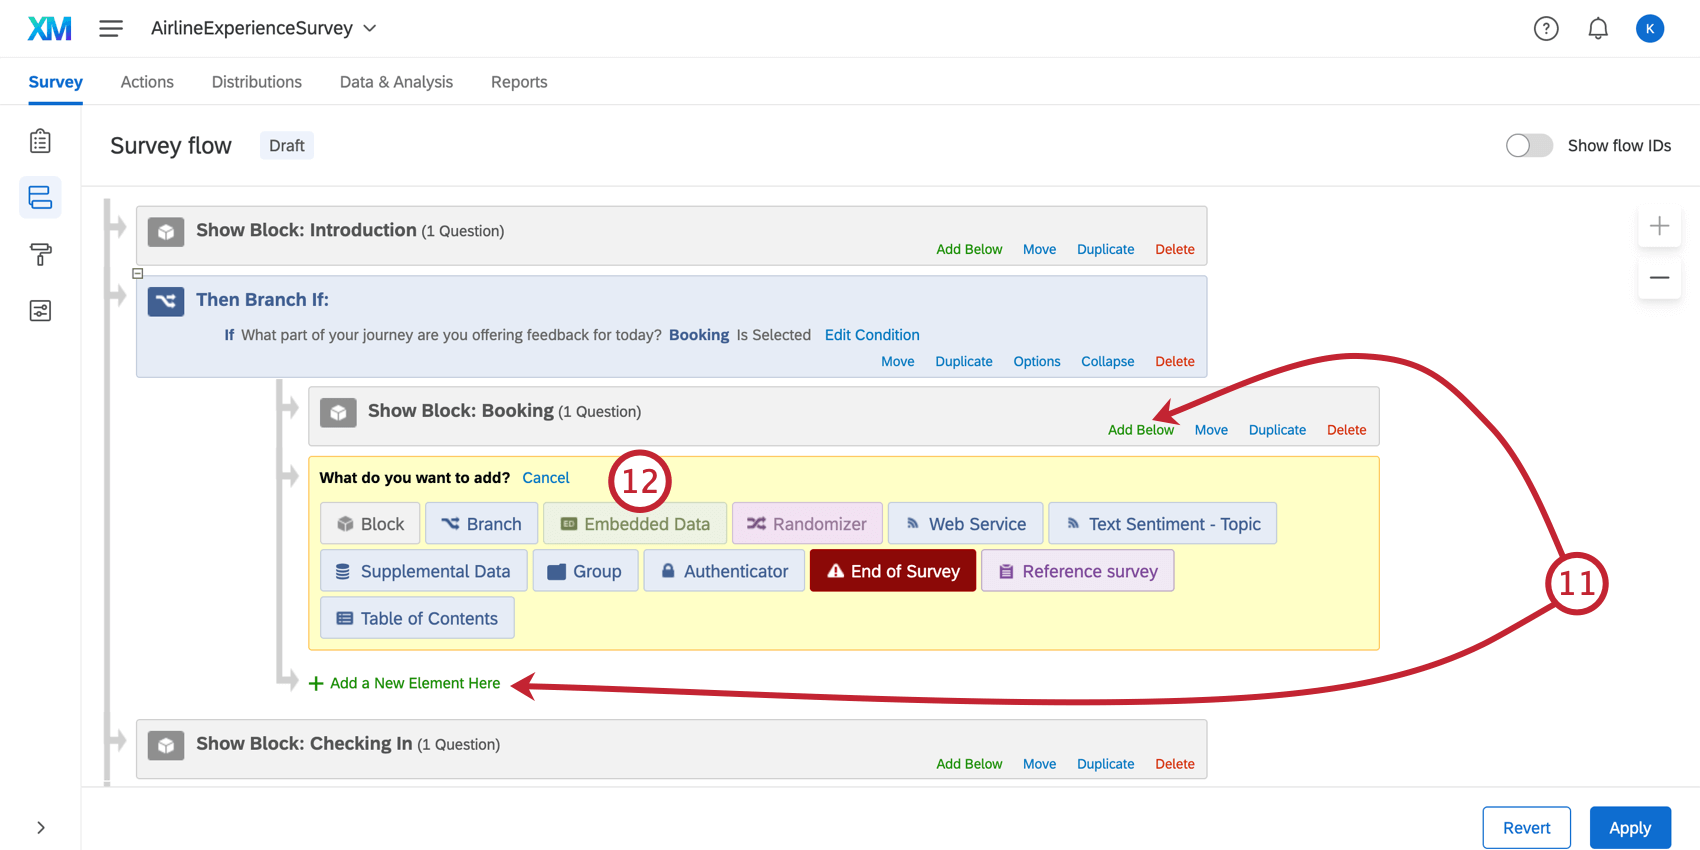
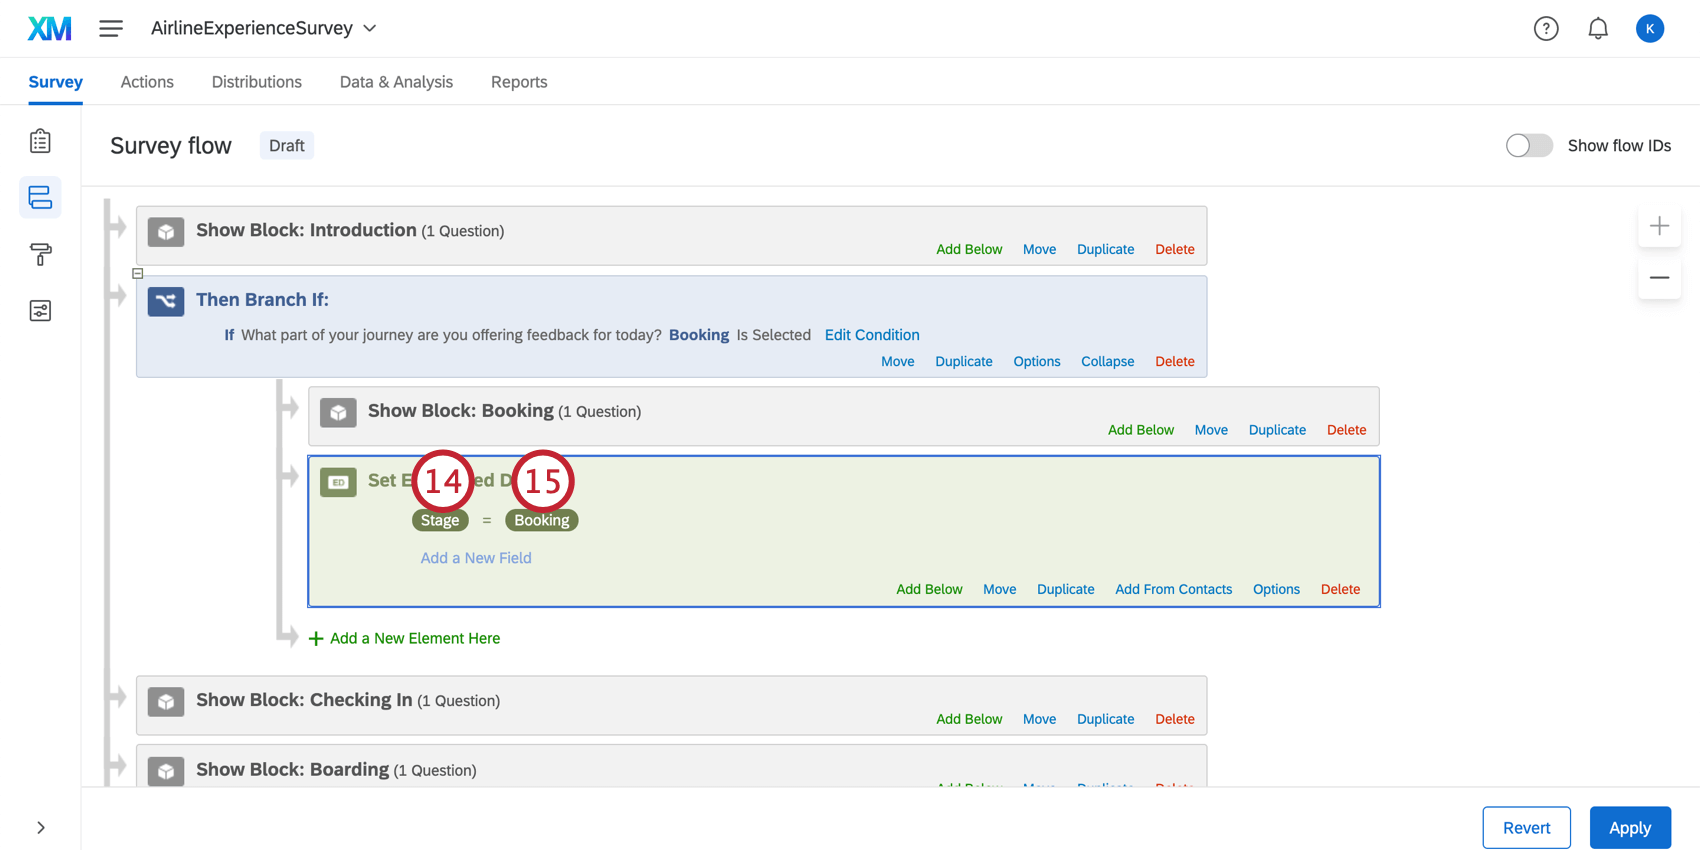
Qtip: This field does not explicitly have to be named “Stage” in order for journeys data to map correctly. However, we recommend that you choose a name that you will be able to easily remember and identify.
Attention: You need to use the same names you gave your milestones when you first created the journey. If the value of the embedded data field does not match the corresponding milestone exactly, then it will not pull into the Journey Chart widget when you map the embedded data.
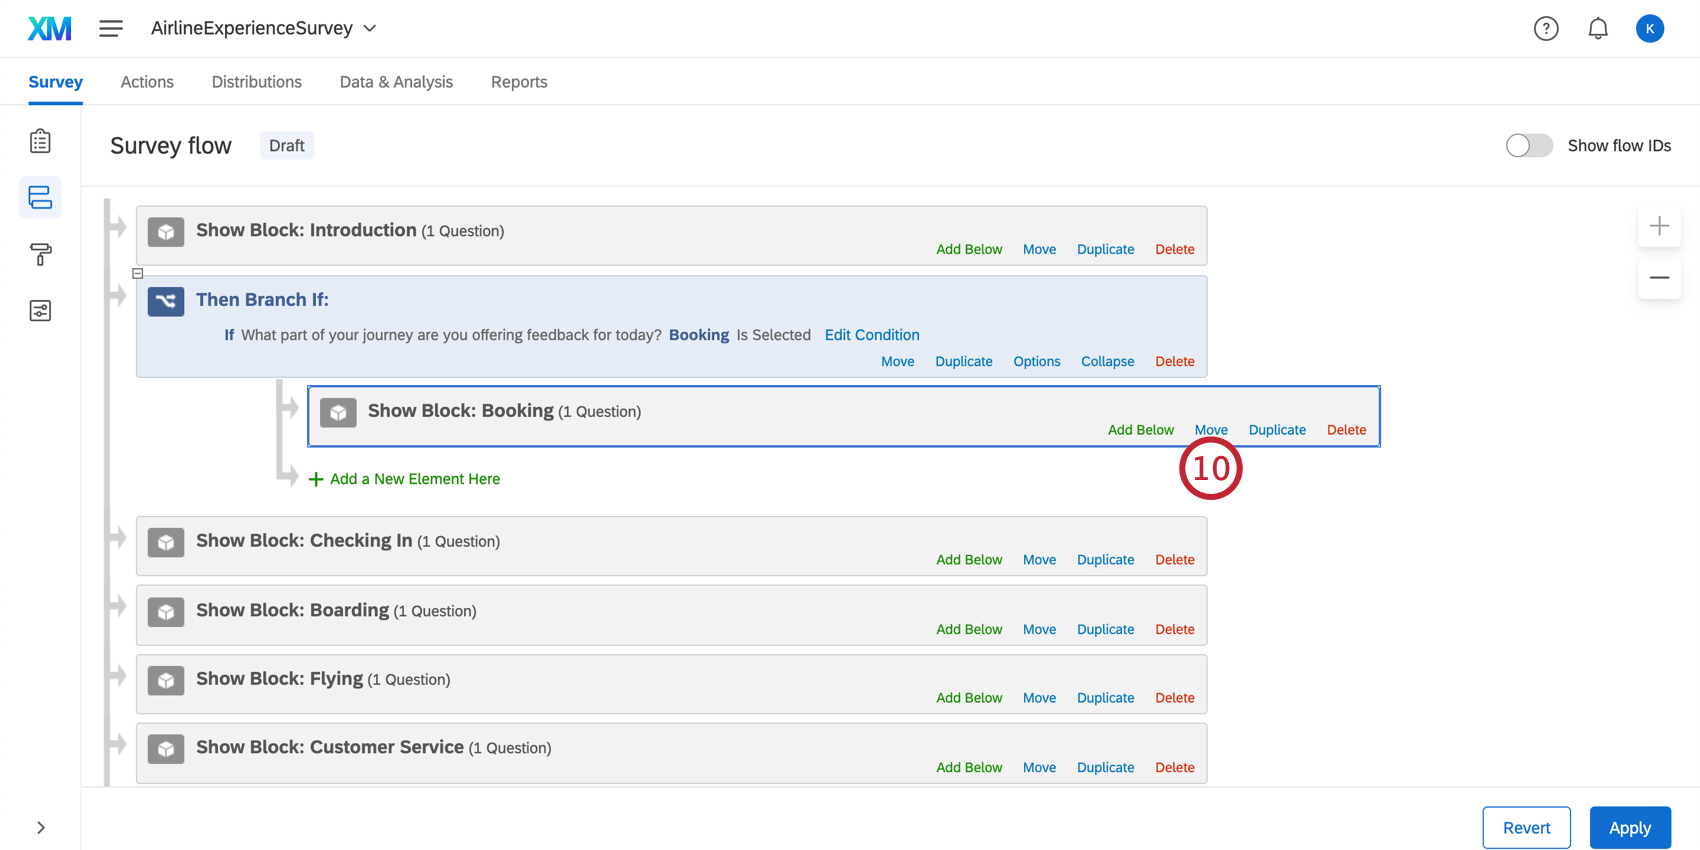
Example: In this example, we set the Stage to Booking. You’ll notice the branch logic and block of questions are tailored to the booking stage.
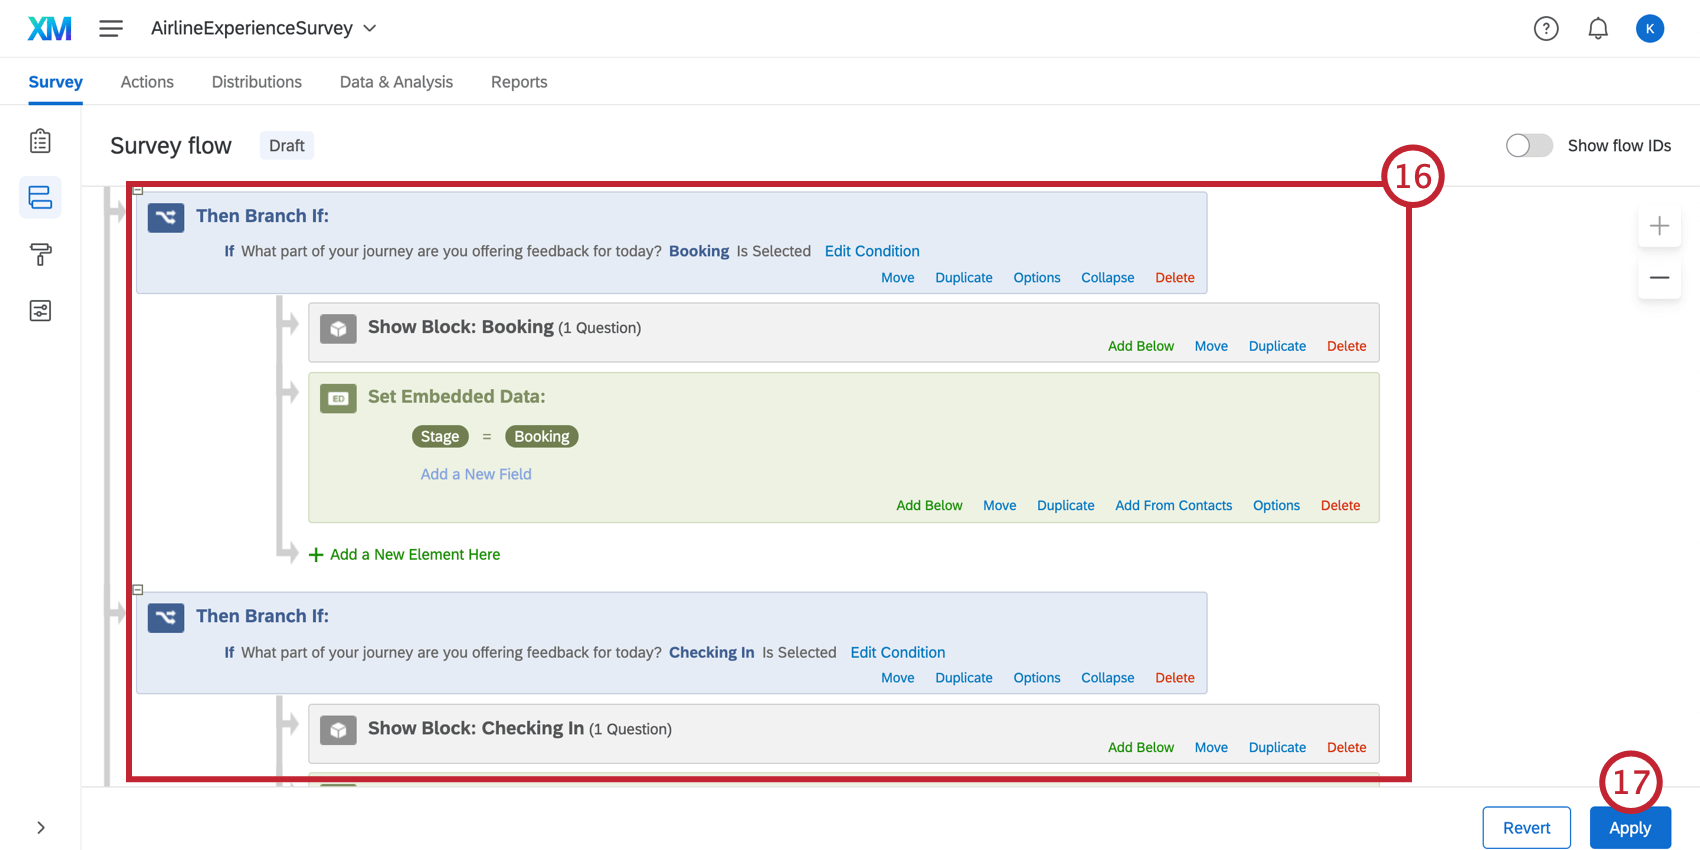
You can now map your journey to a dashboard.
Using Imported Data Projects for Milestones
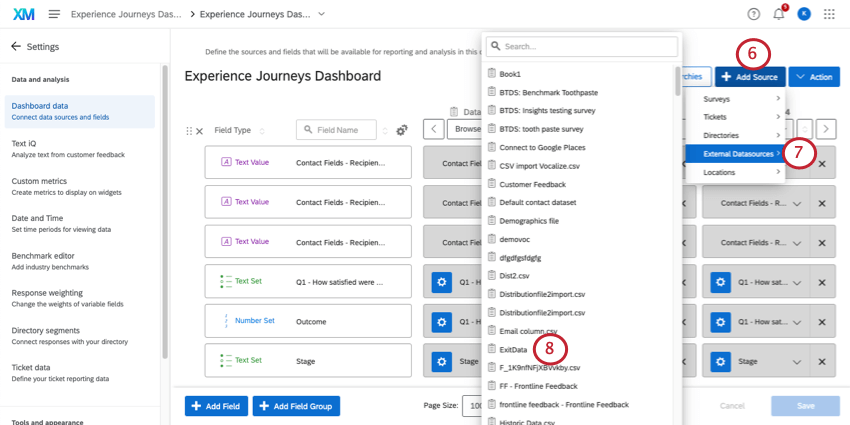
You can use imported data projects as milestones. Because the data is already collected and uploaded to Qualtrics, this solution works a lot like mapping historical survey data to journeys.
Qtip: Each imported data project can only represent 1 milestone.
These steps show you how to map imported data so you can then use it in a dashboard with the rest of the milestones and journey widgets.
Qtip: These steps assume you have already created your imported data project.
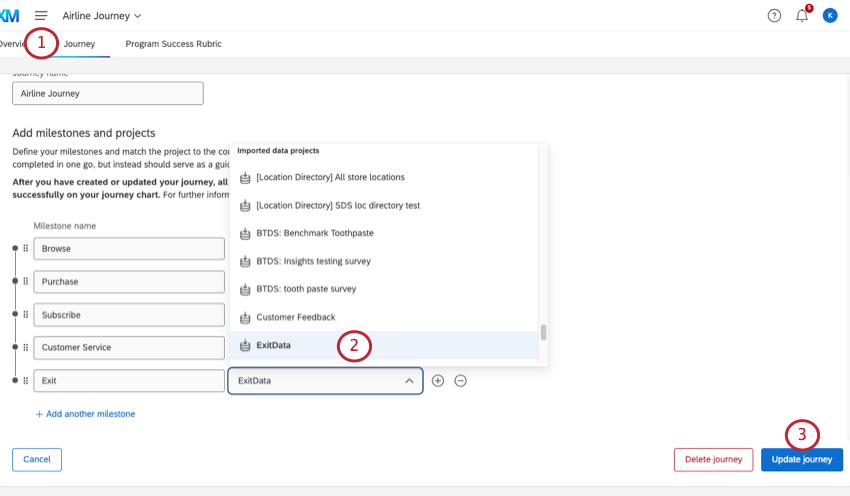
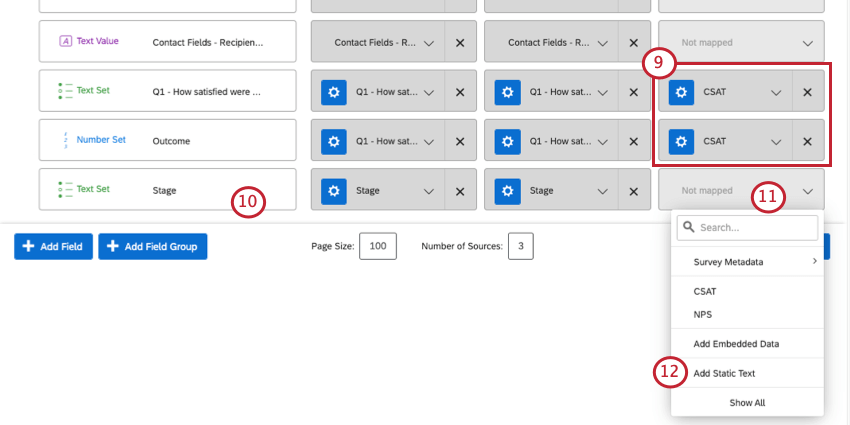
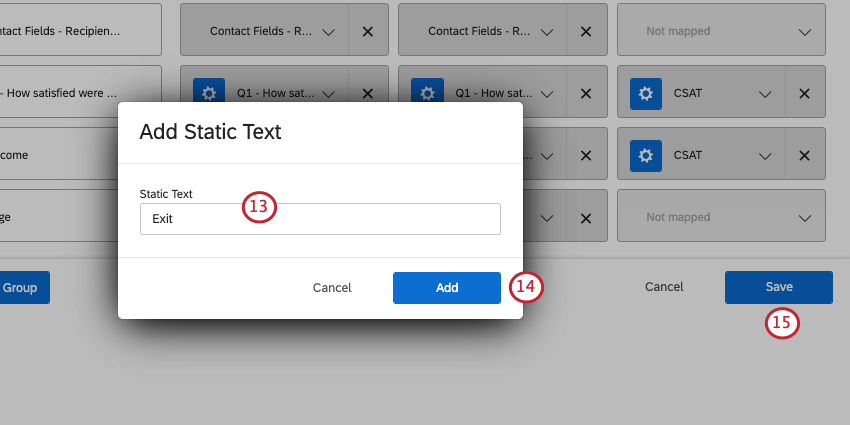
Example: Our imported data project represents the Exit stage. We capitalize it the same way we did when we created our journey.
That's great! Thank you for your feedback!
Thank you for your feedback!