
Using Digital Program Health Data as a CX Dashboard Source
What's on this page
About Using Digital Program Health Data as a CX Dashboard Source
Sometimes, you may want to create dashboards to get insights on your website visitors and the data gathered from your digital programs. CX Dashboards lets you use this data as a datasource, allowing you to visualize up-to-date data from your website visitors to understand them in real time. Once mapped, this data acts just like regular survey data sources.
The digital statistics that can be visualized in your dashboards are page views, impressions, and clicks. See Statistics in Website / App Insights Projects for more information on these statistics.
You can use digital program data in a dashboard if you created or are the owner of the Website / App Insights project that contains that data, or if you are added as a user that can manage the project.
Qtip: Only Website / App Insights projects that have collected either page views, impressions, or clicks will be available to use in dashboards. Projects with no statistics will not be available.
Requirements
To use digital program data in a dashboard, you will need the following:
Attention: You must be the owner of the project or a user that can manage the project.
Qtip: This can be confirmed by going to the Statistics tab within your Website / App Insights project.
Qtip: If you haven’t created a dashboard project or want to use a new one, see Creating Your Project & Adding a Dashboard (CX)
Adding Digital Program Data as a Dashboard Data Source
Once you have a Website / App Insights project with data, as well as a CX dashboard project, you can add your dataset as an external source within the dashboard. See Mapping Data Sources for instructions. When the dataset is added to a dashboard you will be able to build widgets using your digital data.
Mapping Data in the Dashboard
After adding your data as a dashboard source, your data needs to be mapped to specific dashboard fields. There are 9 fields associated with Website / App Insights data that can be used in your dashboard. See Available Dashboard Fields for more information on these fields.
If you are using an existing dashboard that already contains mapped fields, the dashboard mapper will not automatically create Website / App Insights fields in your dashboard mapping. You will need to create and map the fields manually.
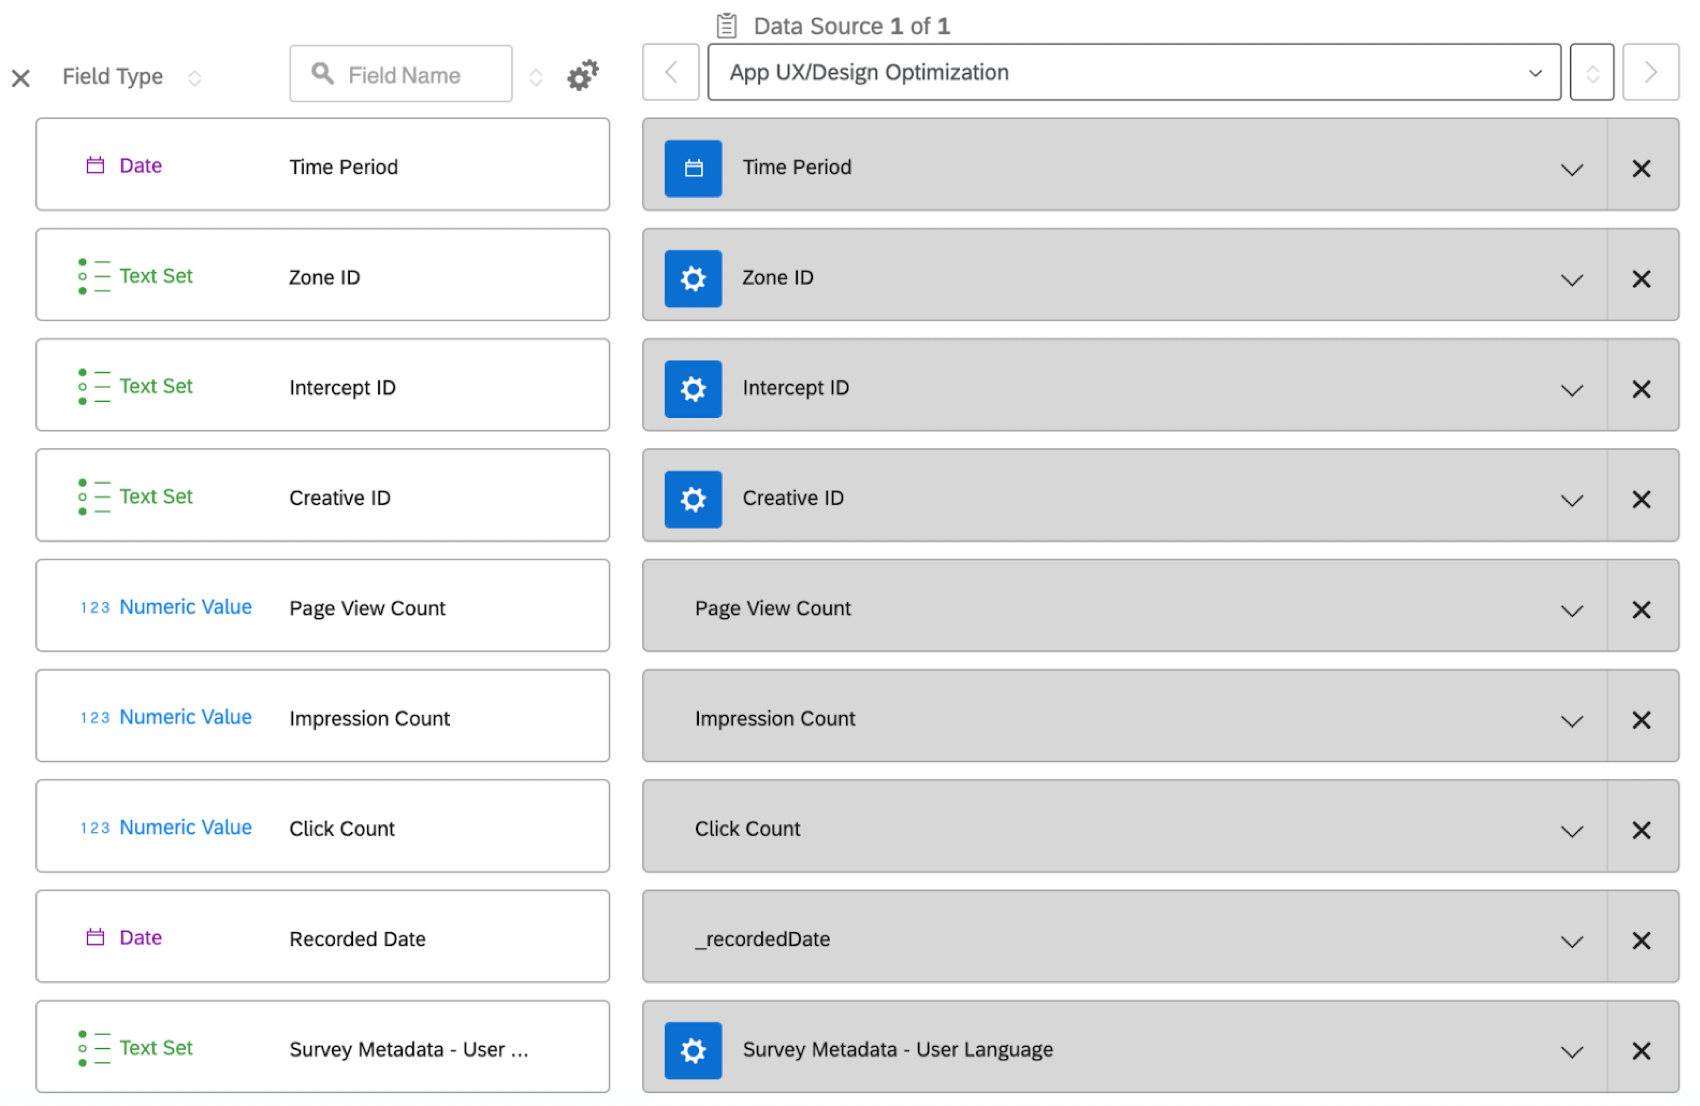
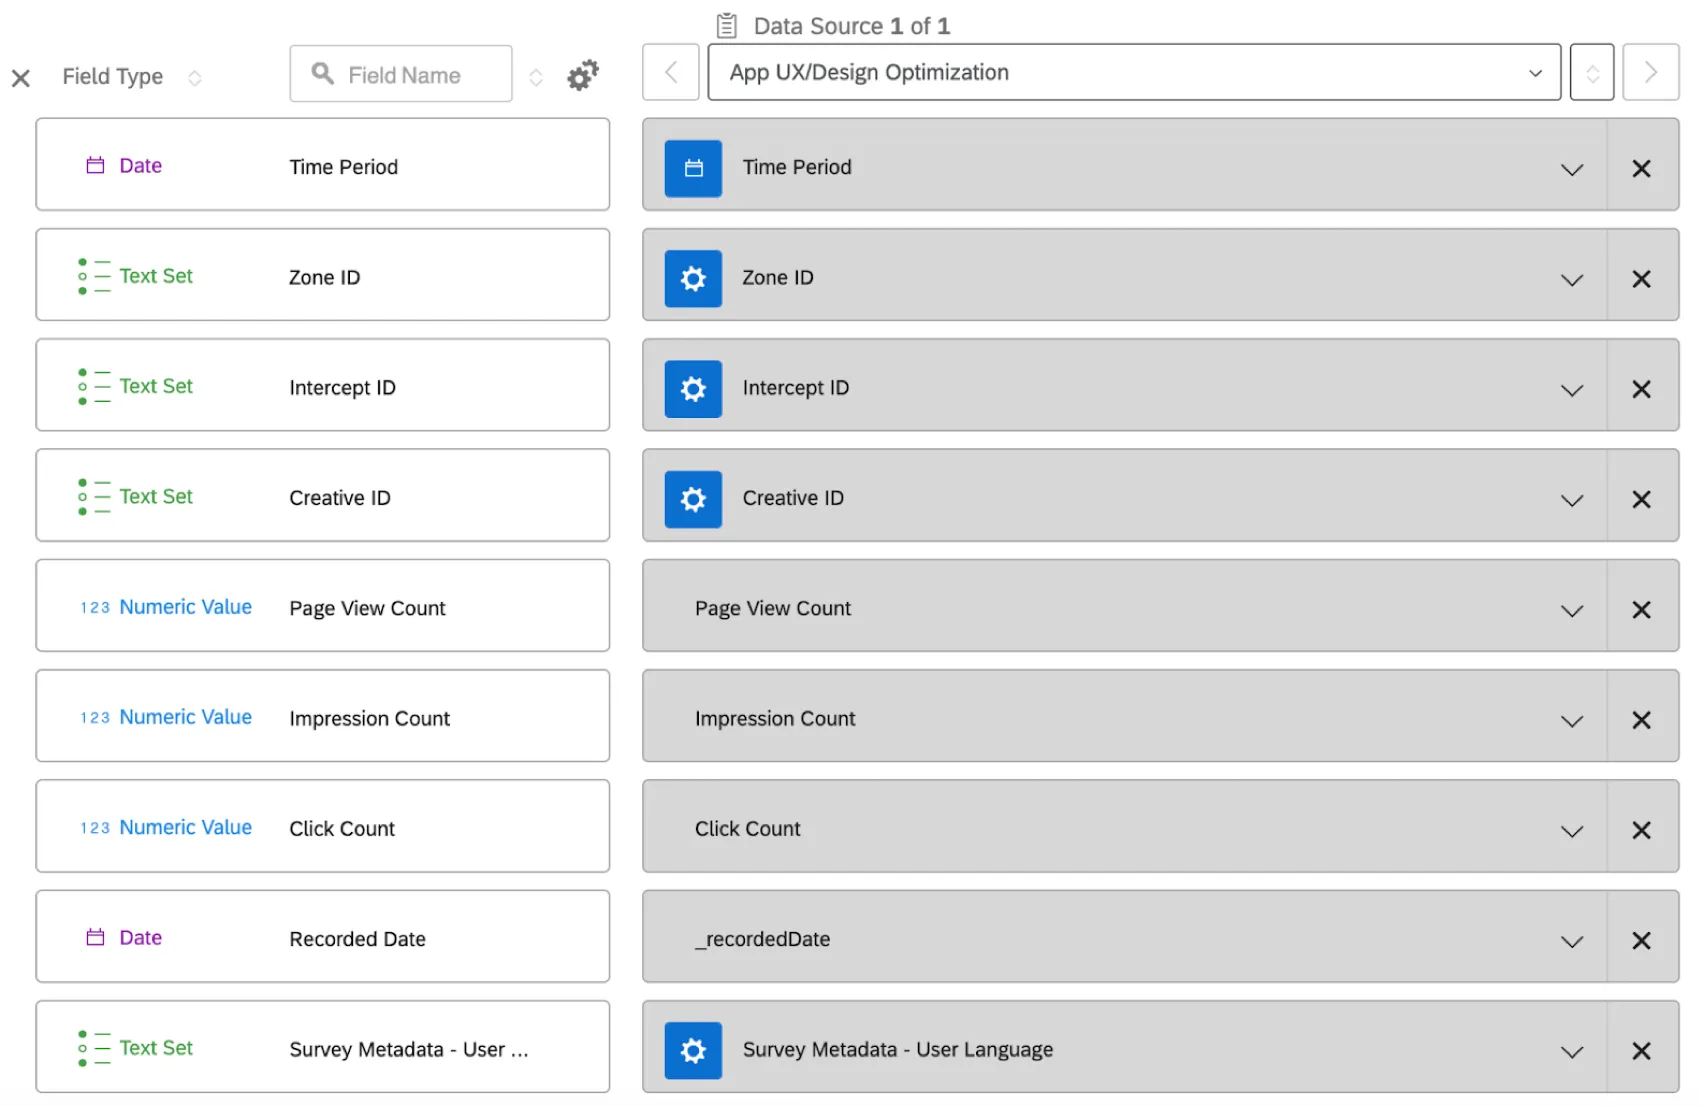
After adding your Website / App Insights project as a dashboard source, select Add to automatically add the digital program fields, and click Save.
Qtip: You can connect multiple Website App Insight projects as additional data sources in your dashboard. This allows you to build widgets for comparing digital datasets.
Available Dashboard Fields
The following fields are included automatically when you map your digital program data to a new dashboard. If you map your data to an existing dashboard, you can add these fields manually using the data mapper. See Adding New Fields for instructions.
- Time Period: The date the statistic occurred. These dates and times are in a GMT -7 time zone.
- ZoneID: The Zone ID of your Website / App Insights project.
- InterceptID: The Intercept ID of your Website / App Insights project.
- CreativeID: The Creative ID of your Website / App Insights project.
- Page View Count: Number of page views within the project.
- Impression Count: Number of impressions within the project.
- Click Count: Number of clicks within the project.
- Recorded Date: The date the statistic was recorded.
- Metadata User Language: The language of a user.
Qtip: The time period field is the date the statistic actually happened, while the recorded date field is the date the statistic was added to Qualtrics. These dates may be different, especially for historical data that is added to Qualtrics.
Custom Metrics
To see metrics such as impression rate, click rate, or completion rate, you can create custom metrics within your dashboard. Use the following formulas to create these metrics:
- Impression Rate: # impressions (Sum) / # of page views (Sum)
- Click Rate: # clicks (Sum) / # of impressions (Sum)
- Completion rate: # (Count) of survey responses / # of clicks/impressions/page views (Sum) Qtip: This calculation requires you to have at least 2 data sources: the survey collecting data and the Digital metrics. This will be an approximate measure based on whether you want to see number of responses over clicks, impressions, or page views.

Building Widgets
Once you’ve mapped your data to your dashboard, you can then build your widgets. See Building Widgets (CX) for a general overview of how to build dashboard widgets. This section has guidance specific for displaying digital program health data.
Warning: When displaying “Page View,” “Impression,” or “Click” statistics, make sure to use a Sum metric. If you use the “Count” metric, then you will see a large discrepancy between your dashboard and the Statistics tab in your Website App Insights project.
Qtip: For the most accurate view, use Time Period to aggregate statistics since that represents when the statistic was actually triggered. “Recorded Date” may be different for older stats because that represents when the data was saved to the dataset.
Line Charts
To set up a line chart widget, use the following settings:
- Metrics: Add 3 Sum metrics, one for each statistic:
- Page Views
- Impressions
- Clicks Qtip: You could also create 3 separate line chart widgets and add only 1 metric to each.
- X-Axis: Time Period
Below is an example of what this would look like:
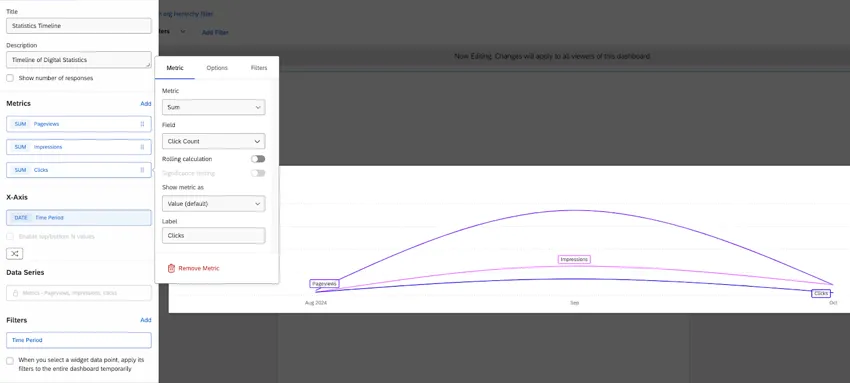
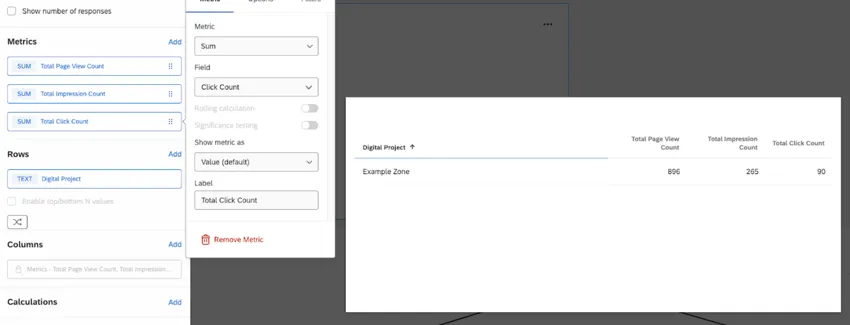
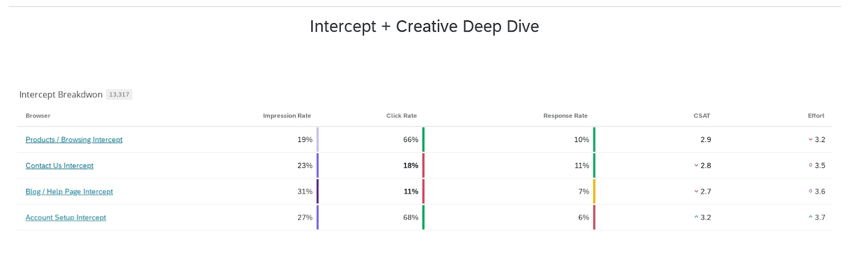
Table Widgets
For the table widget metrics, choose the Sum for the following statistics:
- Page Views
- Impressions
- Clicks
For the rows, choose the digital project name.
Below is an example of what this would look like:
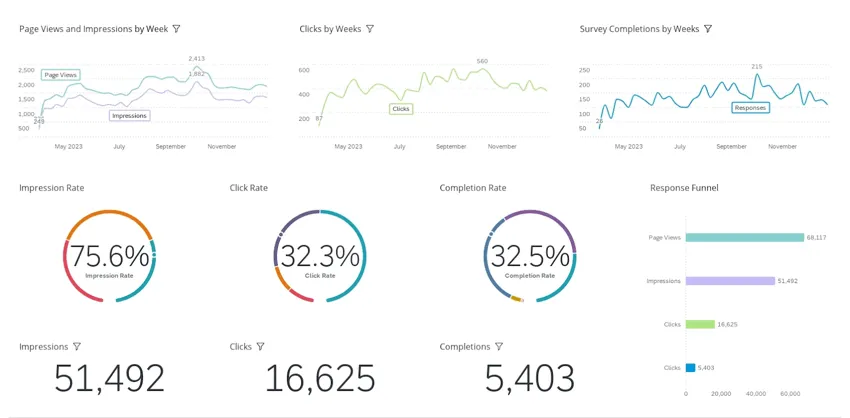
Example Dashboard
Below is an example digital program health dashboard.
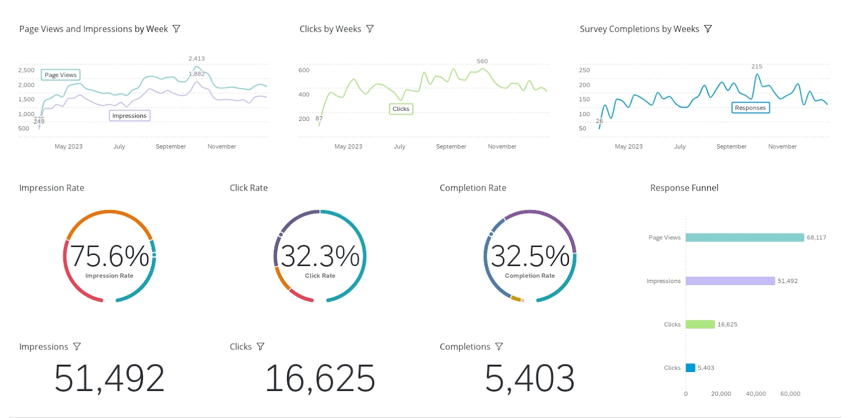
FAQs
Why can’t I filter or break out my widgets by intercept page views?
Why can’t I filter or break out my widgets by intercept page views?
That's great! Thank you for your feedback!
Thank you for your feedback!