
Creating & Viewing Ad Hoc Reports (Designer)
What's on this page
About Creating and Viewing Reports
Ad Hoc reports can be created and viewed within the Report tab. You can create new reports, view report outputs, preview the verbatims behind each response included in a report, export, and save reports.
Creating a Report
When you run Ad Hoc reports, you can select the report and visualization type, as well as additional customization options.
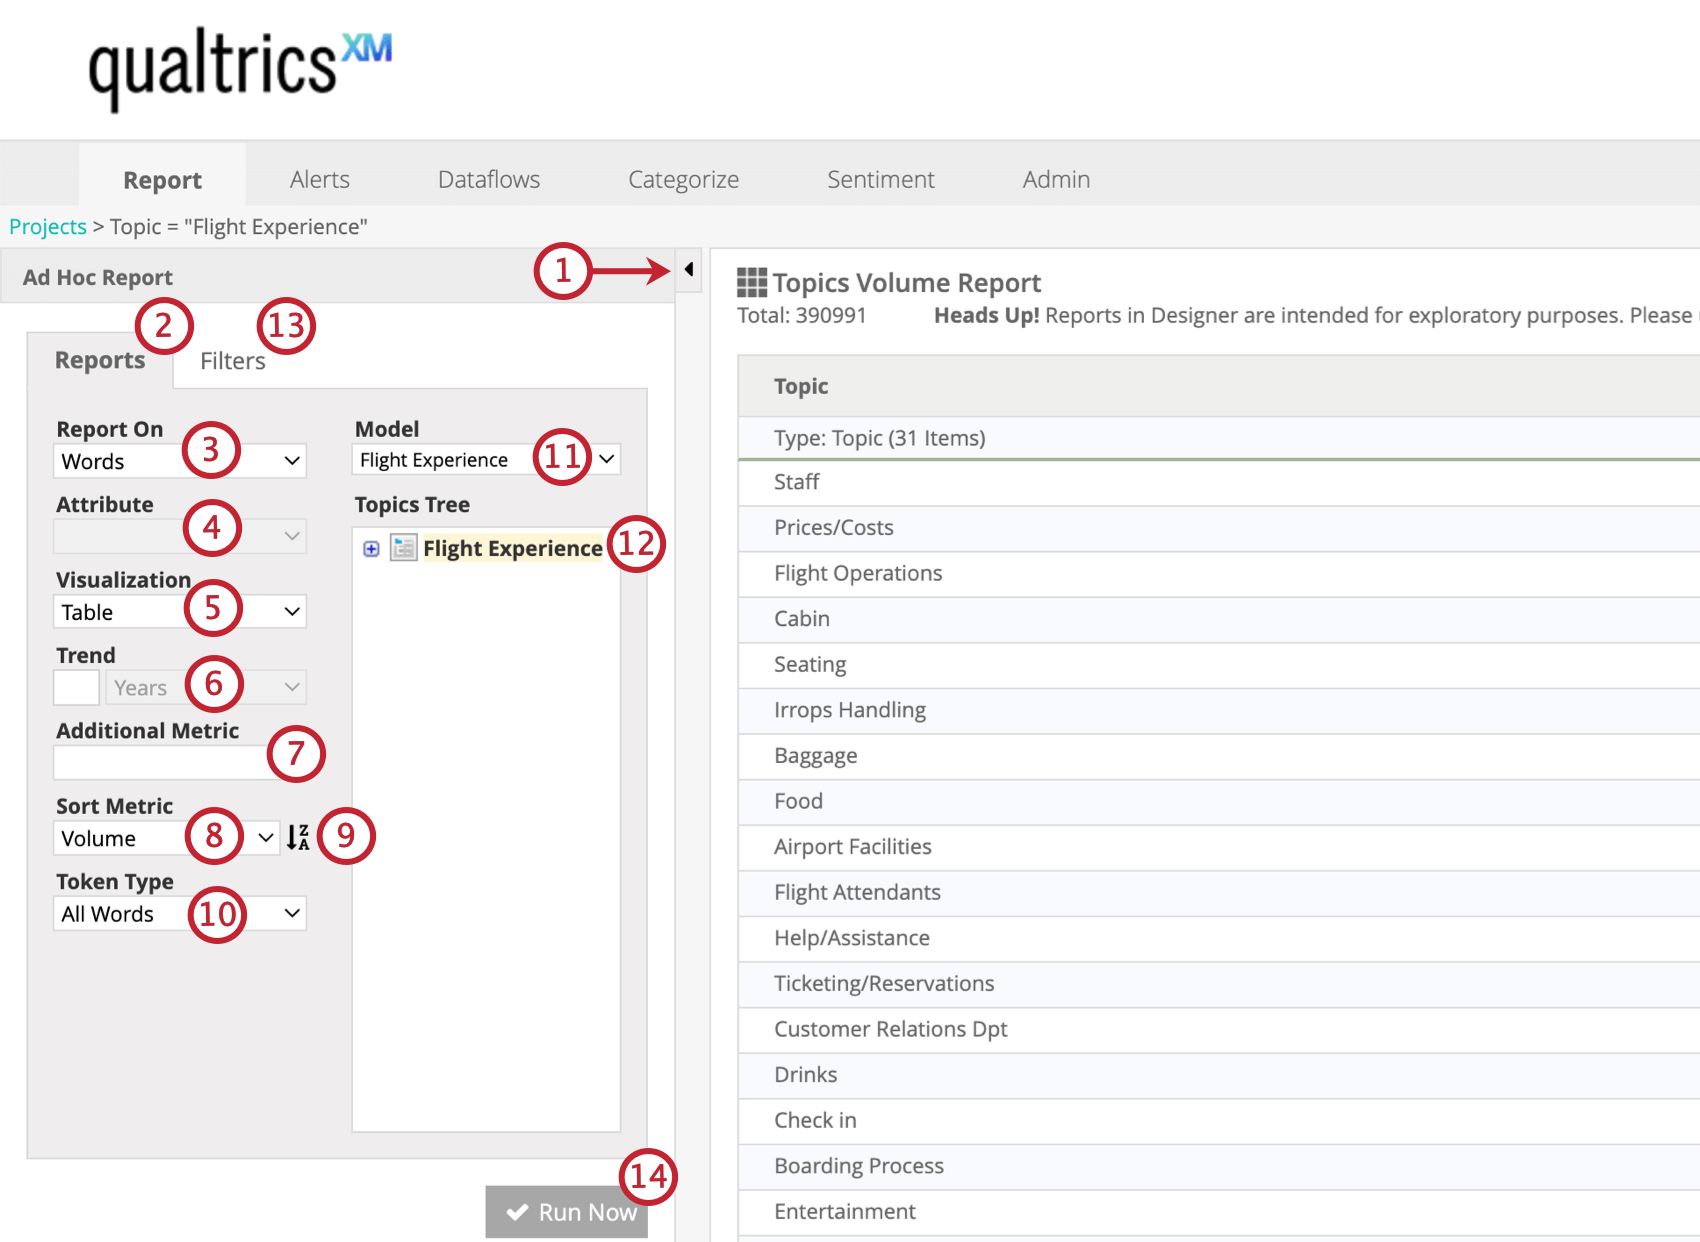
Qtip: To report on effort, add the CB Effort attribute as an additional metric. Note that there is no color formatting available for effort, since effort scores are calculated differently than sentiment scores.
- All words: Run a regular Words report.
- Hashtag: Show only words or unspaced phrases prefixed with a hash symbol (#) usually used as metadata tags inside a verbatim.
Viewing a Report
Once a report has been run, you can view the results in the center panel. You can also view sub-reports or preview sentences from customer verbatims.
Sub-reports
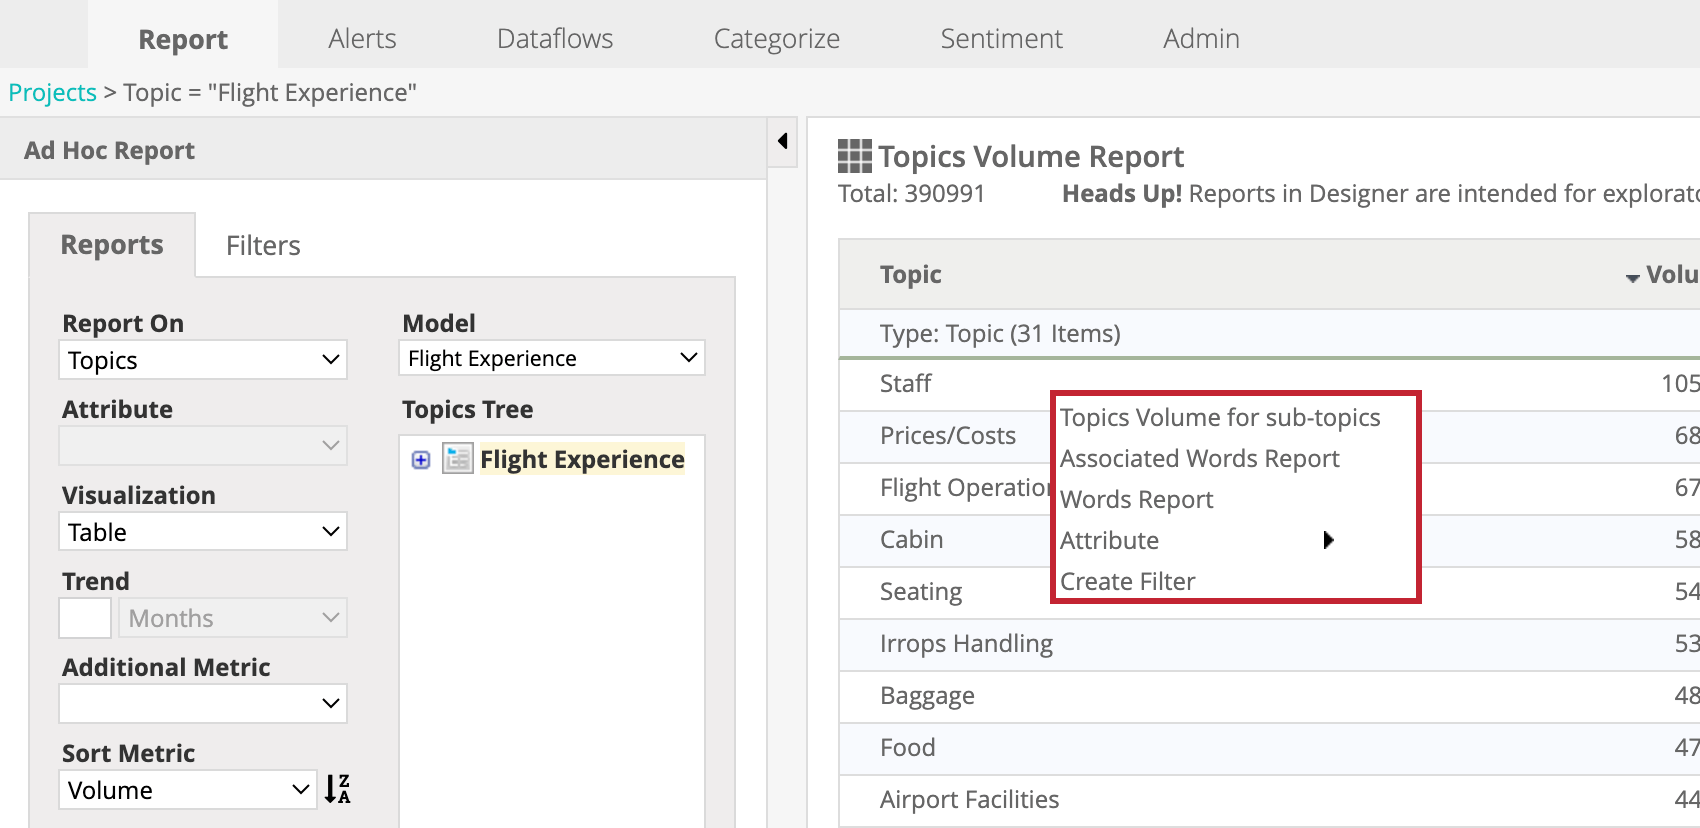
After you run an ad hoc report, you can further examine related subcategories, words, relationships, or attributes. Right-click a report element to view and select a corresponding sub-report from the menu.
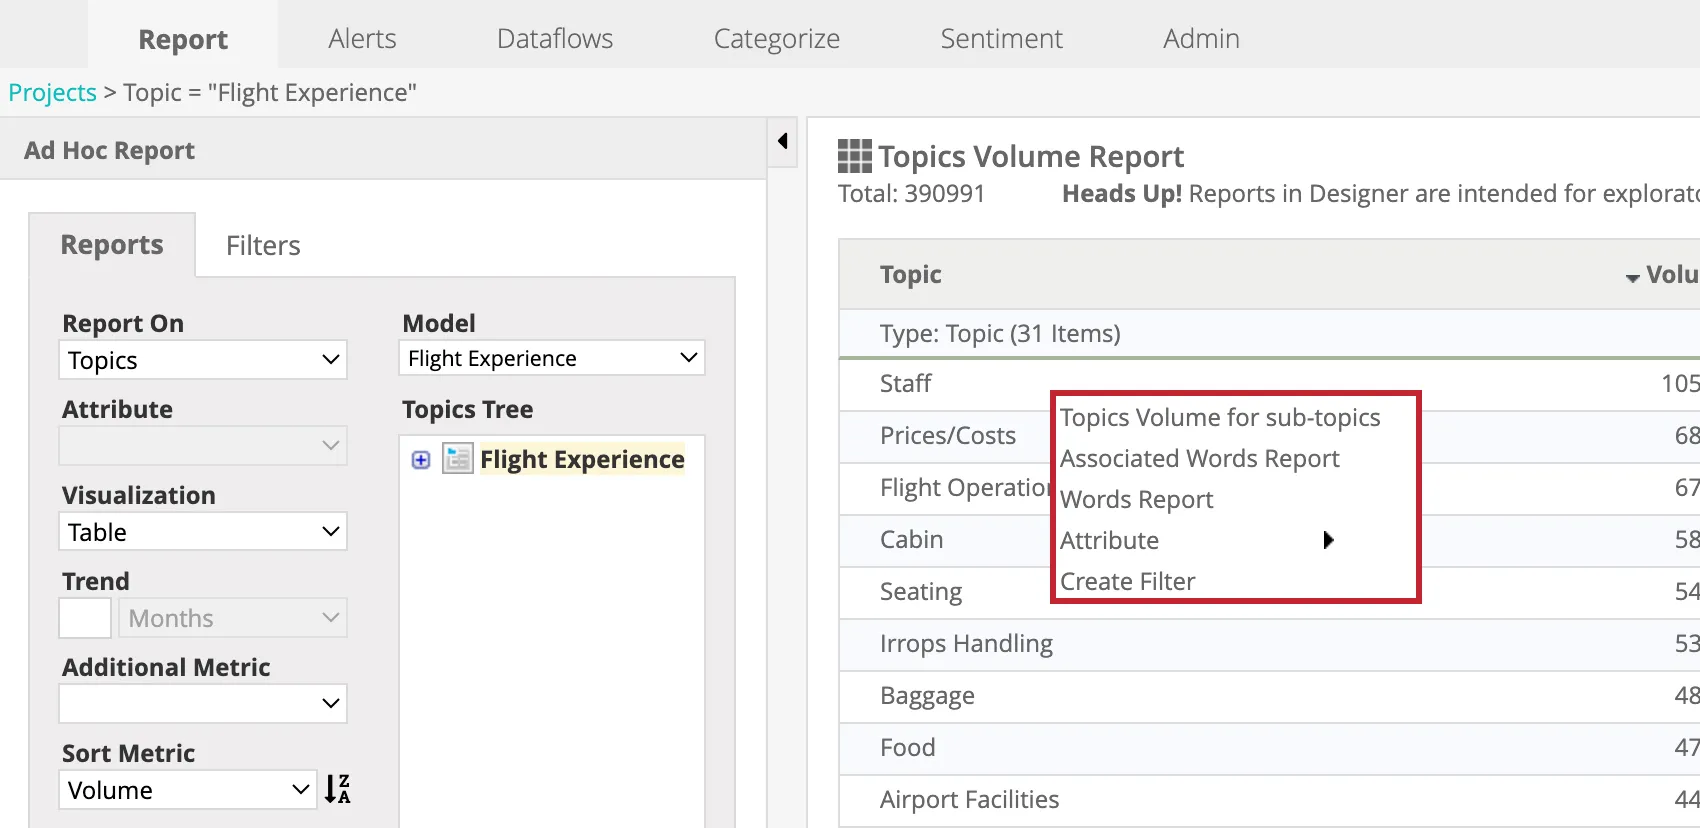
The following sub-reports are available:
- Topics Volume for sub-topics: View details for sub-topics, or topic leaves.
- Associated Words Report: View the most common associated words related to a topic, attribute, or word.
- Words Report: View the most common words related to a topic or an attribute.
- Attribute: Select an attribute from the list to see its most common values related to a topic, associated words, or a word. When reporting on business concepts attributes you can use this option to view related business concepts.
You can also select Create Filter to create a new filter based on the report element you selected.
Qtip: If you’ve already defined a path for an attribute, you can open this path by double-clicking. See Editing Attributes for more information.
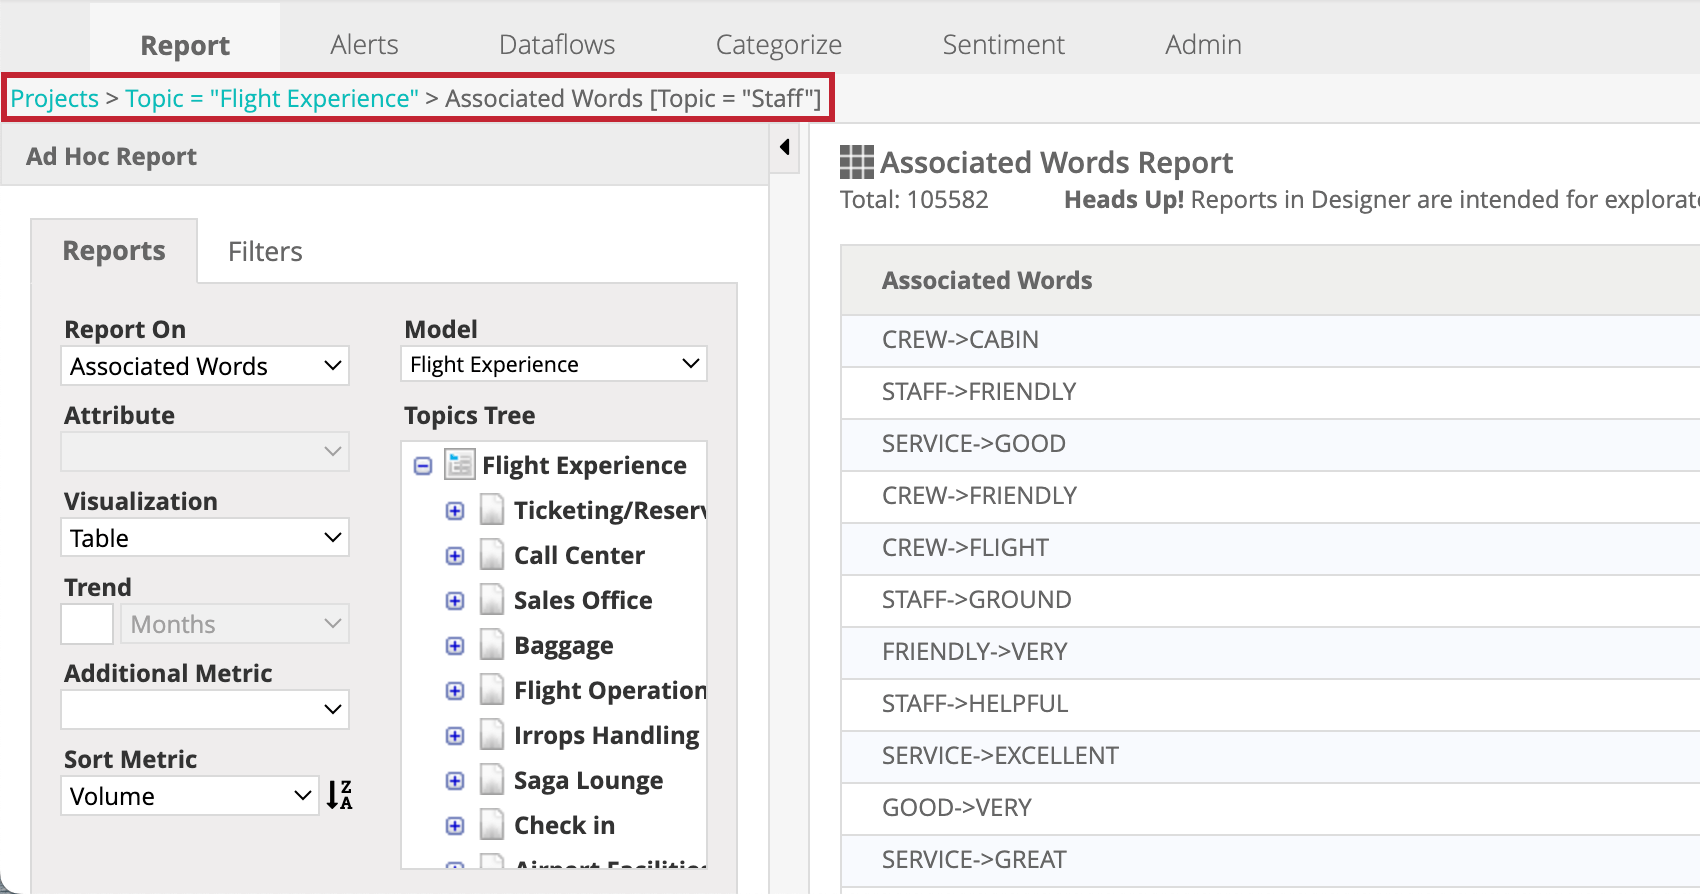
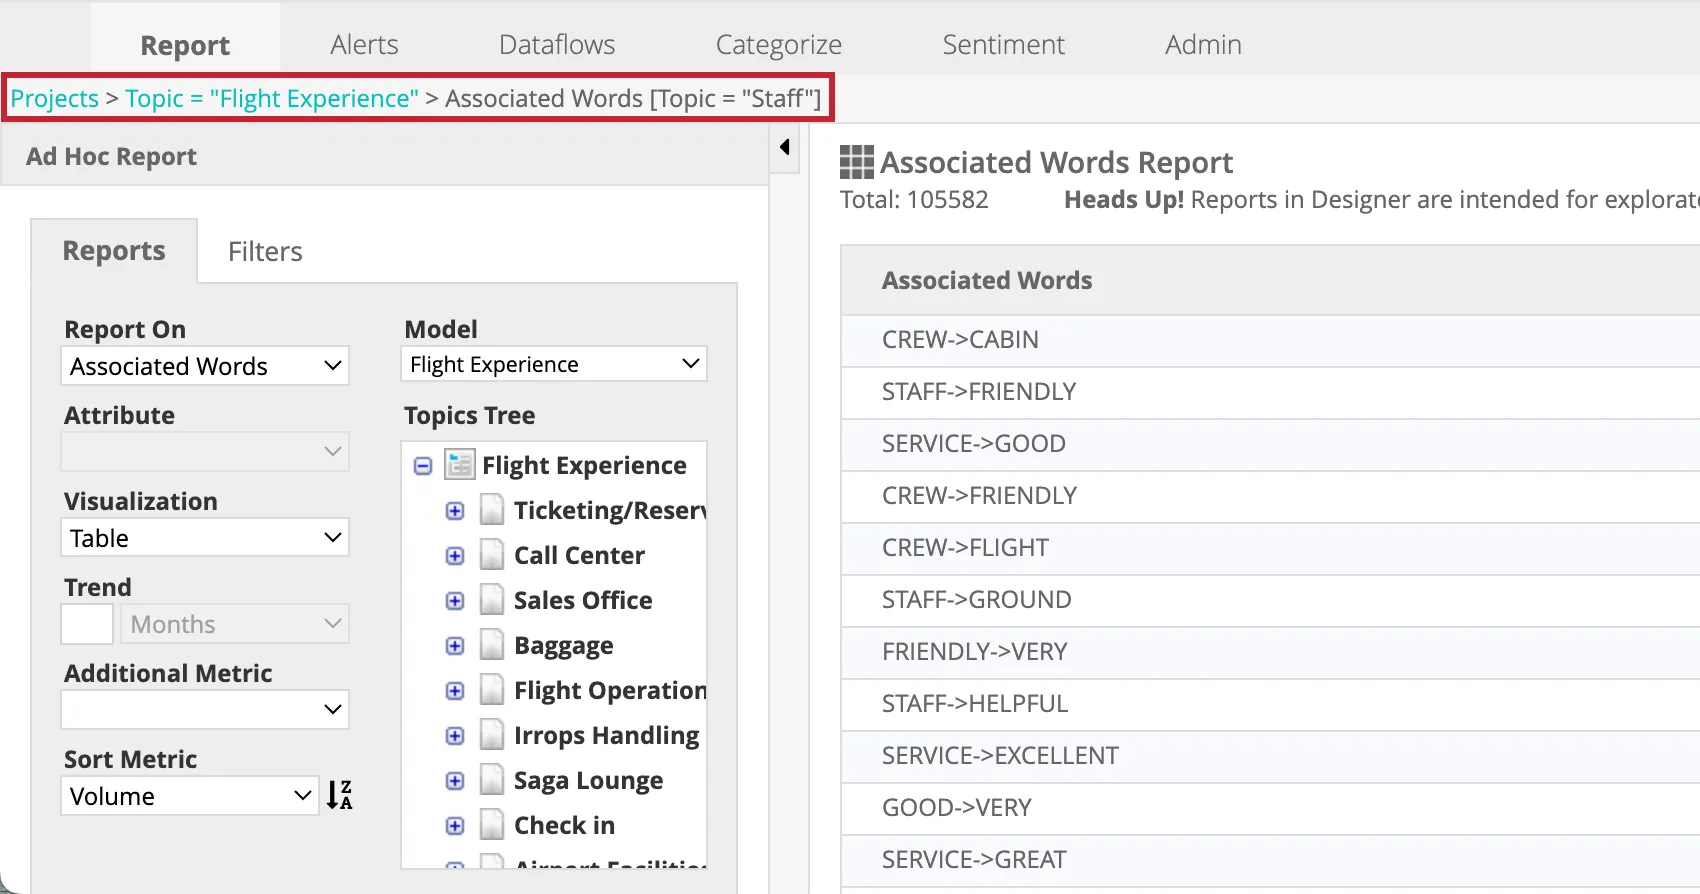
When you view subcategories within reports, the path you took to get there is displayed at the top of the page. You can click these links to return to previous reports.
Attention:When drilling from a words report to an associated words report and back, the word count totals may differ. This may happen because of the following reasons:
- Not all words are part of linguistic relationships.
- Some sentences do not contain any relationships.
- Word count totals may not include all variations of the word.
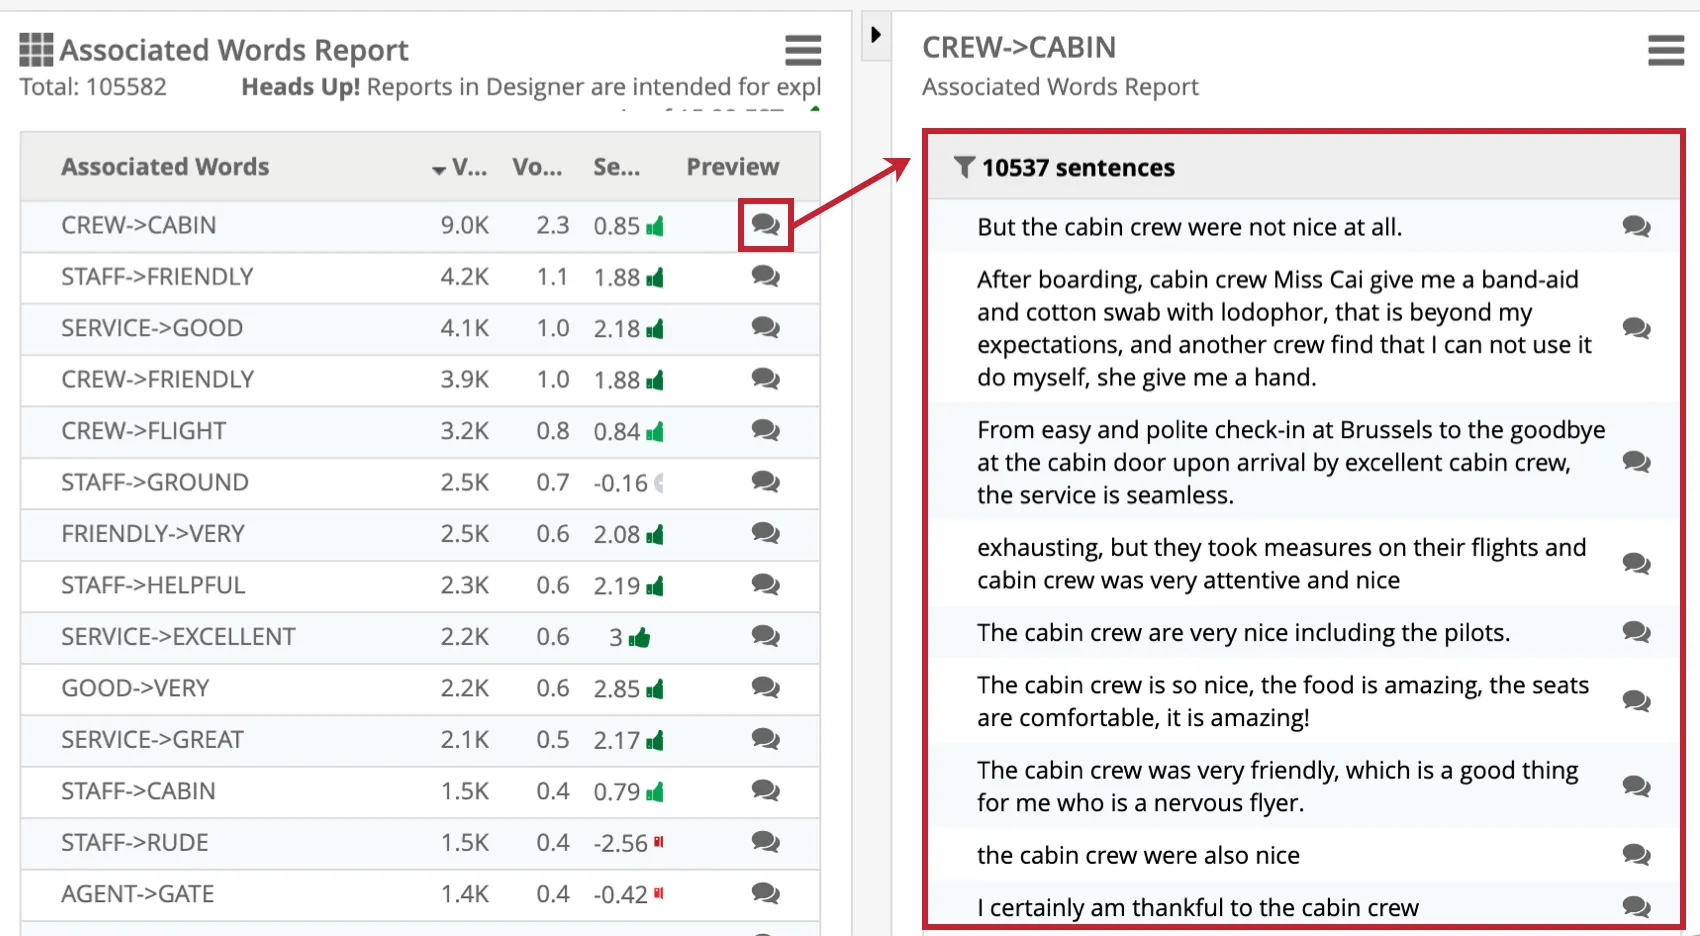
Previewing Sentences
Within your report you can preview the verbatims behind each included response. Use the preview button to open corresponding sentences in the preview panel on the right. The preview panel is collapsed when not in use. See Previewing Sentences for more information.
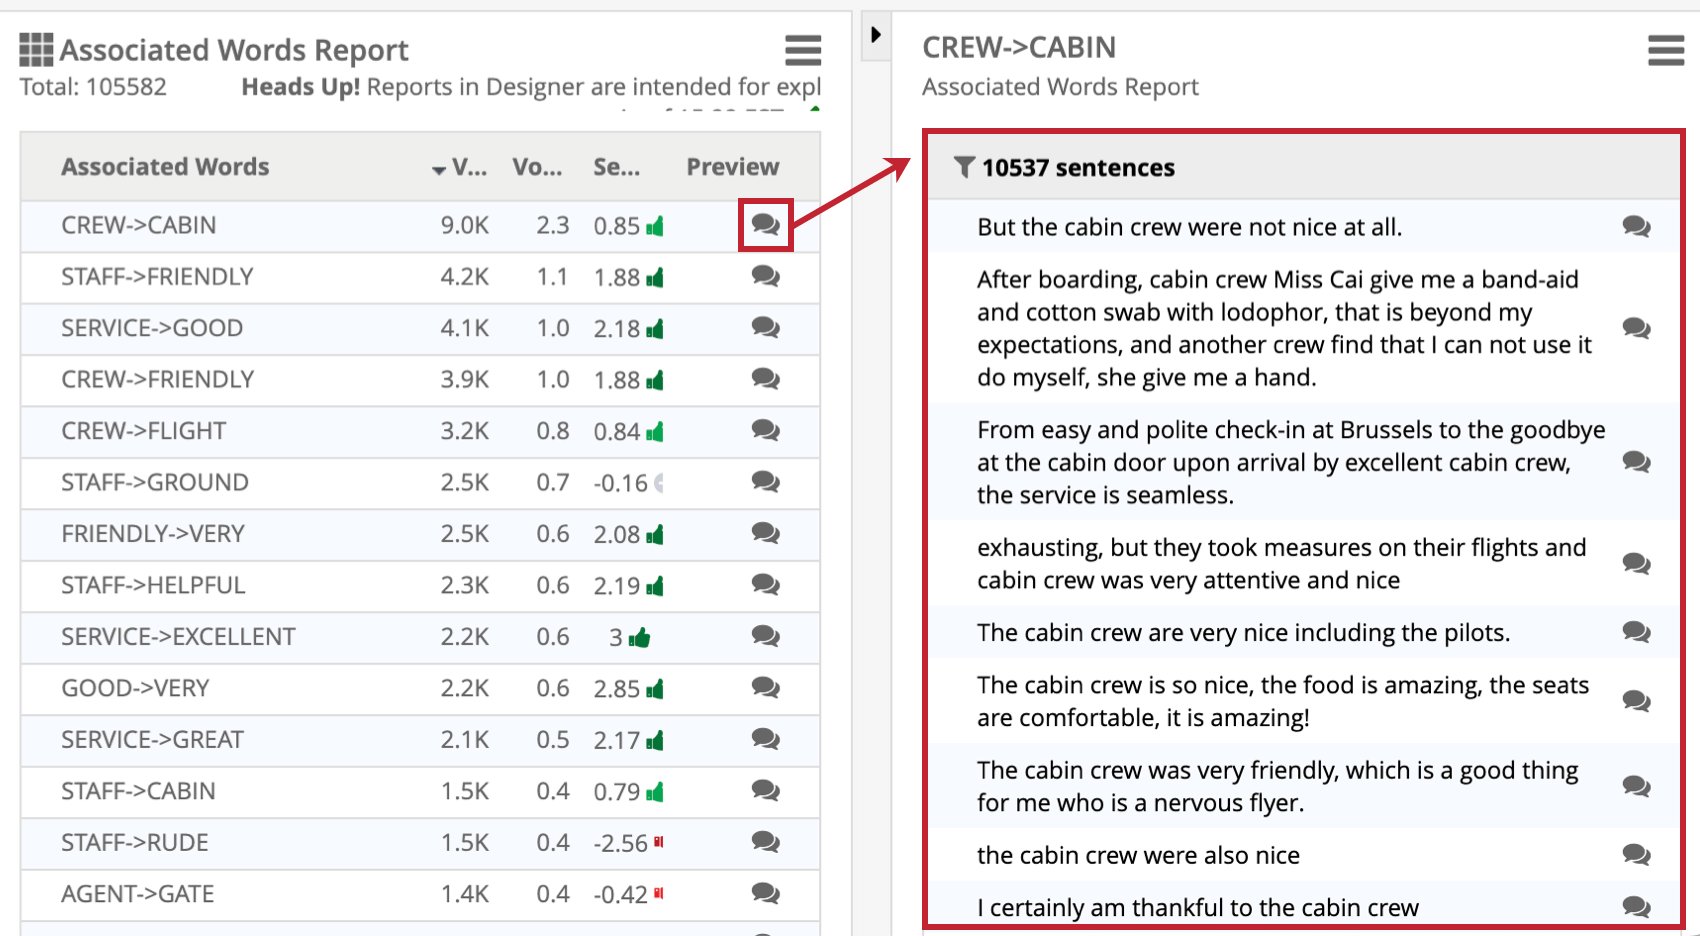
That's great! Thank you for your feedback!
Thank you for your feedback!