
Experience Assessment Widget (BX)
What's on this page
About Experience Assessment Widget
The Experience Assessment widget allows you to combine data from BX and CX projects to measure the impact and expectations of touchpoints in your brand. This widget contains two different visualizations: the Experience Alignment widget and the Experience Impact widget.
Experience Assessment widgets can only be added to Brand Experience dashboards.
Data Setup
This widget compares data points from both BX and CX programs to identify how that data impacts the customer’s experience. To use this widget, you will need to map both a BX and CX data source to the dashboards.
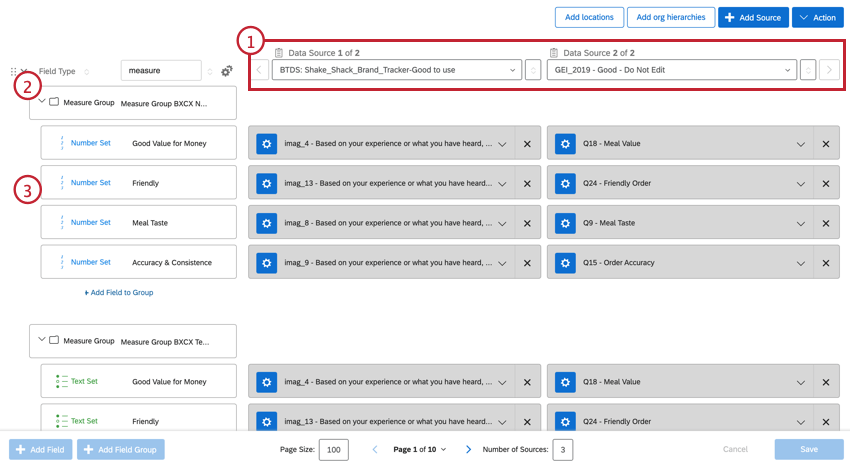
Qtip: Touchpoints are the data points that you would like to measure and compare against, such as “Value for Money”, “Friendliness”, “Consistency”, etc.
Widget Setup
For general information on creating and editing dashboard widgets, see the Building Widgets page. Continue reading for information about how to setup this specific widget.
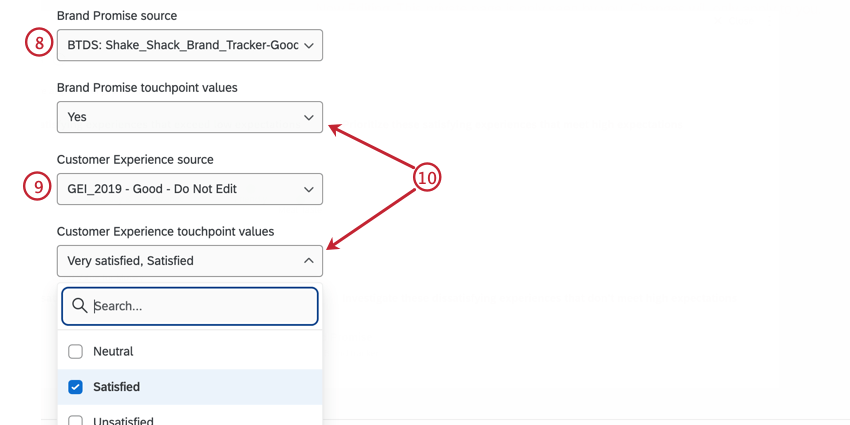
Example: The positive touchpoint for this BX source is “Yes”, while the positive touchpoint for the CX source is “Very Satisfied” and “Satisfied”.
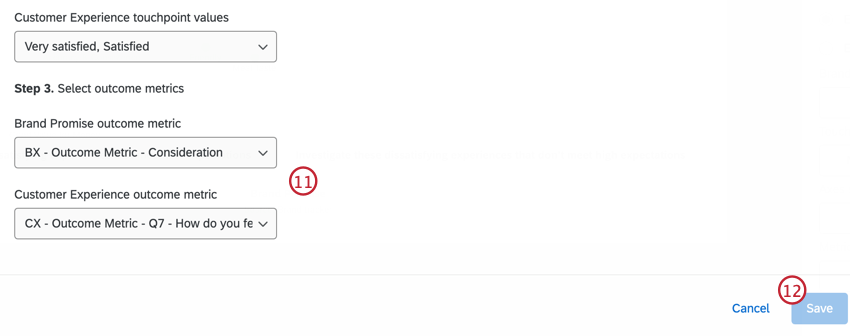
Example: The outcome metric for the BX source is “Consideration”, while the outcome metric for the CX source is the NPS score.
Widget Customization
For general information on how to add and edit widgets, visit the Building Widgets page. Continue reading for information about how to customize this specific widget.
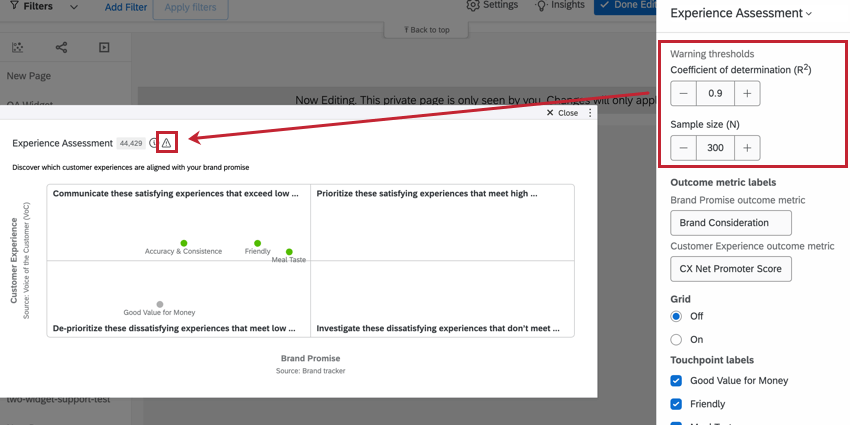
WARNING THRESHOLDS
If results are statistically insignificant, you’ll want to take that into account before making decisions based on what you see in the widget. Therefore, it’s possible to add a warning that will appear on your widget when responses aren’t within a particular statistical range. When you hover over this icon, it will elaborate on the warning.
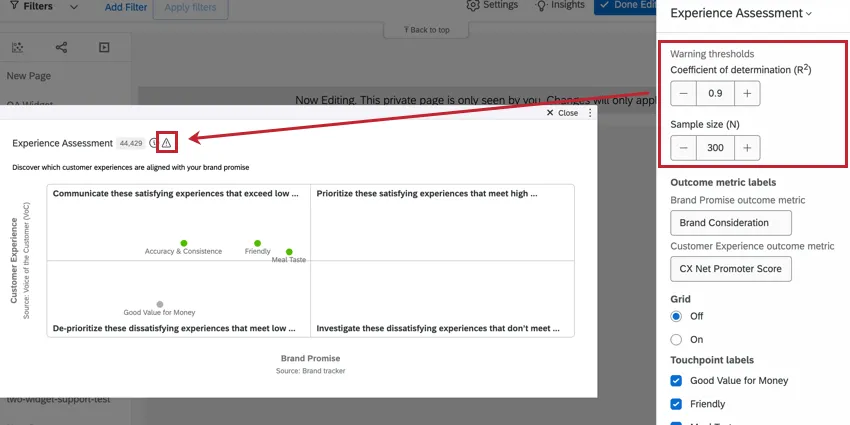
The coefficient of determination (R squared) is set to 0.2 by default. The sample size (N) is set to 300. You can adjust these as needed.
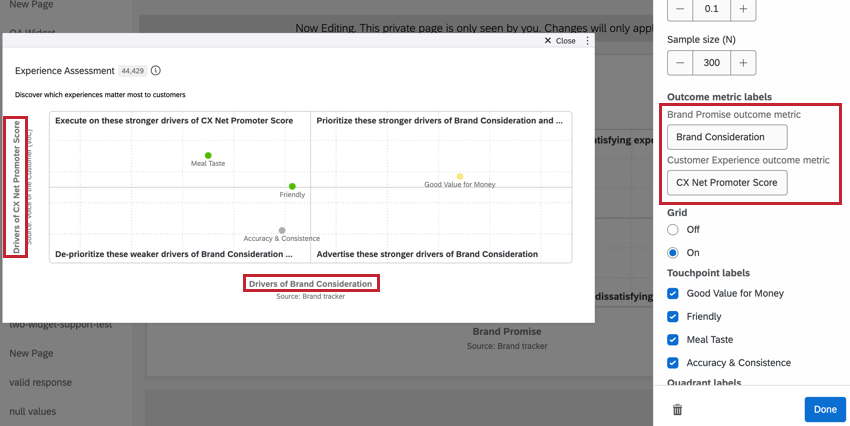
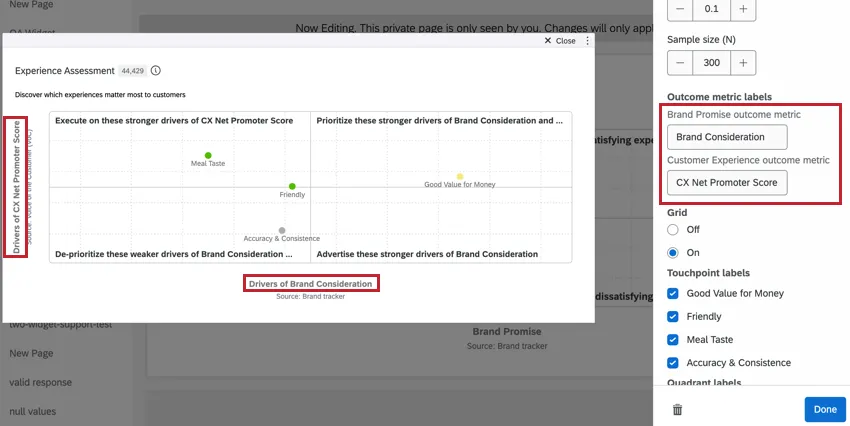
OUTCOME METRIC LABELS
Use these fields to customize the outcome metric labels in the Experience impact visualization.
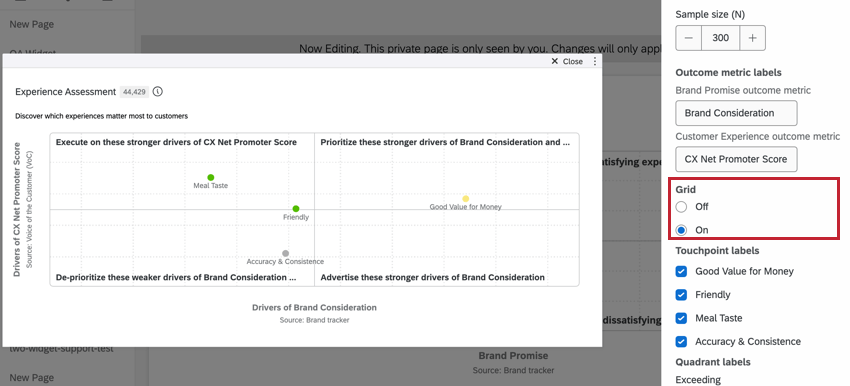
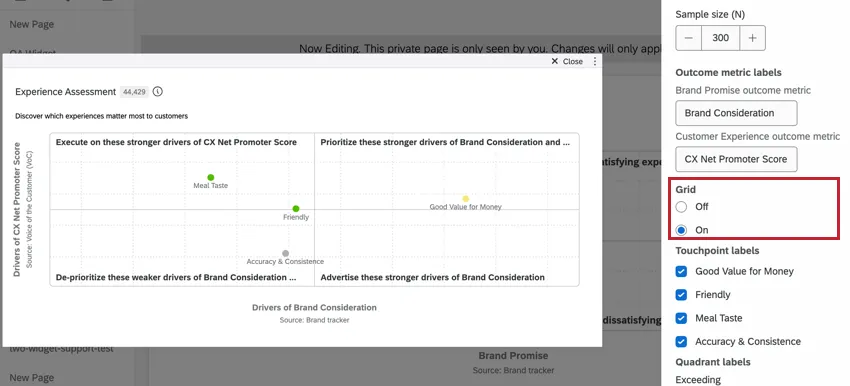
GRID
Indicate whether you would like grid lines included on the opportunity analysis chart.
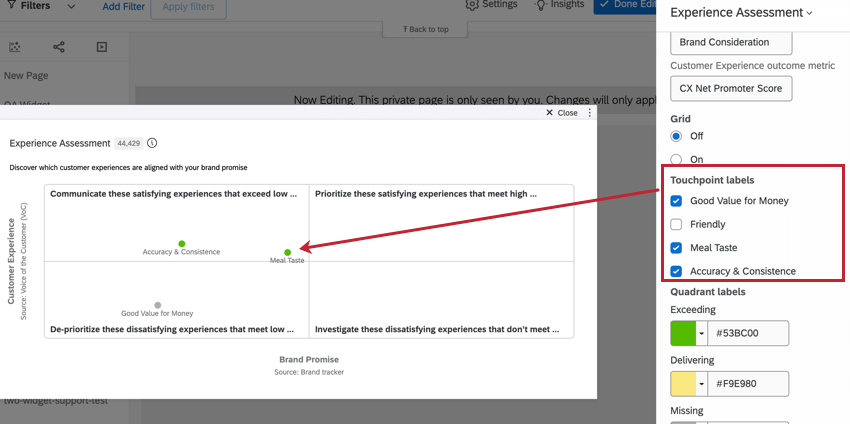
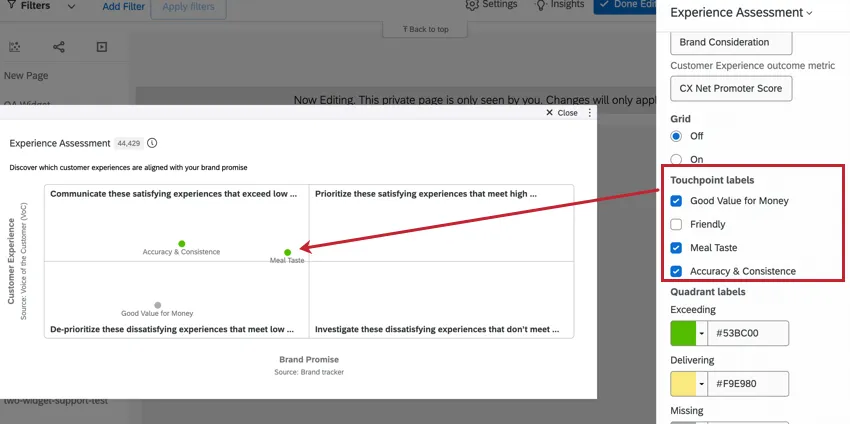
TOUCHPOINT LABELS
Only selected touchpoints are displayed in the widget. All touchpoints are selected by default. To remove a touchpoint from the widget, deselect that touchpoint.
QUADRANT LABELS
To edit the color of the touchpoints in each quadrant, click the color.
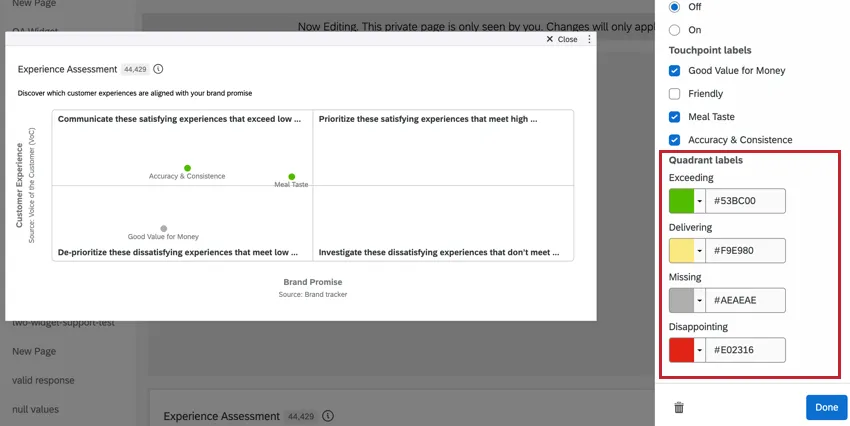
- Exceeding: Top-left quadrant. Indicates the strongest drivers and touchpoints that exceed expectations.
- Delivering: Top-right quadrant. Indicates strong drivers and touchpoints that meet high expectations.
- Missing: Bottom-left quadrant. Indicates weak drivers and dissatisfying touchpoints that meet low expectations.
- Disappointing: Bottom-right quadrant. Indicates potential drivers and dissatisfying touchpoints that don’t meet high expectations.
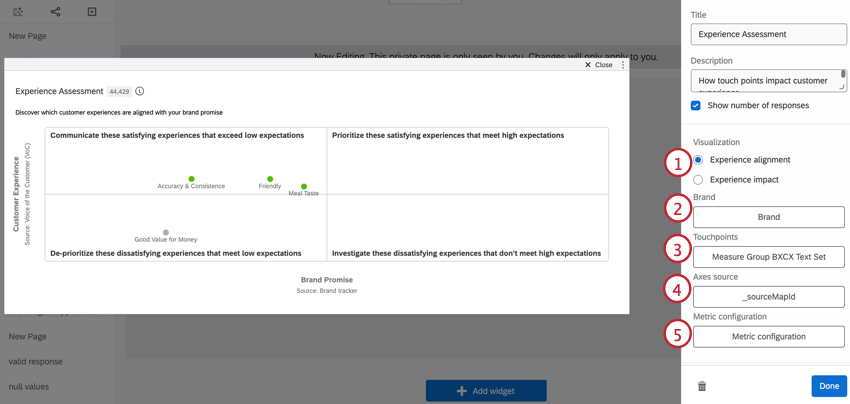
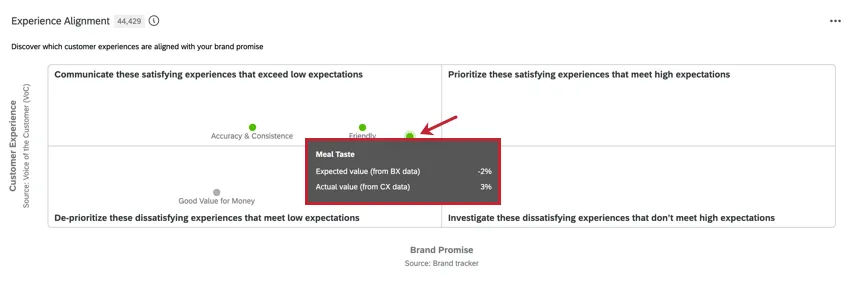
Experience Alignment Visualization
The Experience alignment widget allows users to analyze the gap between expectations and experience, and identify data-driven areas for improvement. This visualization displays the Brand Promise and Customer Experience scores for each touchpoint compared to other competitor brands.
- The x-axis plots the Brand Promise Score. This is the expectation that customers have for this touchpoint for the target brand compared to the competitor brands.
- The y-axis plots the Customer Experience Score. This measures how satisfied customers are with the touchpoint compared to other brand touchpoints.
Example: If we look at the “Meal Taste” touchpoint, we can see that it has a high customer experience value and a low brand promise value. With this data, we can infer that the customer’s experience exceeds their expectation.
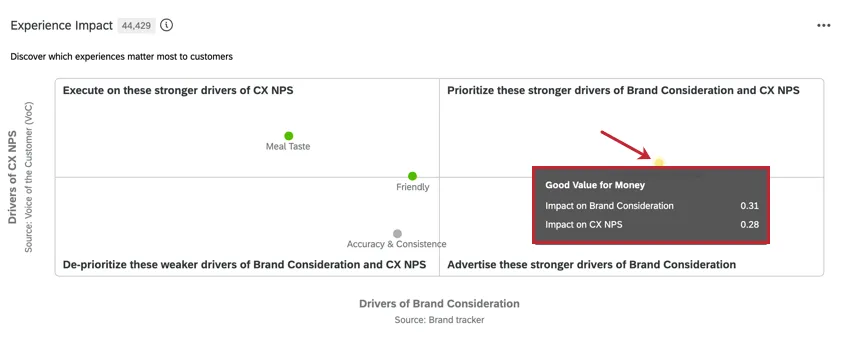
Experience Impact Visualization
The Experience impact visualization measures how much impact each touchpoint has on the outcome metrics. The higher the impact score for a touchpoint, the more important it is in influencing brand consideration and NPS.
- The x-axis plots the impact score of the BX outcome metric.
- The y-axis plots the impact score of the CX outcome metric.
Example: If we look at the “Good Value for Money” touchpoint, we can see it has a high impact score for both brand consideration and NPS. With this data, we can consider this touchpoint a strong driver of brand consideration and NPS.
That's great! Thank you for your feedback!
Thank you for your feedback!