
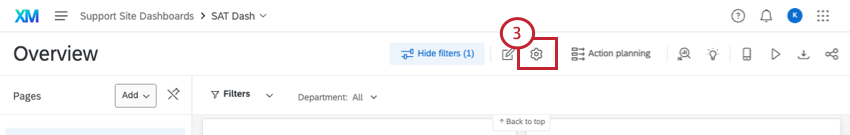
Translating Dashboard Data
What's on this page
About Data Translations
Data translations (or “filter translations” in CX dashboards) are the data fields you’ve mapped to your dashboard (names and recode values). These fields are translated separately from the rest of the dashboard text, but these fields only need to be translated once, rather than repeating the process for each page filter.
Examples include:
- Field names
- Field values
- Category names
- Question statement names
Qtip: In CX Dashboards, this is how you translate filter values, but not filters names. Filter names are covered by label translations.
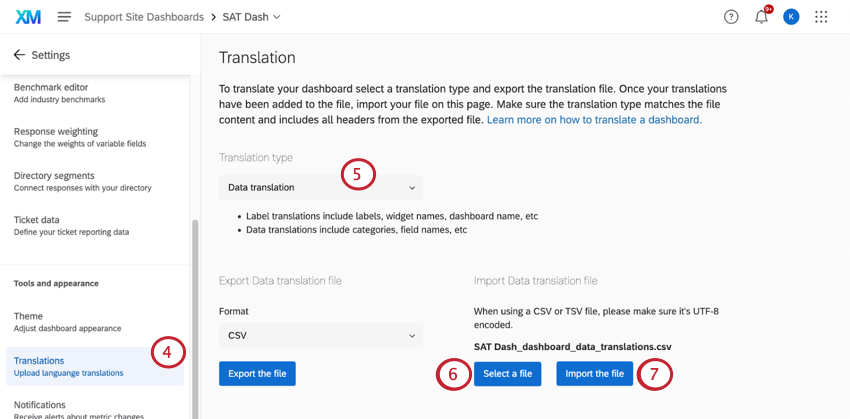
Data translations are done slightly different depending on whether you have a data mapper or data model dataset. However, you can also just translate straight from the Translations tab, which is the same regardless of your dataset.
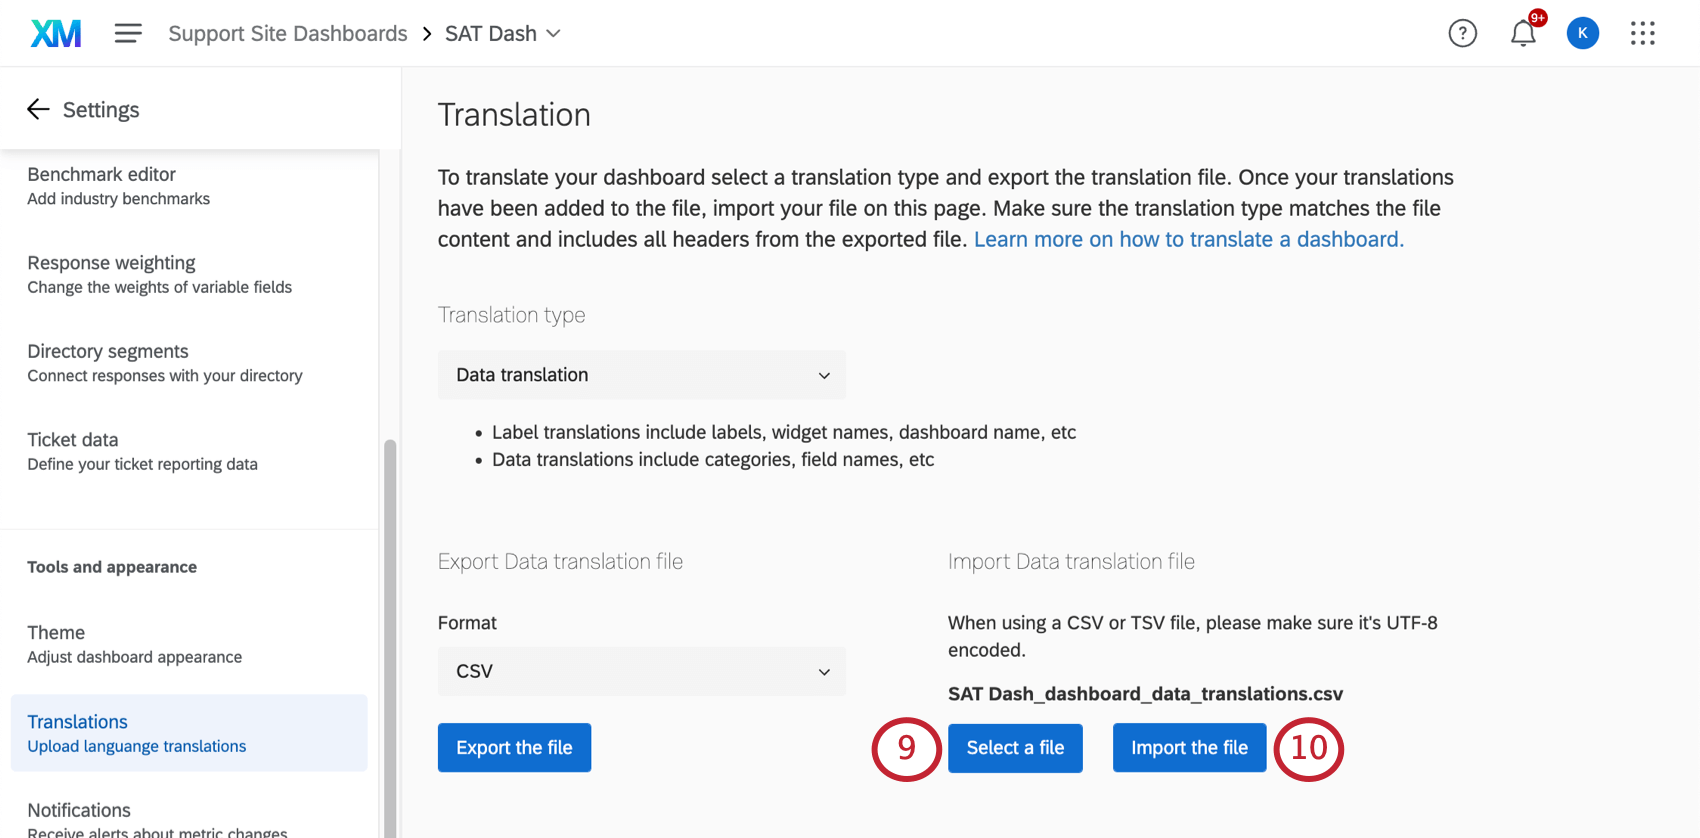
Qtip: Only import translations after all field name changes are made. If you change any field names after translating your dashboard data, you’ll have to re-upload the translations file with the new names for them to appear in the dashboard.
Attention: Importing a data translations file completely replaces existing translations with the contents of your file. If a partially completed translation file is imported, existing translations that are not in the new file will be overridden with blanks. Be sure to include every field in the import file when updating a translation for a language.
Attention: For troubleshooting tips and translation compatibility, see the Dashboard Translation Basic Overview.
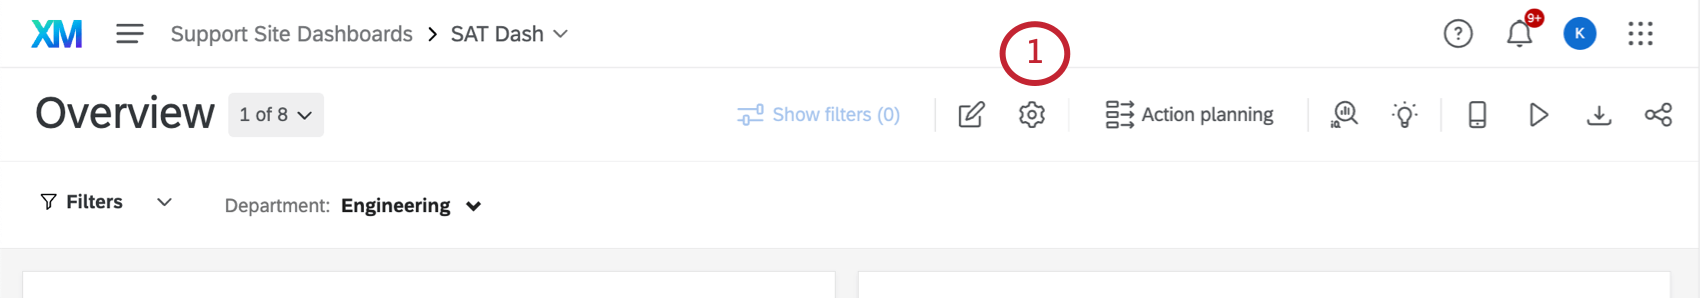
Translating Dashboard Data
Qtip: You cannot translate ticket datasets or action planning datasets.
These steps work regardless of whether your dashboard is EX or CX, or a Results Dashboard, and whether it uses a data mapper or a data modeler.
For a list of languages supported, see the Languages in Qualtrics page.
Qtip: When you copy a dashboard, translations of fields and categories will carry over. Other dashboard translations will not.
Qtip: Values must be recoded in order to be translated.
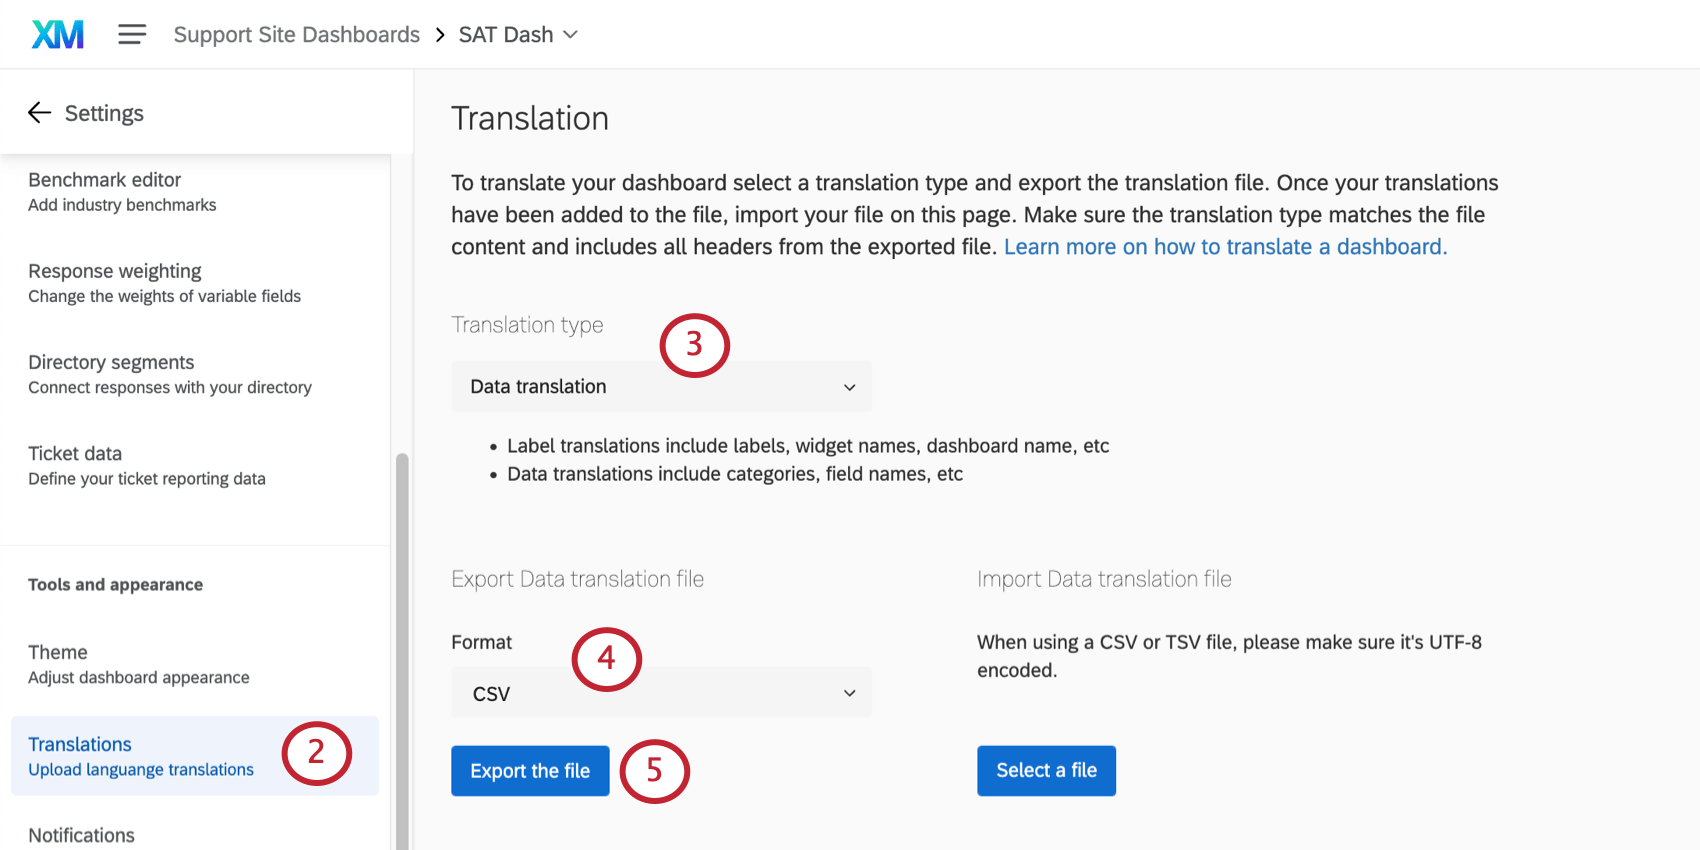
- See the List of Language Codes page for guidance about each language column.
- Follow the file’s exact formatting for creating your translations.
- Use the English column (EN) as a guide.
- Copy and paste to ensure formatting is correct. Do not delete or rearrange the columns, as this will cause the import to fail and translations to be lost.
- Do not delete the strings of numbers and letters – these are internal IDs that identify the parts of the dashboard you are translating.
Warning: Once you’ve saved the file, do not open it again as this could cause you to lose formatting for any special characters.
Qtip: The recode values of dashboard fields will no longer appear in JSON format in this file; instead they’ll appear as rows in the spreadsheet, making it easier to add translations for each value.
Other Places to Translate Filters
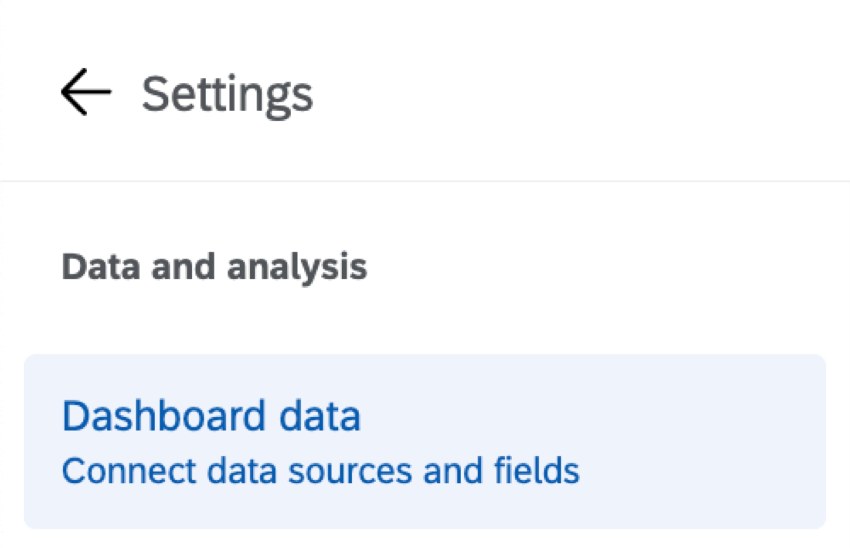
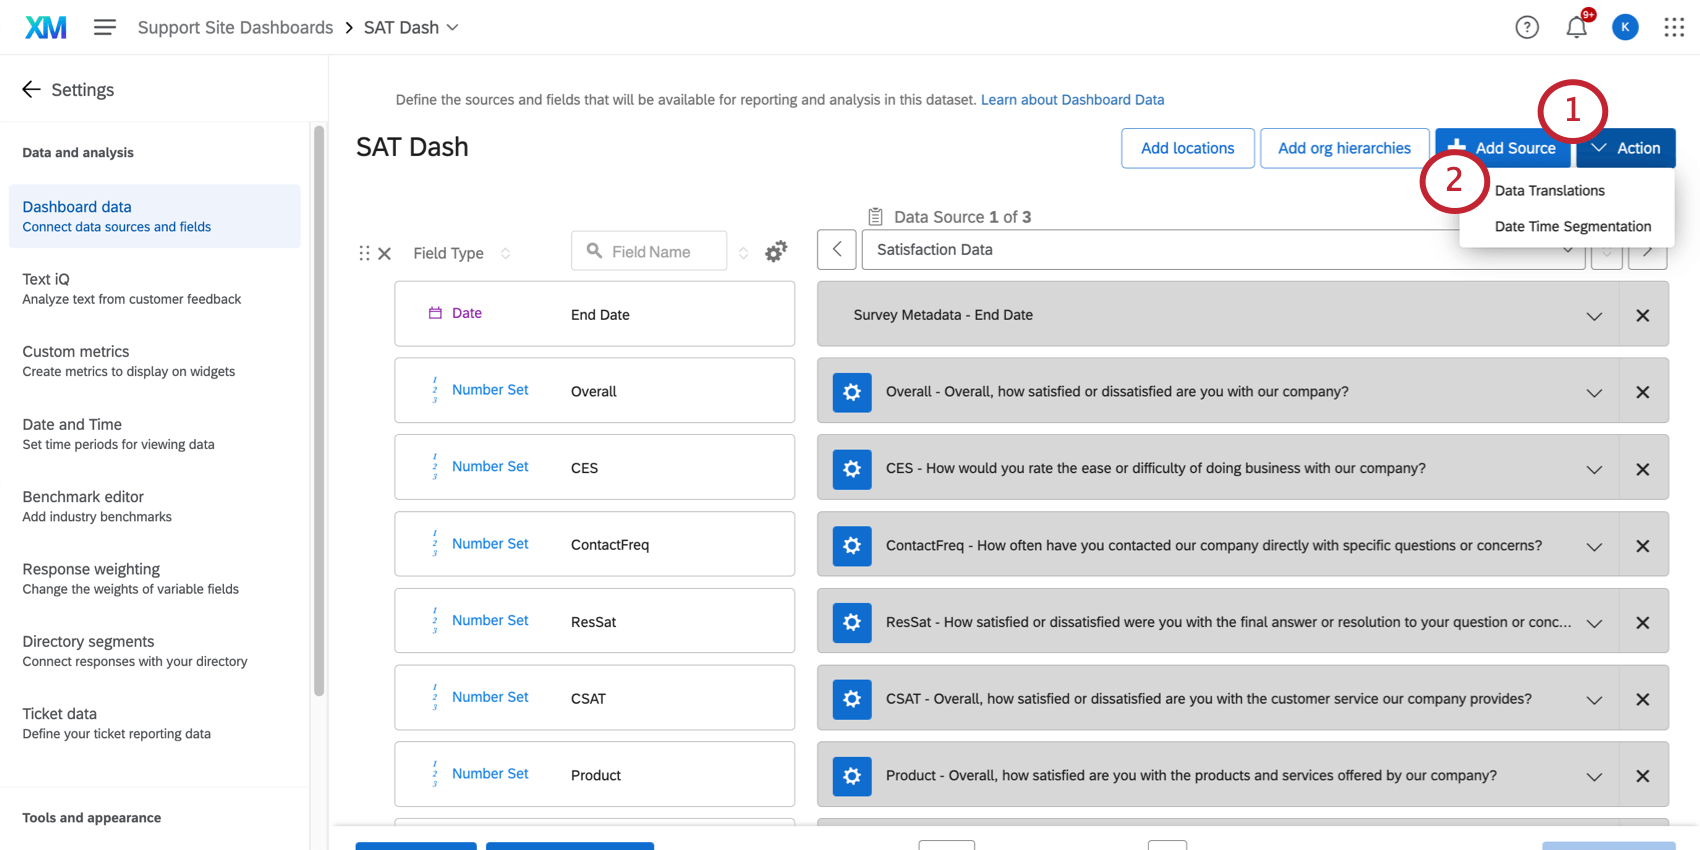
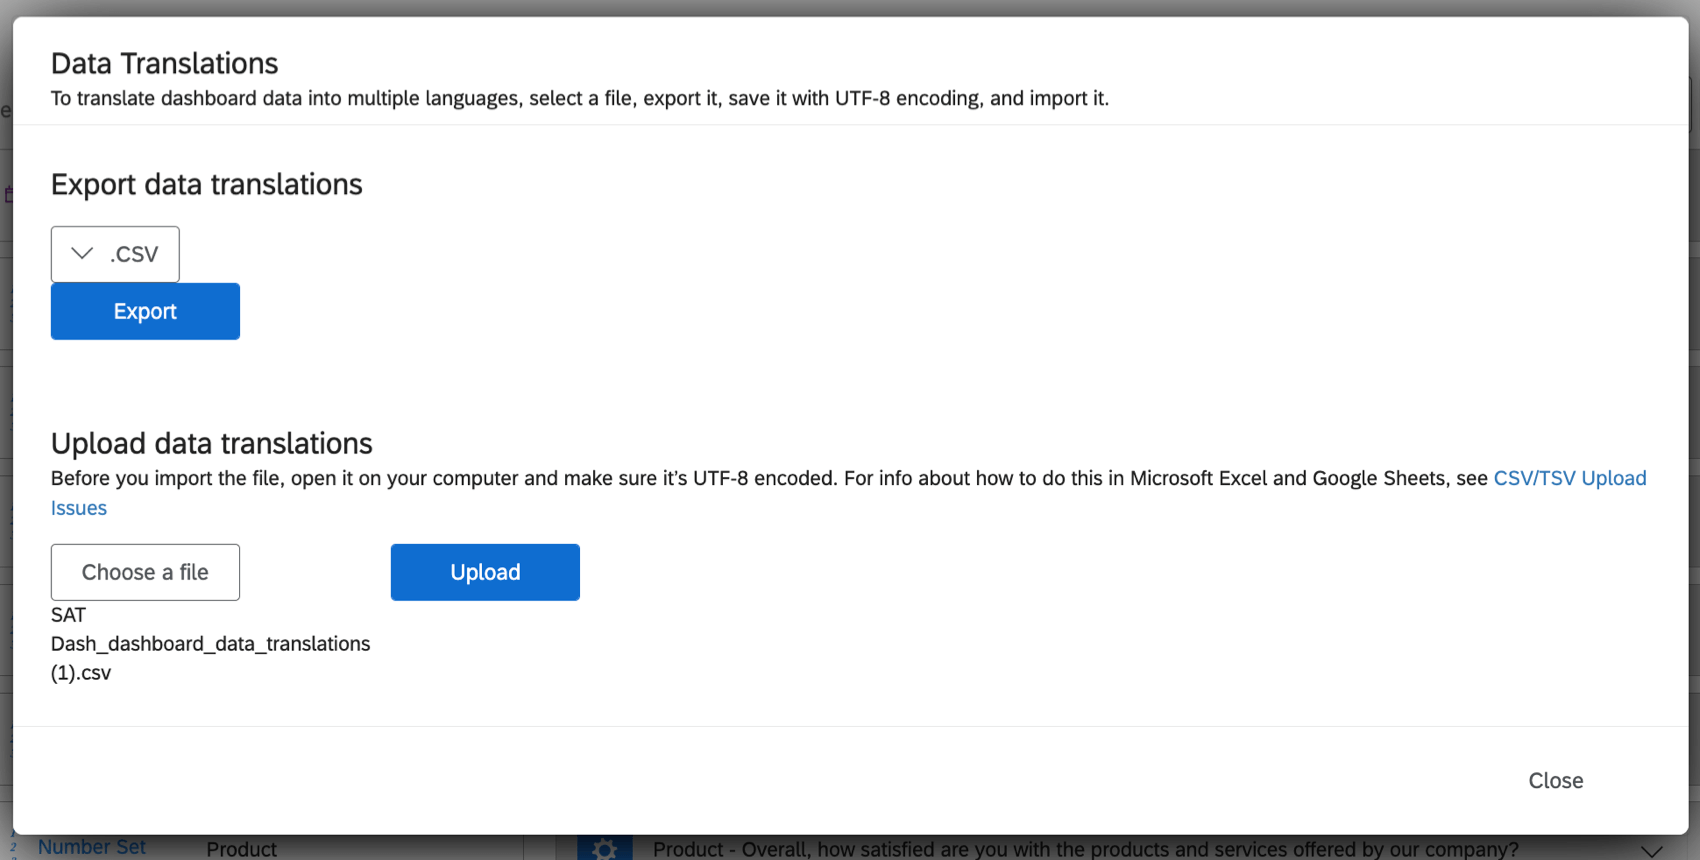
You can also translate filters in the Dashboard data tab of your dashboard settings. However, while most of the steps will be the same as what we described previously (exporting a sample file, editing a spreadsheet, and re-uploading it), the user interface varies.

Data Mapper
Data mappers are some of the most common datasets and look like the screenshots you see below.
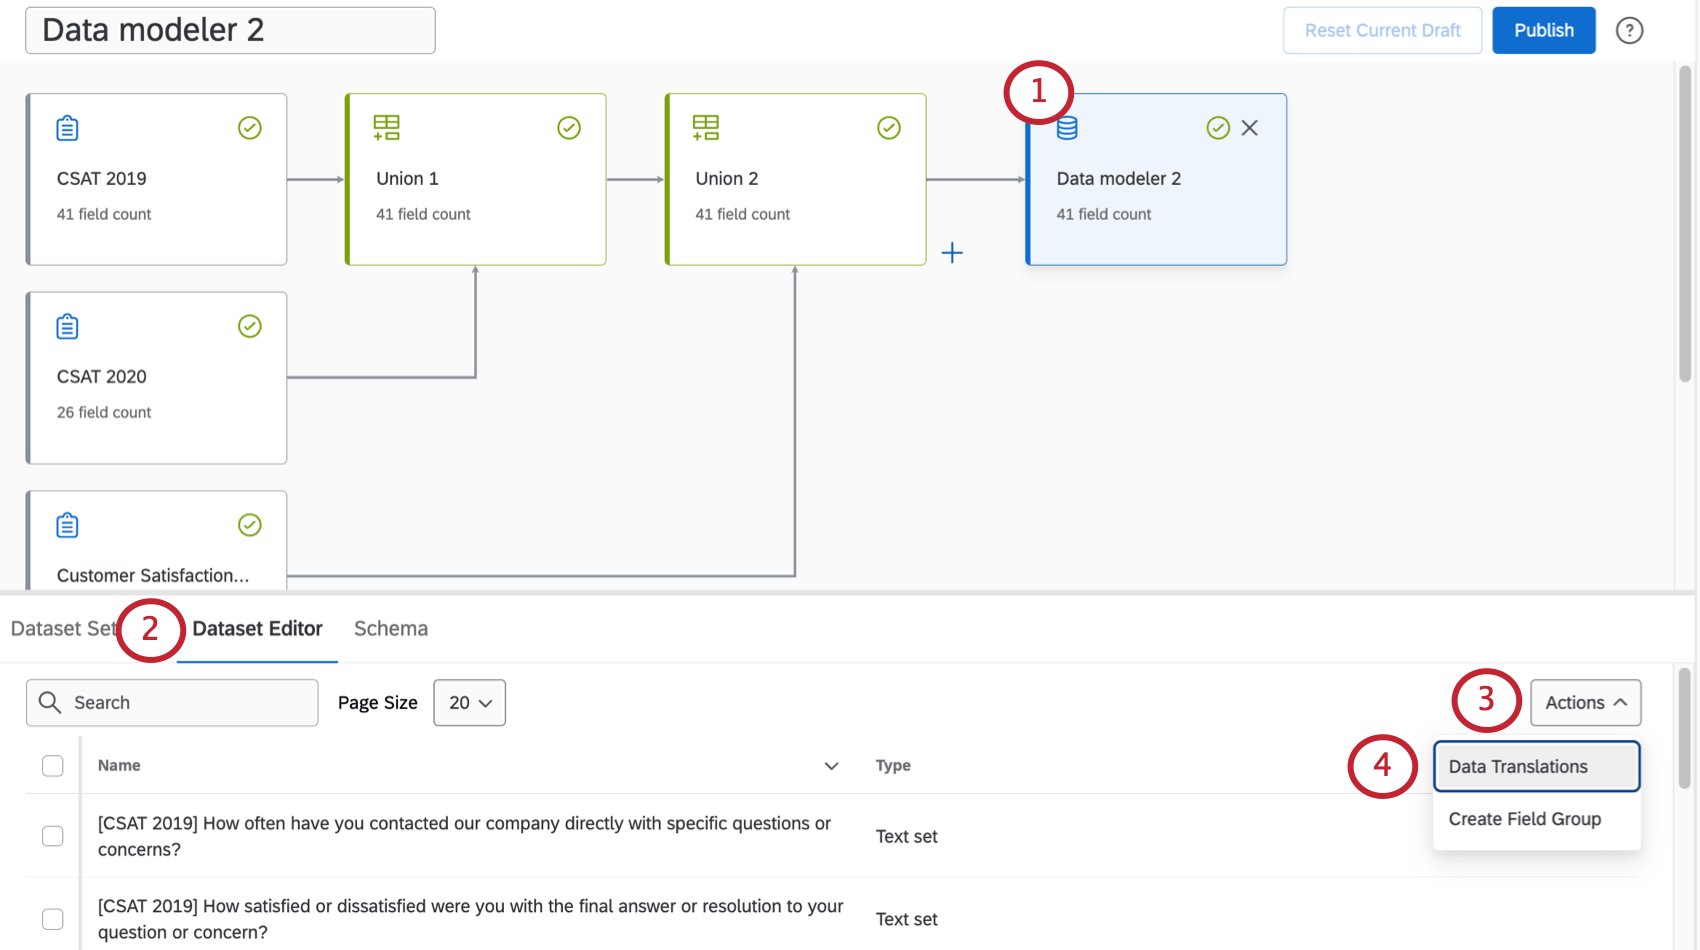
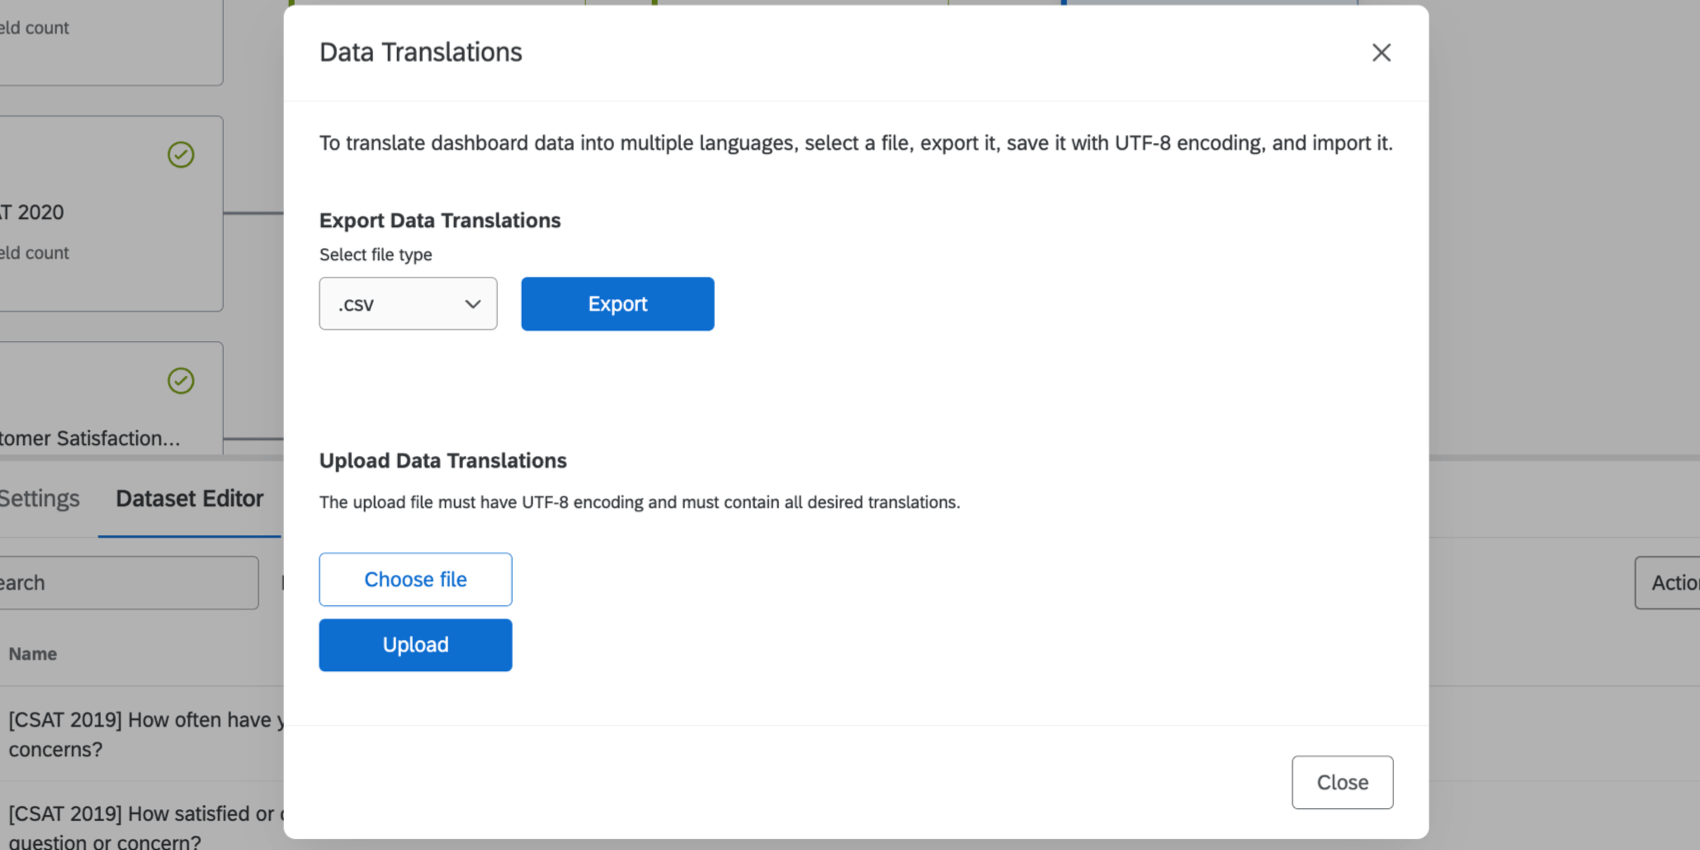
Data Modeler
Qtip: This feature is not available in EX Dashboards like Engagement, 360, Ad Hoc Employee Research, or Lifecycle.
Data models let you create joins and map data from very different sources together, such as surveys, tickets, and imported data projects.
Attention: Data models must be published before you can edit data translations.
Deleting Dashboard Data Translations
Follow these steps to delete a dashboard data translation:
Attention: Once you delete a translation of your data fields, it cannot be retrieved.
Example: To delete the Spanish translation of your data, change the column header from “ES” to “ES [DELETE]”.
Troubleshooting Translations
See the Dashboard Translation page for help opening files, previewing translations, fixing file formatting, and more.
Translation Compatibility
Attention: Deprecated widgets are notcompatible with data translations.
Widget Compatibility (CX)
The following widgets are compatible with data translations. Label translations refer to labels, widget names, and dashboard names. Data translations refer to categories and field names.
| Data Translations | |
|---|---|
| Record Table | Yes |
| Table | Yes |
| Text IQ Table | Not Applicable |
| Gauge Chart | Yes |
| Number Chart | Yes |
| Line and Bar Chart | Yes |
| Response Ticker | Yes |
| Star Rating | Not Applicable |
| Key Driver | No |
| Breakdown Bar | No |
| Online Reviews Widget | Not Applicable |
| Donut / Pie | Yes |
| Focus Areas | Not Applicable |
| Text IQ Bubble Chart | No |
| Coaching Priorities | No |
| Action Planning Editor | No |
| Frontline Reminders | Not Applicable |
Widget Compatibility (EX)
The following widgets are compatible with data translations. Label translations refer to labels, widget names, and dashboard names. Data translations refer to categories and field names.
| Data Translations | |
|---|---|
| Question List | Yes |
| Score Card | Yes |
| Heat Map | Yes |
| Engagement Summary | Yes |
| Demographic Breakout | Yes |
| Participation Summary | Yes |
| Bubble Chart | Yes |
| Comparison Widget | Yes |
| Response Rates | Partial (no recodes or breakouts) |
| Gauge Chart | Yes |
| Number Chart | Yes |
| Response Ticker | Yes |
| Key Driver | No |
| Focus Areas | Not Applicable |
| TextiQ Bubble Chart | No |
| Line & Bar Chart | Yes |
| Table | Yes |
| Record Table | Yes |
| Donut / Pie | Yes |
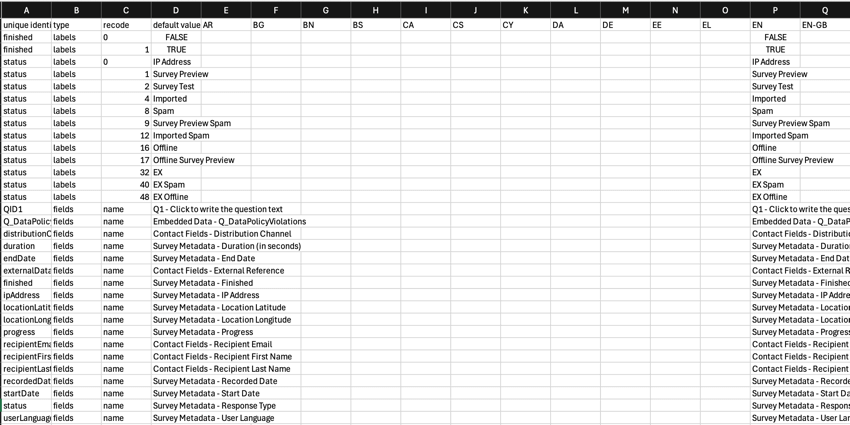
Understanding Data Translation Files
This section covers how to read an exported data translation file, which is shown below.
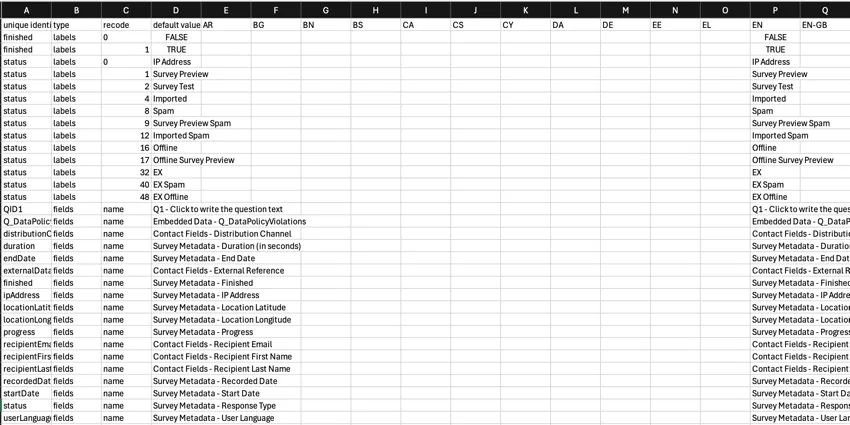
Each row of the exported file represents a single data translation. From left to right, the columns include:
- Unique identifier: The internal Qualtrics ID for the data translation field. Qtip: Recode translations and field translations that match each other will have the same value in the “unique identifier” column.

- Type: Identifies the type of data translation:
- Labels: A recode translation of the field values (i.e. the different field values displayed in a widget or used in a dashboard filter).
- Fields: A field name translation (i.e. the names of the fields that appear when choosing fields to display in a widget).
- Recode: The recode value.
- Default value: Represents the base translation of the data. This is the original text that is being translated.
- Language codes: Add the translated content in the associated language columns, identified by the language codes. Use the “default value” column as a guide.
Attention: Do not delete the “unique identifier,” “type,” “recode,” or “default value” columns or edit their headers.
Qtip: If you see recode translations in your file but you don’t see them when viewing recode values, then they may be in the “Manage Labels” section, which can be found by clicking More Options and then Manage Labels in the recode editor.
That's great! Thank you for your feedback!
Thank you for your feedback!