
Map Widget (Studio)
What's on this page
About the Map Widget
Qtip: To modify dashboard widgets, a user must have an Edit Dashboard permission and be granted Can Edit permission for the specific dashboard. For information about widget permissions, see Editing Widget Properties.
Attention: To ensure optimal Studio performance, there is a limit on the number of widgets that can be added to each dashboard. For more information, see Maximum Widgets per Dashboard.
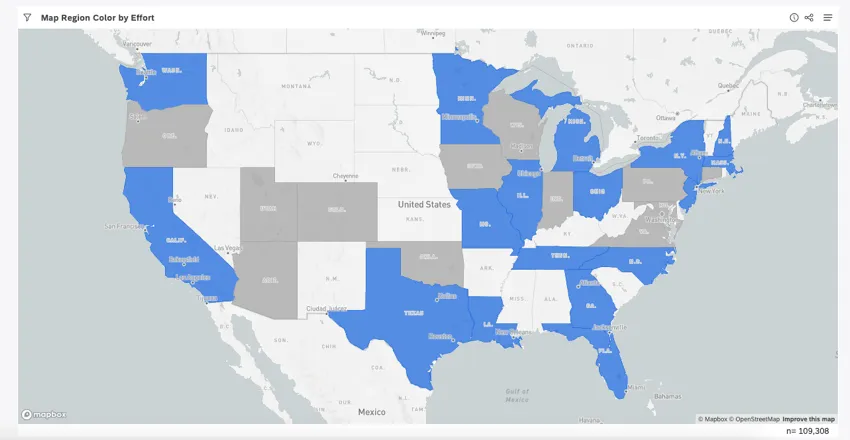
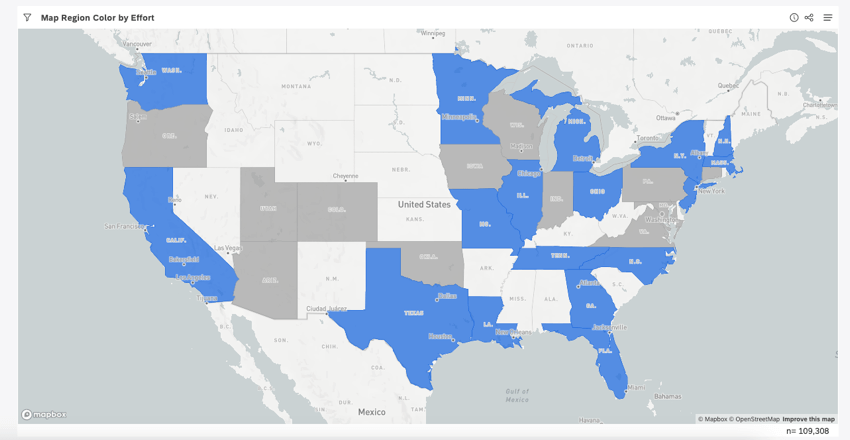
The map widget is a Studio report visualization that layers XM data on top of maps to provide the geographic context of customer interactions and feedback. To present XM data on a map, you first need to mark groupings as geographic.
For information about editing widget properties and more, see Widgets (XM Discover).
Marking Groupings as Geographic
To present XM data on a map:
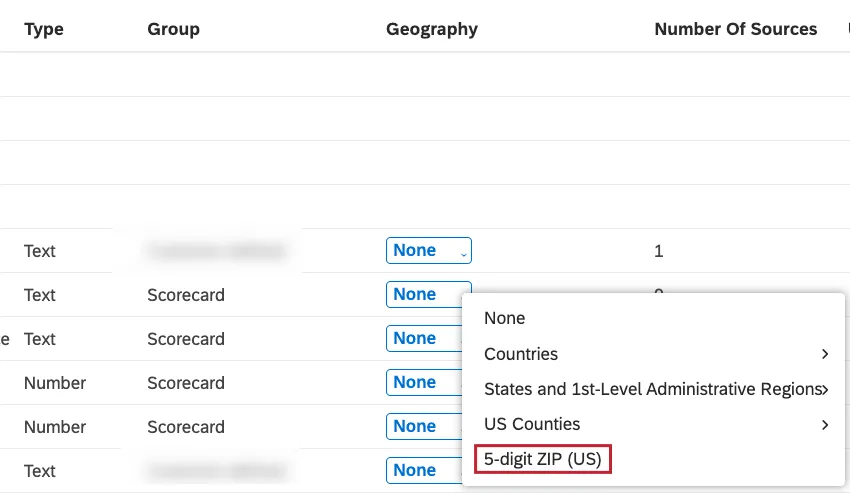
- You need at least 1 geographic grouping option in your data. It can be an attribute with geographic values or a model with topics that categorize data by its location. Qtip: Use out-of-the-box geography models to group data by countries or states.

- You need to mark this grouping option as geographic in Studio and define which level of geography it represents.
Attributes and models marked as geographic can be used to group data in the map widget.

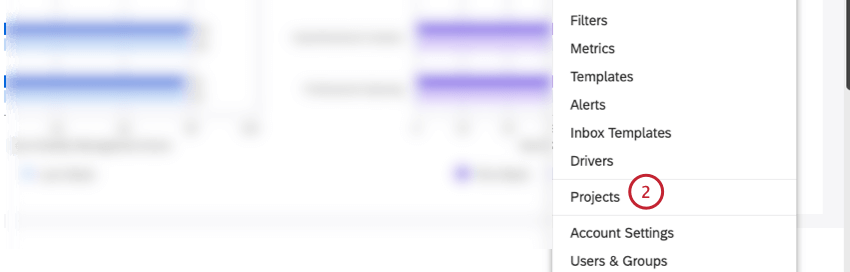
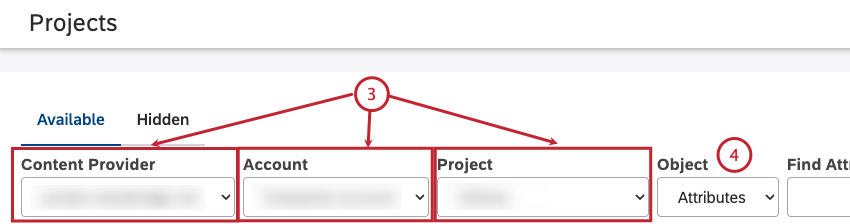
Qtip: You only need to select a content provider, account and project if you have more than 1 content provider, account or project.
- To mark an attribute, select Attributes.
- To mark a model, select Models.
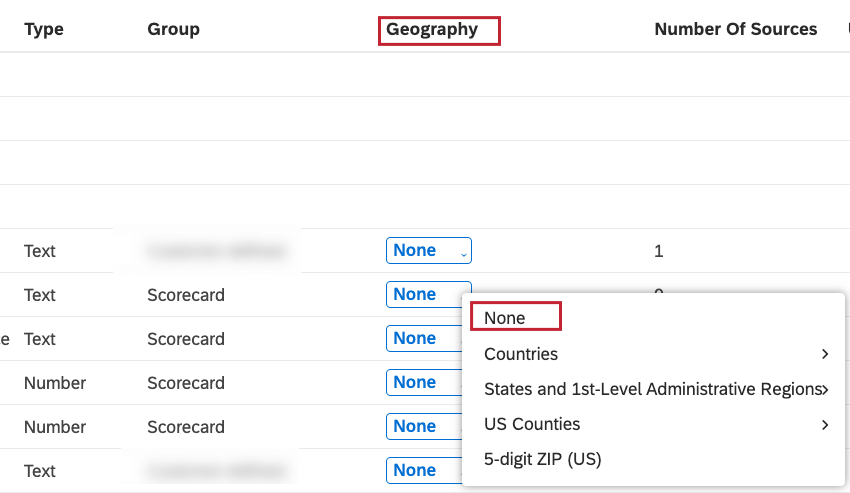
- None: Mark a grouping as not geographic.
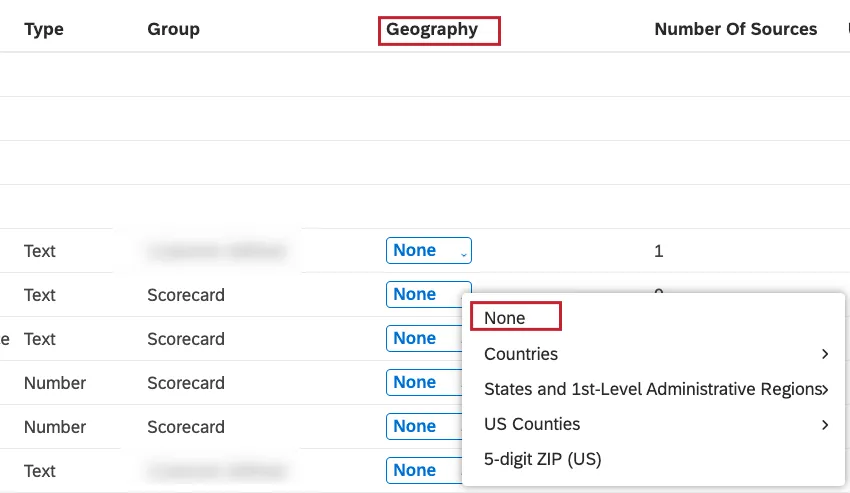
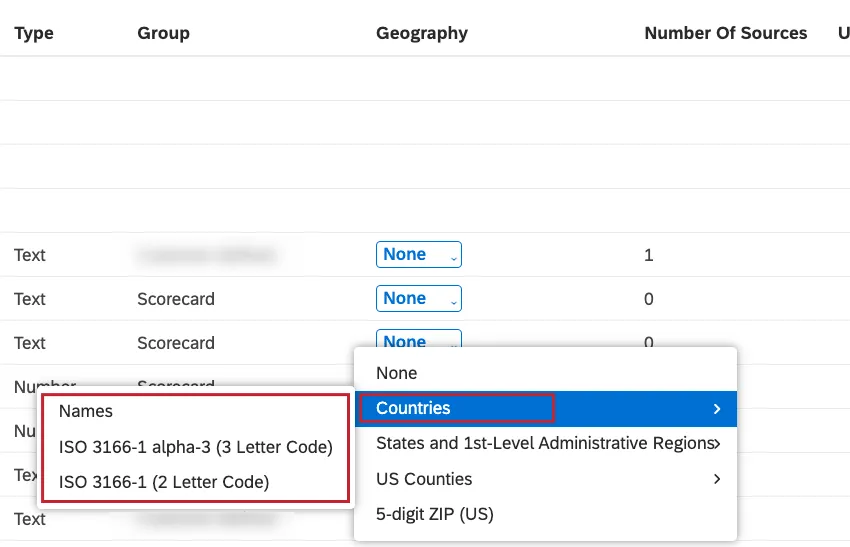
- Countries: Select this if the grouping contains country-level data and then choose the format in which the values are provided. For more information, see the Supported Geographic Fields section.
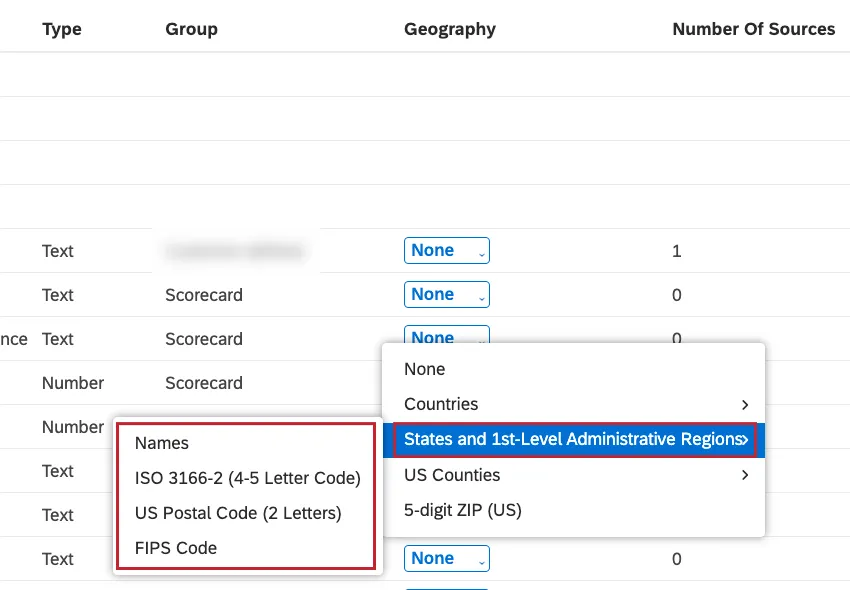
- States and 1st-Level Administrative Regions: Select this if the grouping contains state- and province-level data and then choose the format in which the values are provided.
For more information, see the Supported Geographic Fields section.
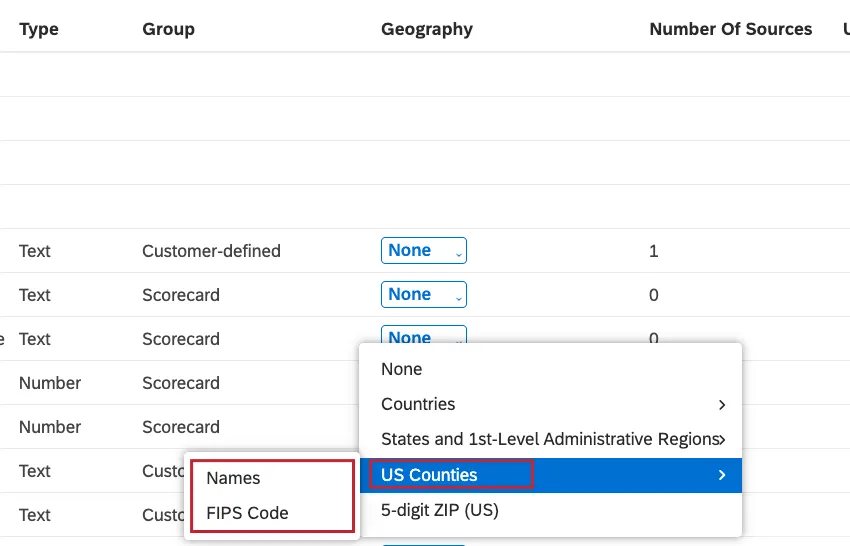
- US Counties: Select this if the grouping contains US county-level data and then choose the format in which the values are provided. For more information, see the Supported Geographic Fields section.
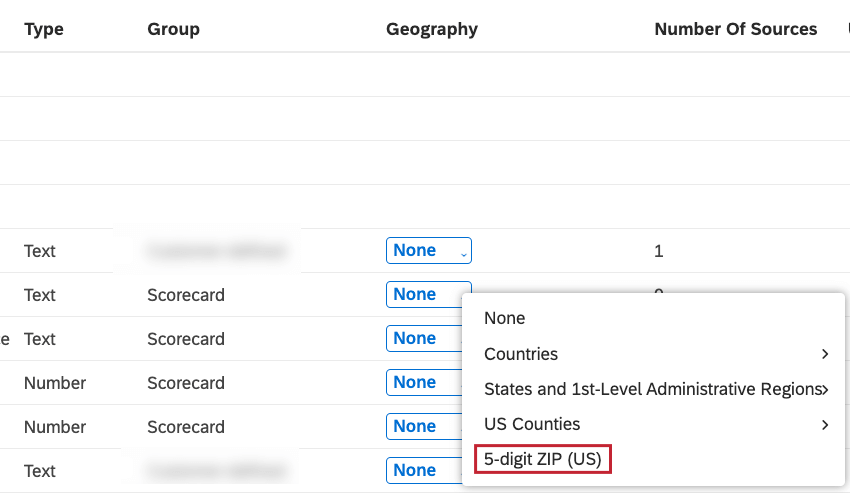
- 5-digit ZIP (US): Select this if the grouping contains 5-digit US ZIP codes.


Supported Geographic Fields
Attributes and models marked as geographic can be used to group data in the map widget. Depending on the level of geography, XM Discover supports geographic fields in these formats:
Countries
- Region:
- Worldwide
- Supported Fields:
- Names: Provide commonly recognized country names. For example, for Kenya, any of the following names are acceptable: Kenya, Republic of Kenya, Jamhuri ya Kenya.
- ISO 3166-1 alpha-3 (3 Letter Code): Provide a standardized 3-letter code. For example, MEX for Mexico or JPN for Japan.
- ISO 3166-1 alpha-2 (2 Letter Code): Provide a standardized 2-letter code. For example, MX for Mexico or JP for Japan. Qtip: We recommend using ISO codes as the most reliable way of identifying countries in your data.
States / Provinces
- Region:
- Belgium
- Canada
- France
- Germany
- Italy
- Netherlands
- Spain
- UK
- US
- Supported Fields:
- Names: Provide commonly recognized state or province names. For example, Ohio or Ontario.
- ISO 3166-2 (4 Letter Code): Provide a standardized 4-letter code. For example, US-OH for Ohio or CA-ON for Ontario.
- US Postal Code (2 Letters): Provide a 2-letter state abbreviation. For example, OH for Ohio or VA for Virginia. US only.
- FIPS Code: Provide a FIPS (Federal Information Processing Standards) county code. For example, 40001 for Adair County will identify the state as Oklahoma. US only.
Counties
- Region: US
- Supported Fields:
- Names: Provide commonly recognized county names. For example, Adair County or Dolores County.
- FIPS Code: Provide a FIPS (Federal Information Processing Standards) county code. For example, 40001 for Adair County or 08033 for Dolores County.
Postal Code
- Region: US
- Supported Fields:
- Provide a 5-digit ZIP code: For example, 05601 for Montpelier, Vermont.
Qtip: For ISO codes, refer to the organization’s Online Browsing Platform. For US postal codes, refer to the United States Postal Service website. For FIPS county codes, refer to the Environmental Research Divisions Data Access Program’s FIPS county converter.
Adding a Map Widget
Qtip: To present XM data on a map, you first need to mark groupings as geographic.
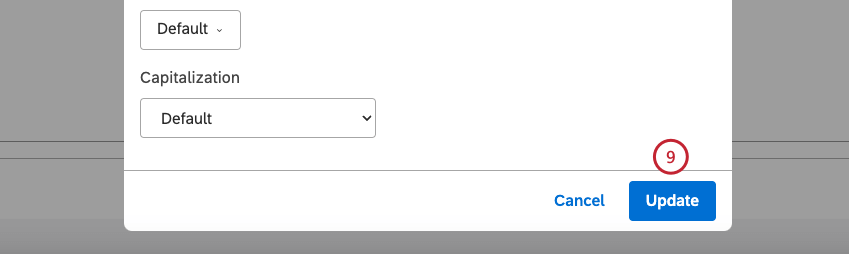
Qtip: Click Ok at the bottom-right of each of the Properties, Visualization and Filters tabs to apply the settings in each of these tabs, and then click Save at the top of the dashboard.
Properties Tab
You can edit map widget properties in the Properties tab. For information about adding a widget, see Adding a Widget.
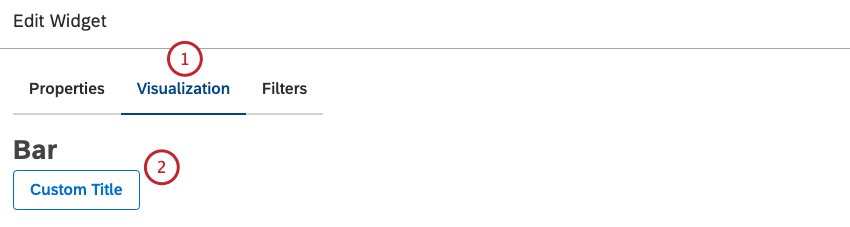
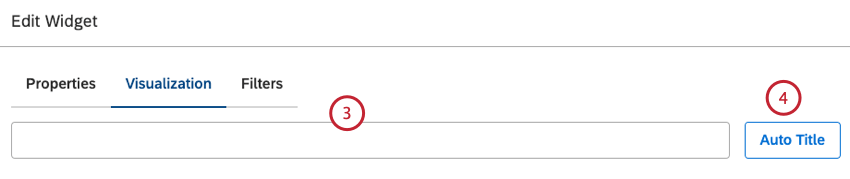
Visualization Tab
You can define report settings in the Visualization tab.
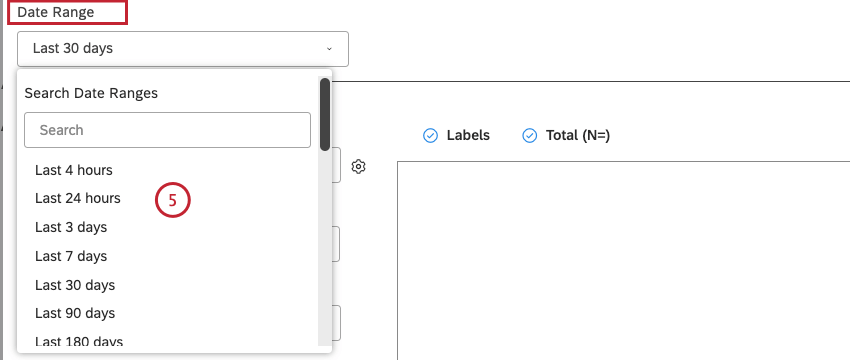
Qtip: Unless you set your widget to ignore the dashboard date range, the dashboard date range replaces the date range defined here.
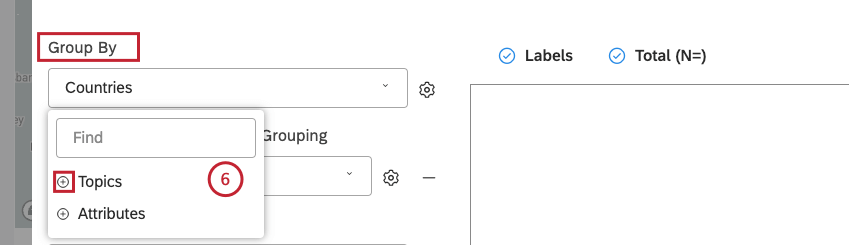
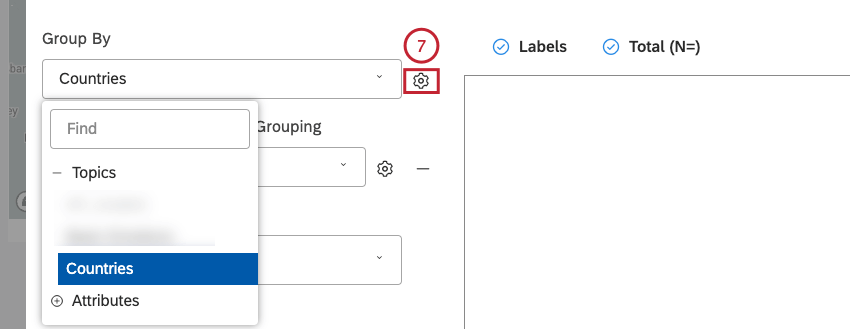
- Topics
- Attributes
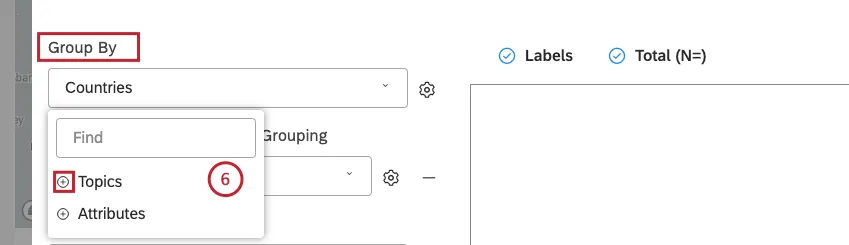 Qtip: You need to have at least 1 appropriate grouping in your data marked as geographic.Qtip: Click the plus ( + ) icon to view more options.
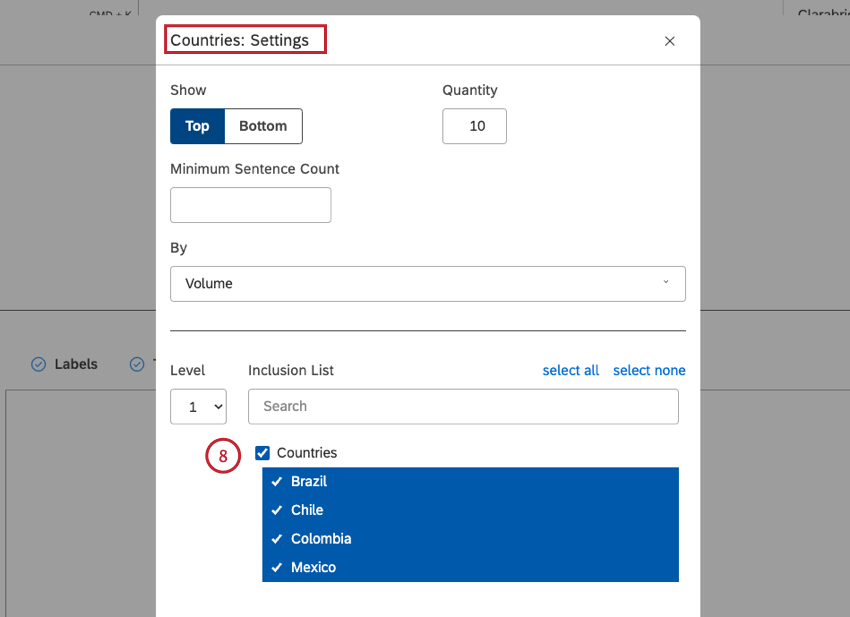
Qtip: By default, Studio shows the following number of groupings for each of the supported geographic levels:
- Countries: 200
- States / Provinces: 55
- US Countries: 1,000
- 5-digit ZIP (US): 500 Qtip: The upper limit for the primary grouping is 1,000 items. For an overview of available grouping settings, see Grouping Settings.
- Topics
- NLP
- Attributes
- Derived Attributes
- Metrics
- Organization Hierarchy
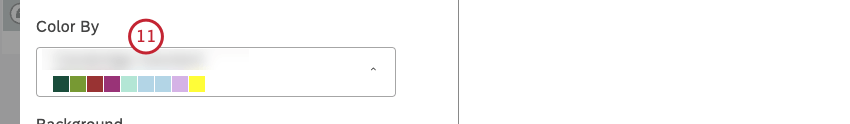
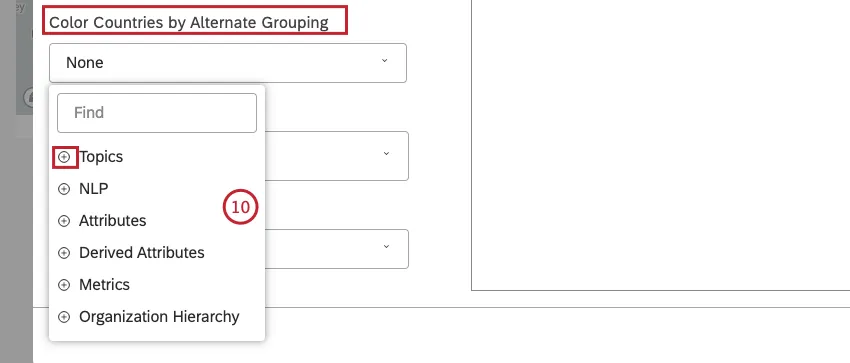 Qtip: Click the plus ( + ) icon to view more options.Qtip: You can show patterns of mentions: for example, color each state by the most popular topic or product. You can also color by a parent geography: for example, color countries by sales region.Qtip: When using the map widget as a filter for other widgets, its children are only filtered by the geographic object selected. Secondary groupings are ignored.

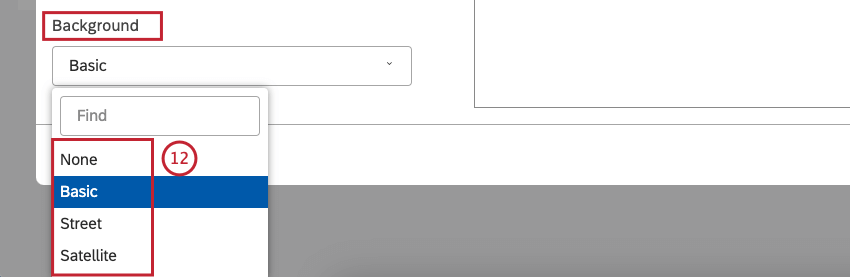
- None: To display map objects as simple outlines.
- Basic: To display map objects with topographic information.
- Street: To display map objects with topographic and street information.
- Satellite: To display map objects in satellite view.

- Labels to show background map labels like country or state names. Deselect Labels to hide these labels.
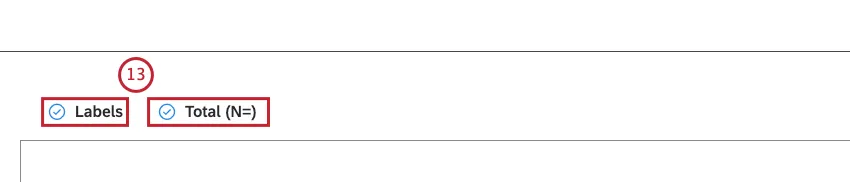
- Total (N=) to show the total number of documents that match report conditions and filters (optional). Deselect Total (N=) to hide this total. For more information on document volume, see Displaying Total Volume on Widgets (Studio). Qtip: To set the default dashboard-wide value for new widgets, use the n= setting in dashboard properties.Qtip: Legends and tooltips for geographic shapes are not supported. However, you can use additional widgets as legends: for example, add a button selector. For more context, use the Widget as Filter feature.

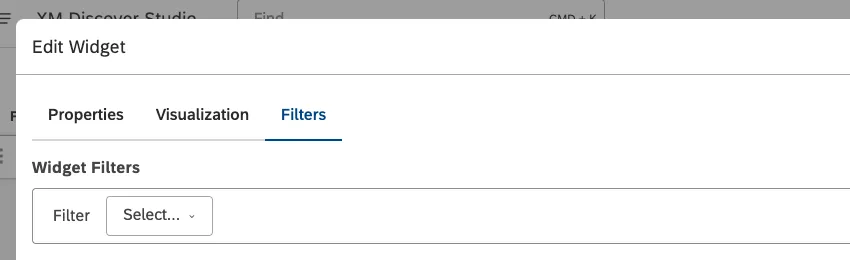
Filters Tab
In the Filters tab, you can further narrow down report data. For information on widget filters properties, please see Applying Filters to a Widget.
That's great! Thank you for your feedback!
Thank you for your feedback!