
Dashboard Data (CX)
What's on this page
About Dashboard Data (CX)
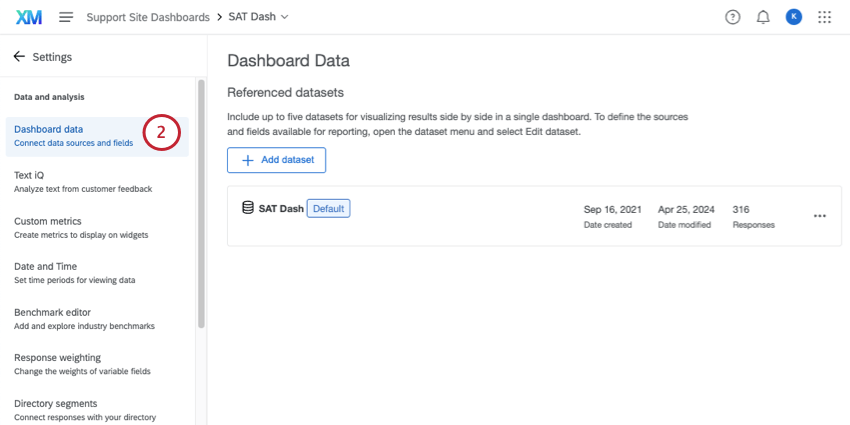
The Dashboard Data tab consists of all the fields (questions and metadata) available in your dashboard. It tells the dashboard what format these fields should be in so that they are compatible with the correct widgets. This is also where you can add additional sources to include in your dashboard.
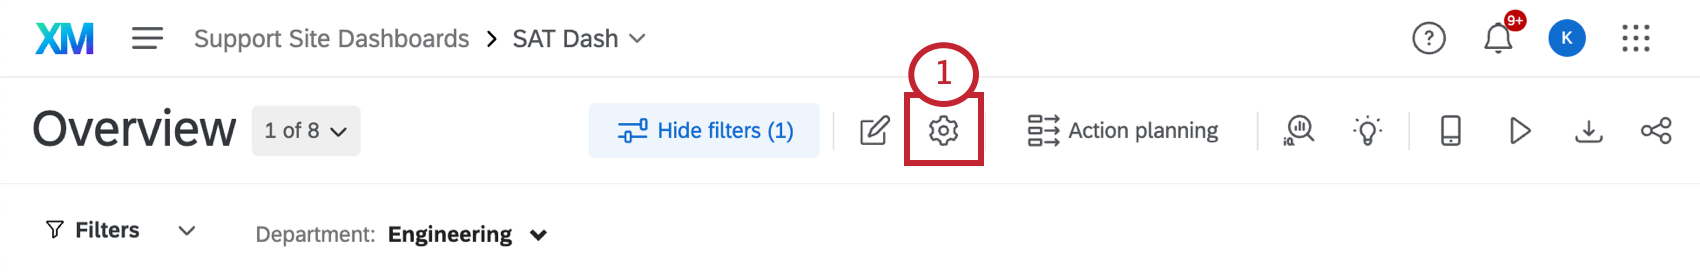
Once you open your dashboard, you can access Dashboard Data by doing the following:
Types of Dashboards Supported
This support page only covers how Dashboard Data works for the following types of dashboards:
- Dashboards projects (also known as CX Dashboards)
- Dashboards added to programs
- Dashboards built into certain XM Solutions
- Brand Experience
This feature cannot be used with any Employee Experience dashboards or with Results Dashboards. For a similar Employee Experience feature, see Dashboard Data (EX).
Key Terms
- Dataset: A collection of data sources that are available for you to report on in your dashboard. You can find all of the datasets you have access to on the Data page.
- Data source: Where the data in your dataset comes from. This can be surveys, data you imported to Qualtrics, tickets, directories, or other external sources.
- Field: Each individual question, survey metadata, embedded data, or data column is its own individual field. “Values” refers to the data in the field. E.g., “age” can be a field, and the individual ages are the values of that field.
- Data mapper: The easiest and most common way to format your dashboard dataset. See Data Mapper (CX) for more information.
- Data modeler: A way to create dashboard datasets by combining data from different types of sources (i.e., tickets and surveys together) and perform joins. See Creating a Data Model (CX) for more information.
- Join: Combine rows from 2 or more tables based on a related column between them, such as an ID. See Joins for more information.
- Union: Combine multiple data sources together into a single dataset. Rather than combining individual rows of data, as you do in a join, you simply add more rows to the same dataset. See Unions for more information.
Mapping the First Dashboard Dataset
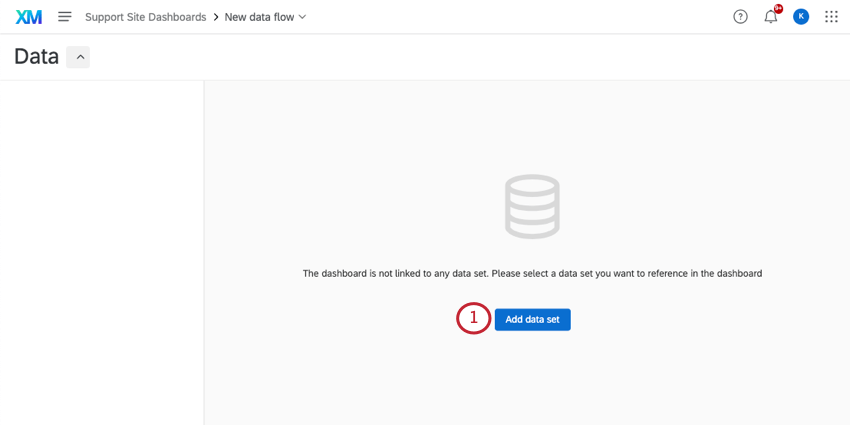
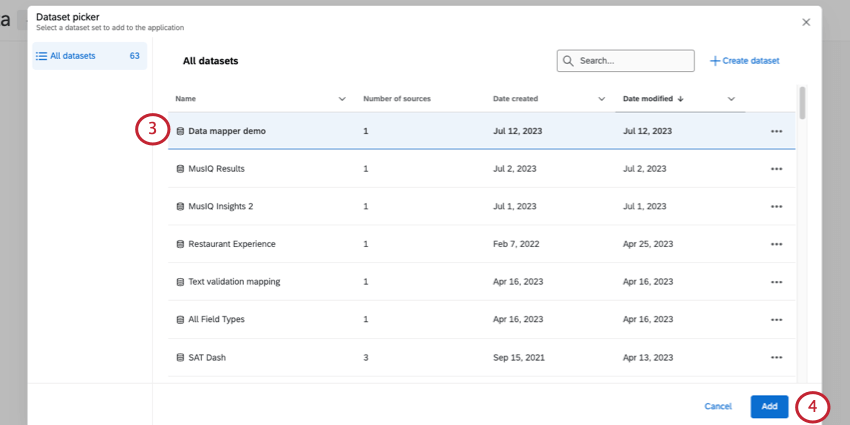
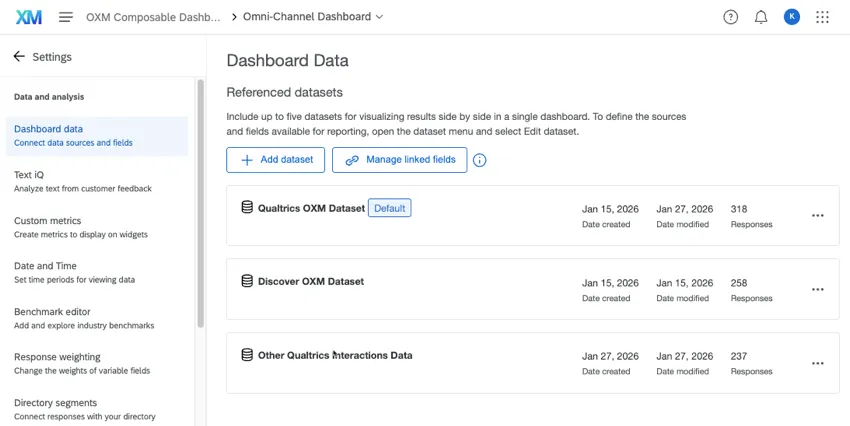
Once you have created your first dashboard, you will be asked to add a dataset. A dataset can contain any source of information, from the surveys or distributions you have in your account, to contact data.
All of the datasets you create or have access to are saved on the Data page so you can edit them or reuse them at any time.
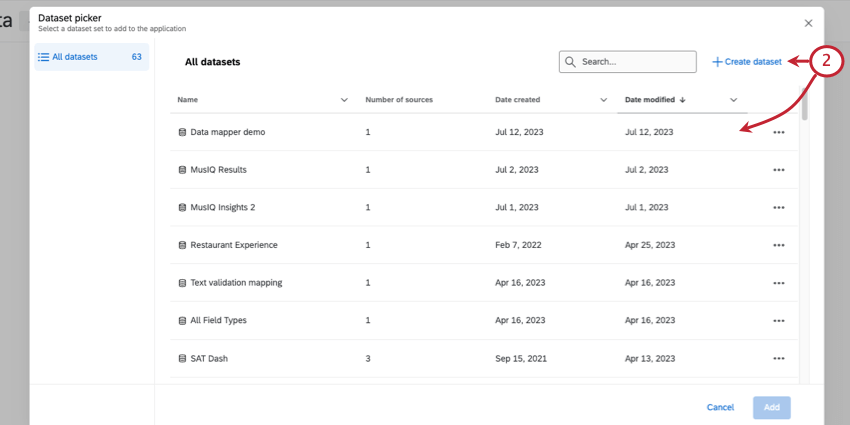
- Click Create dataset to make a new dataset.
- Choose from an existing dataset. Attention: You cannot switch between the data mapper and data modeler in the same dashboard. Once you select a builder type, that is the only type you can use in your dashboard.

Data Mapper vs. Data Modeler
Attention: You cannot switch between the data mapper and data modeler in the same dashboard. Once you select a builder type, that is the only type you can use in that dashboard.
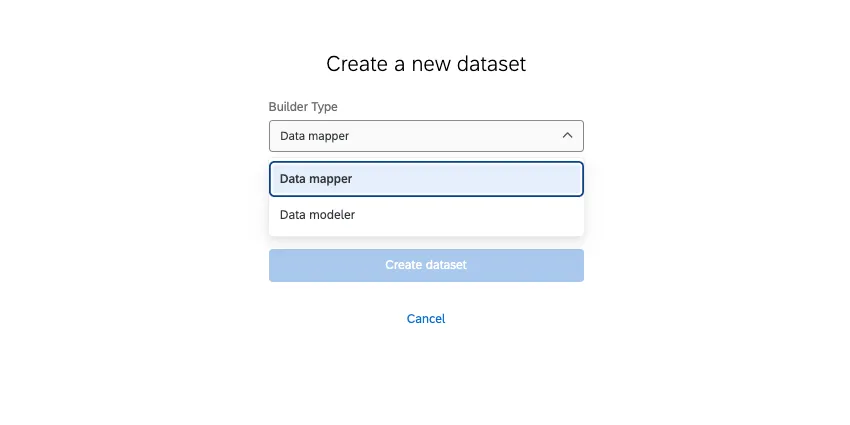
If you choose to create a new dataset, you’ll notice a couple of options under Type: data mapper and data modeler. In this section, we’ll talk about how to choose between these options.
Data Mapper
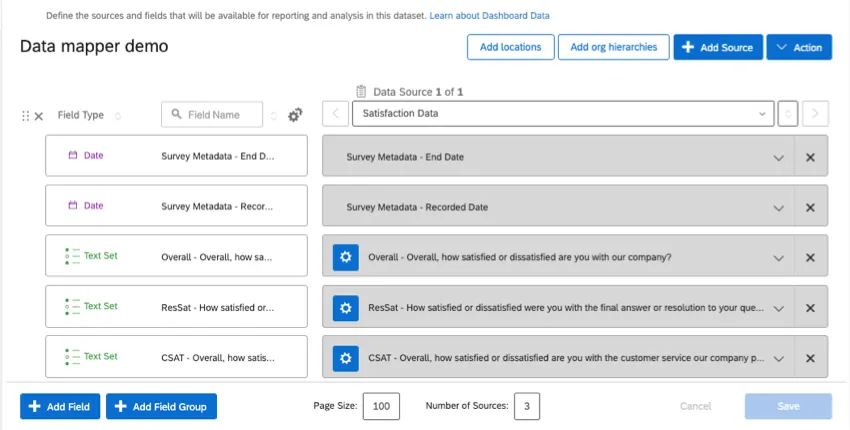
For most dashboards, the data mapper is the best choice. The data mapper is easy to use with many customization options to choose from. Some highlights include:
- Choose the data you want to include in your dashboard.
- Name your fields.
- Format data types (e.g., differentiating between text and numeric data).
- Merge multiple sources to the same field (i.e., if you have 2 years of surveys with the same questions, you can match their fields).
- Assign numeric values to data.
- Format dates.
- Group data together.
- And more!
Here are some resources on the data mapper:
- Data Mapper (CX): A beginner’s guide to the most important data mapper functionality.
- Field Types & Widget Compatibility (CX): Learn what the different field types are and how they work with different widgets.
- Recoding Dashboard Fields (CX): Edit labels and numeric data values.
- Date Field Format (CX): Format date fields.
- Field Groups (CX): Group related fields together for more versatile reporting options.
- Importing Data as a CX Dashboard Source: Import data from outside of Qualtrics for dashboard reporting.
- Date Time Segmentation (CX): Learn how to report on schedules and weekday information.
Data Modeler
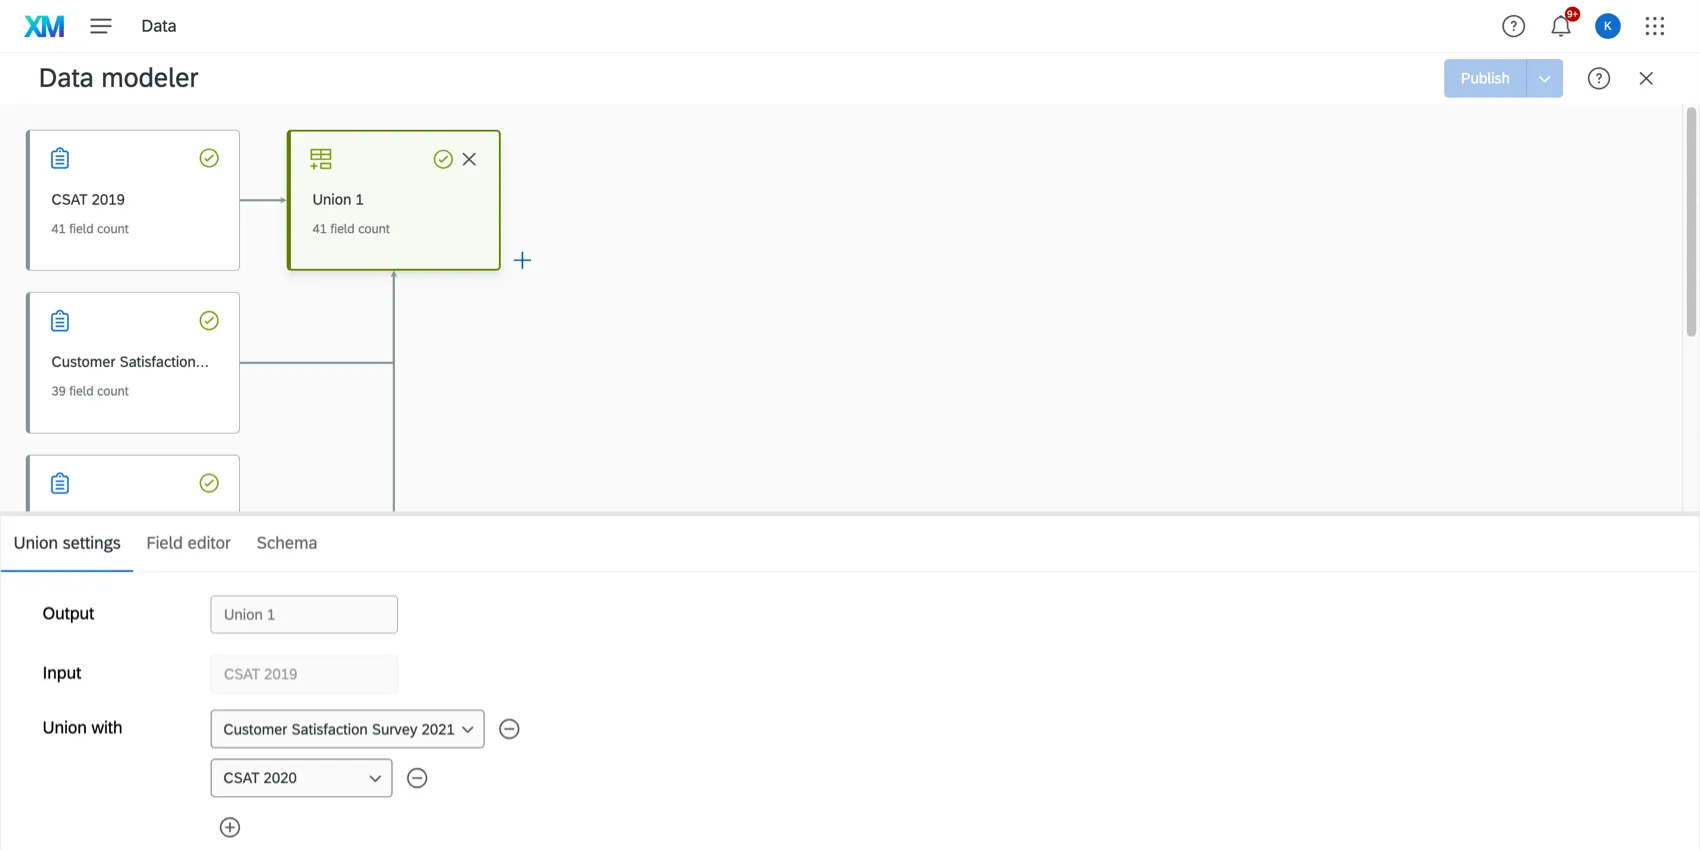
The data modeler can be used to create dashboard datasets by allowing you to flexibly combine data from multiple types of sources. The data modeler has nearly all of the features the data mapper does, but with some additional advanced functionality, such as left outer data joins. The data modeler also makes it easier than ever to map not just survey data, but data from your directory, tickets, and other data sources, while allowing you to combine them in the same dataset.
Here are some resources to get you started:
- Creating a Data Model (CX)
- Joins (CX)
- Unions (CX)
- Recoding Fields in the Data Modeler
- Field Types
- Date Field Format (CX)
- Field Groups (CX)
- Editing a Data Model (CX)
Using Multiple Referenced Datasets
To start with, you should strive to add any data sources you need into the same single dashboard dataset, whether that’s a mapper or modeler.
However, as your experience research programs grow and become more complex, you may already have individual datasets you’ve made that would take time to rebuild into one big dataset. You can resolve this by adding multiple datasets to a single dashboard. Then you’ll be able to have widgets from different datasets presented side by side in the same dashboard, or even show multiple datasets’ results in the same chart. You can even use linked filters that will work regardless of the dataset, creating a seamless experience for your dashboard viewers.
To learn more, see Using Multiple Datasets in a Dashboard (CX).
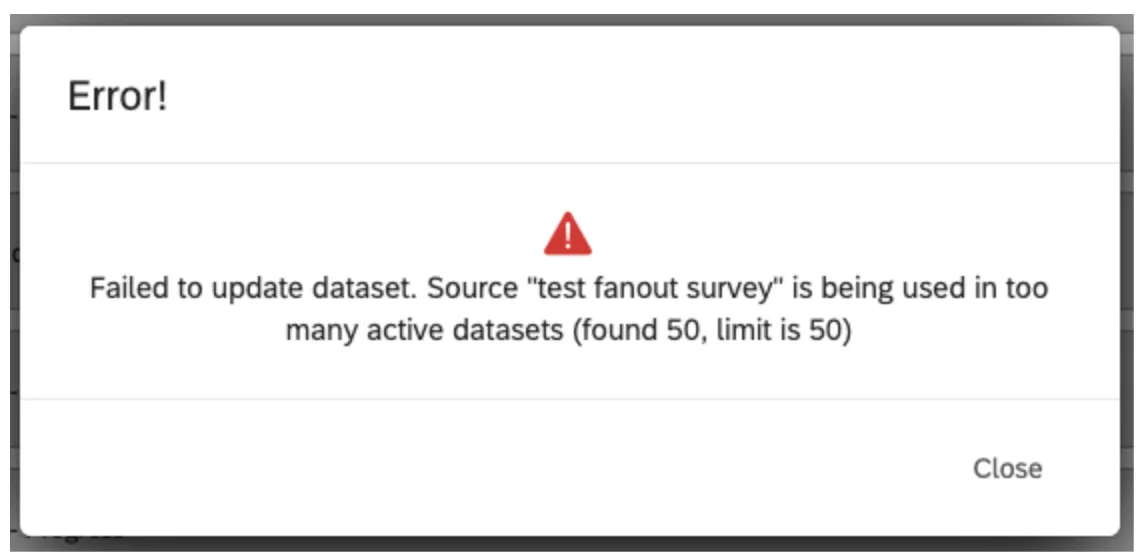
Dataset Utilization Limits
Our data platform imposes a limit on the number of times a single data source (e.g., survey) can be used in active datasets.
- A single data source can only be in 50 active datasets to guarantee timely data processing. This is true regardless of whether the dataset is external or not.
- A single data source can only be on the right side of a join 8 times.
In this case, “dataset” does not just refer to dashboard datasets, but the data source itself, such as the survey’s Data & Analysis content. An active dataset is a dataset that has been accessed within 30 days.
Example: For example, a survey used in 2 dashboards creates 3 active datasets: 1 for Data & Analysis in the survey, 2 for CX Dashboards.
These limits are subject to change over time as our platform and features grow. If your datasource reaches this utilization limit, an error dialog is displayed while adding the source in the data mapper or copying the dashboard.
FAQs
What are text topics and how can I use them in CX Dashboards?
What are text topics and how can I use them in CX Dashboards?
You should use text topics when you need to assign topics based on open-ended text responses from your participants.
Text topics will map automatically to your dashboard as your perform text analysis in the dashboard. See Text iQ in CX Dashboards for more details.
I created a new field in Data & Analysis, but these values aren‘t showing up in CX Dashboards. Where do I find them?
I created a new field in Data & Analysis, but these values aren‘t showing up in CX Dashboards. Where do I find them?
Manual custom fields, Bucketing variables, and Formula variables created in Data & Analysis can all be pulled into CX Dashboards.
Your fields will appear in different places in your Dashboard Data:
Finally, make sure you added the field to your dashboard data.
How many columns / unique fields can my dataset have?
How many columns / unique fields can my dataset have?
Is there a limit to the number of data sources you can add in each dataset?
Is there a limit to the number of data sources you can add in each dataset?
How many dashboard datasets can I create?
How many dashboard datasets can I create?
How many times can I use the same data source in a dashboard dataset?
How many times can I use the same data source in a dashboard dataset?
What’s the difference between data sources and datasets?
What’s the difference between data sources and datasets?
Learn more about these key terms.
That's great! Thank you for your feedback!
Thank you for your feedback!