
Creating Metrics (Studio)
What's on this page
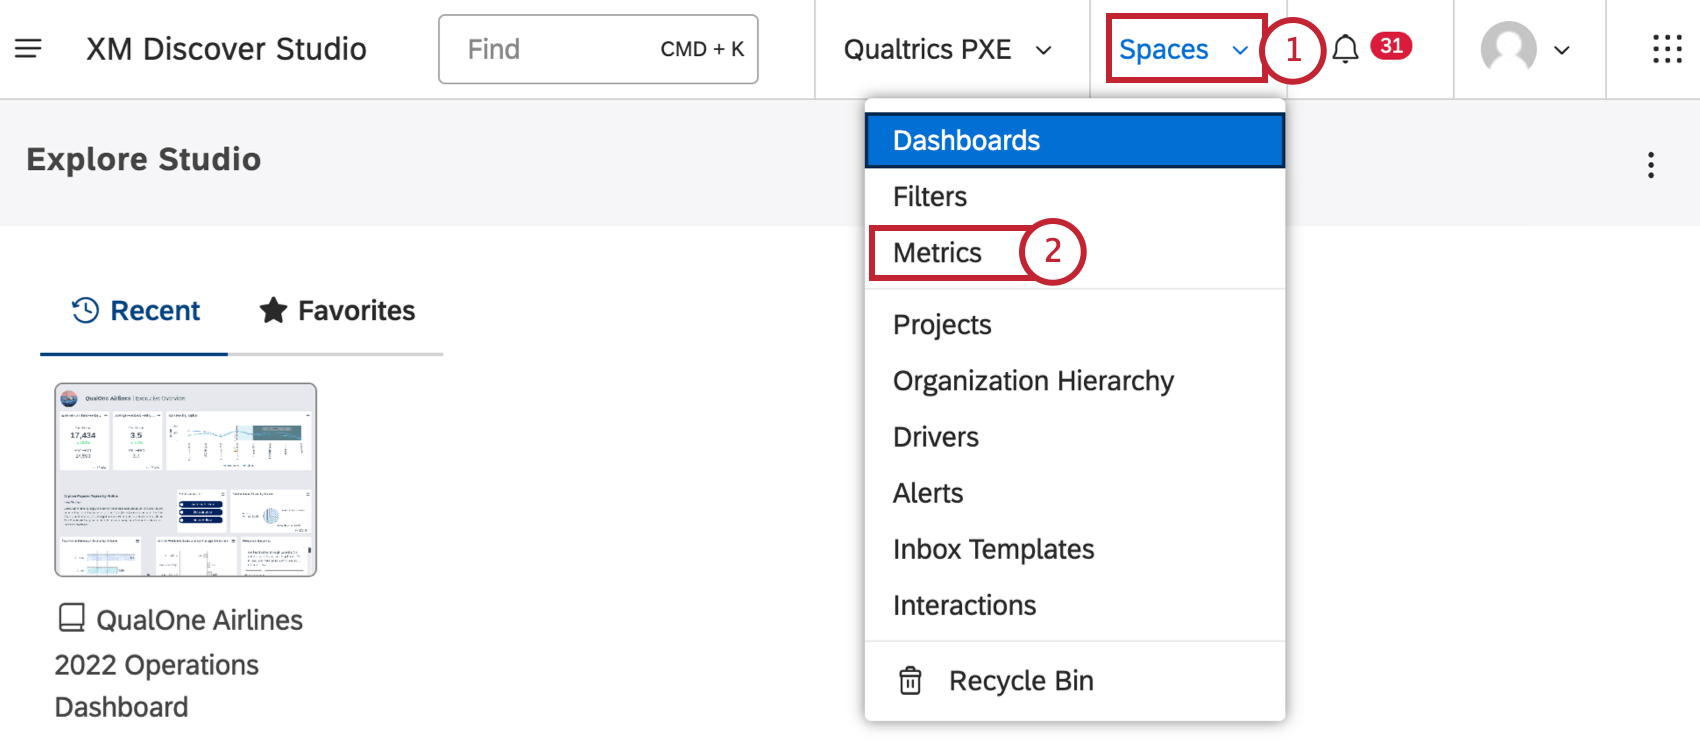
About Metrics
Studio metrics can be used in reporting widgets. You can create your own metrics based on content providers you’re linked to.
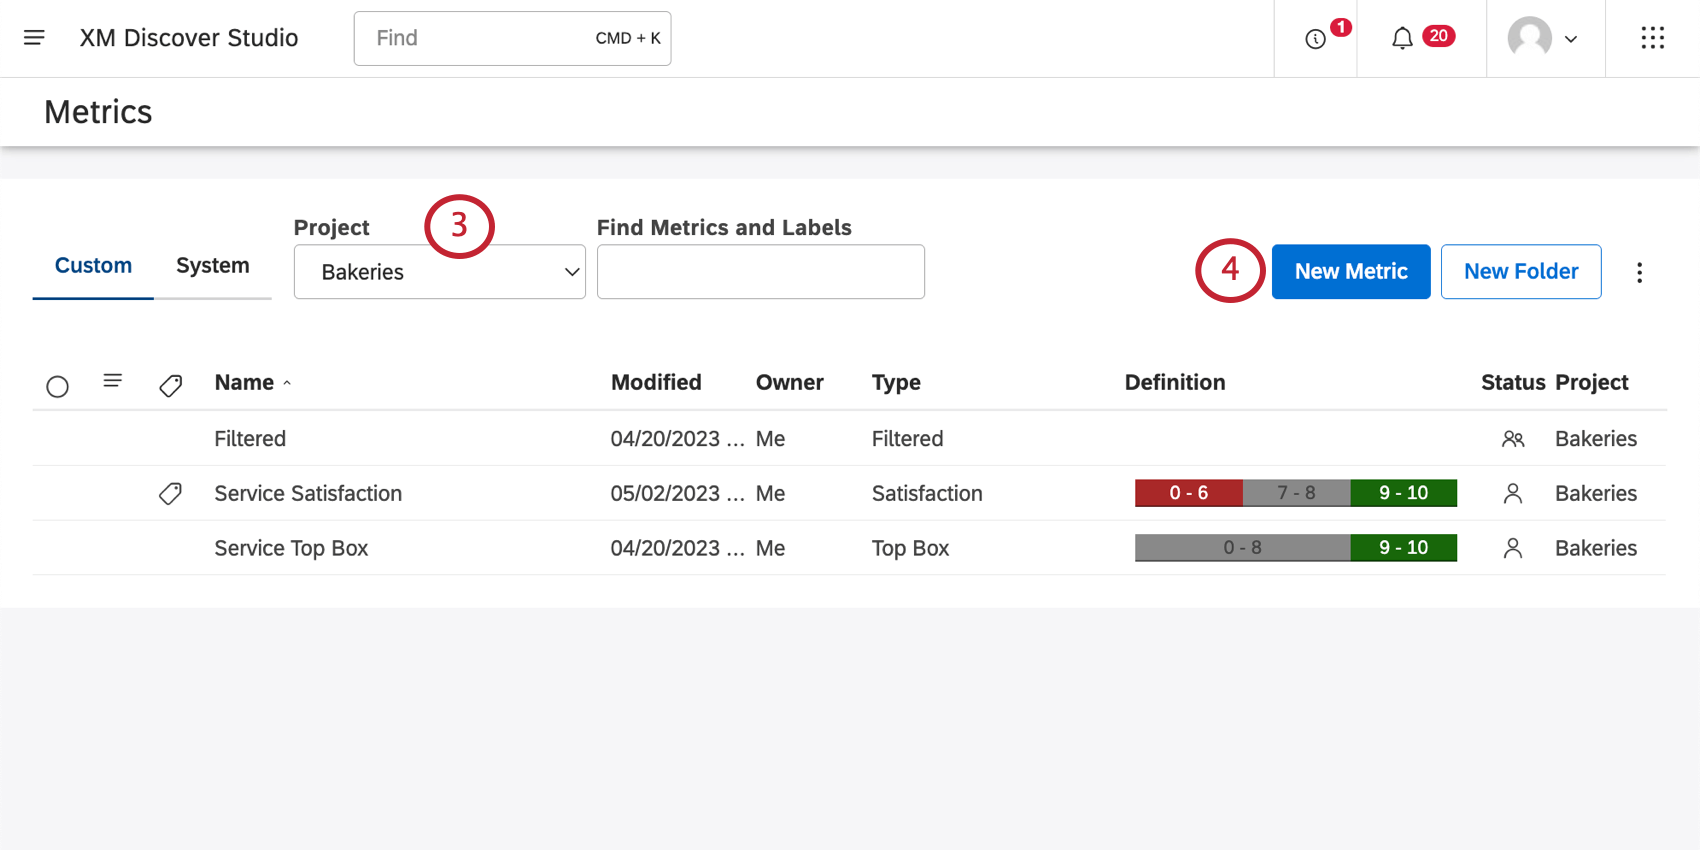
Creating Metrics
The steps needed to create a metric vary based on the type of metric you choose to create. However, there are some steps that most metrics have in common, such as formatting.
Qtip: To do this, you need the Create Metric permission.
Qtip: You may also need to choose an account and a content provider, depending on what you have access to.
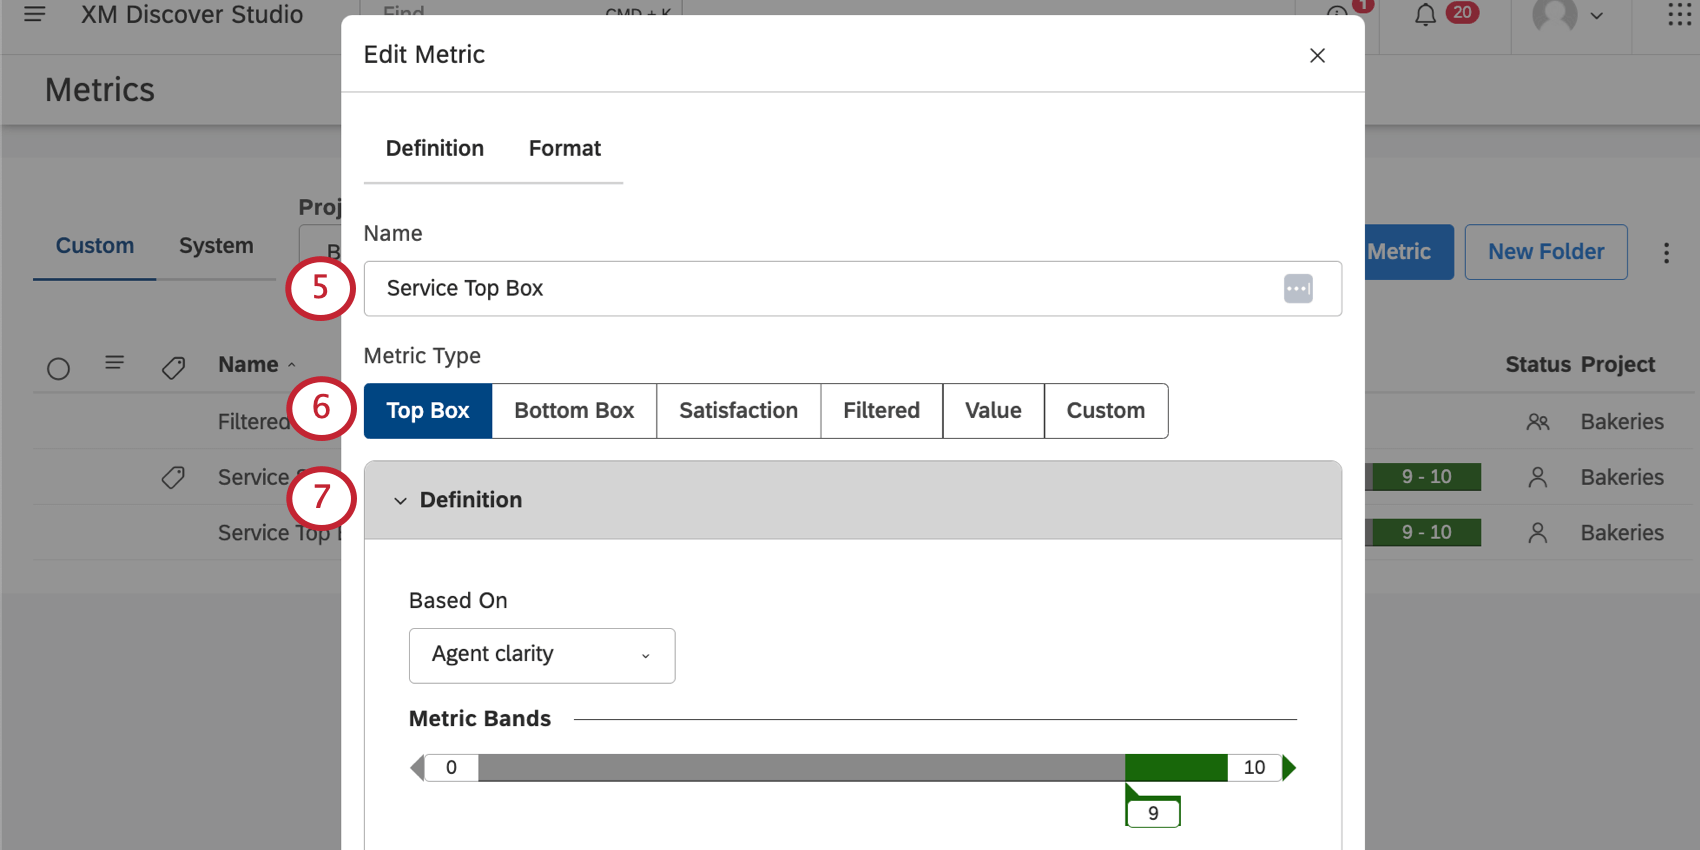
Qtip: Metric names must be unique to all the metrics for each project.
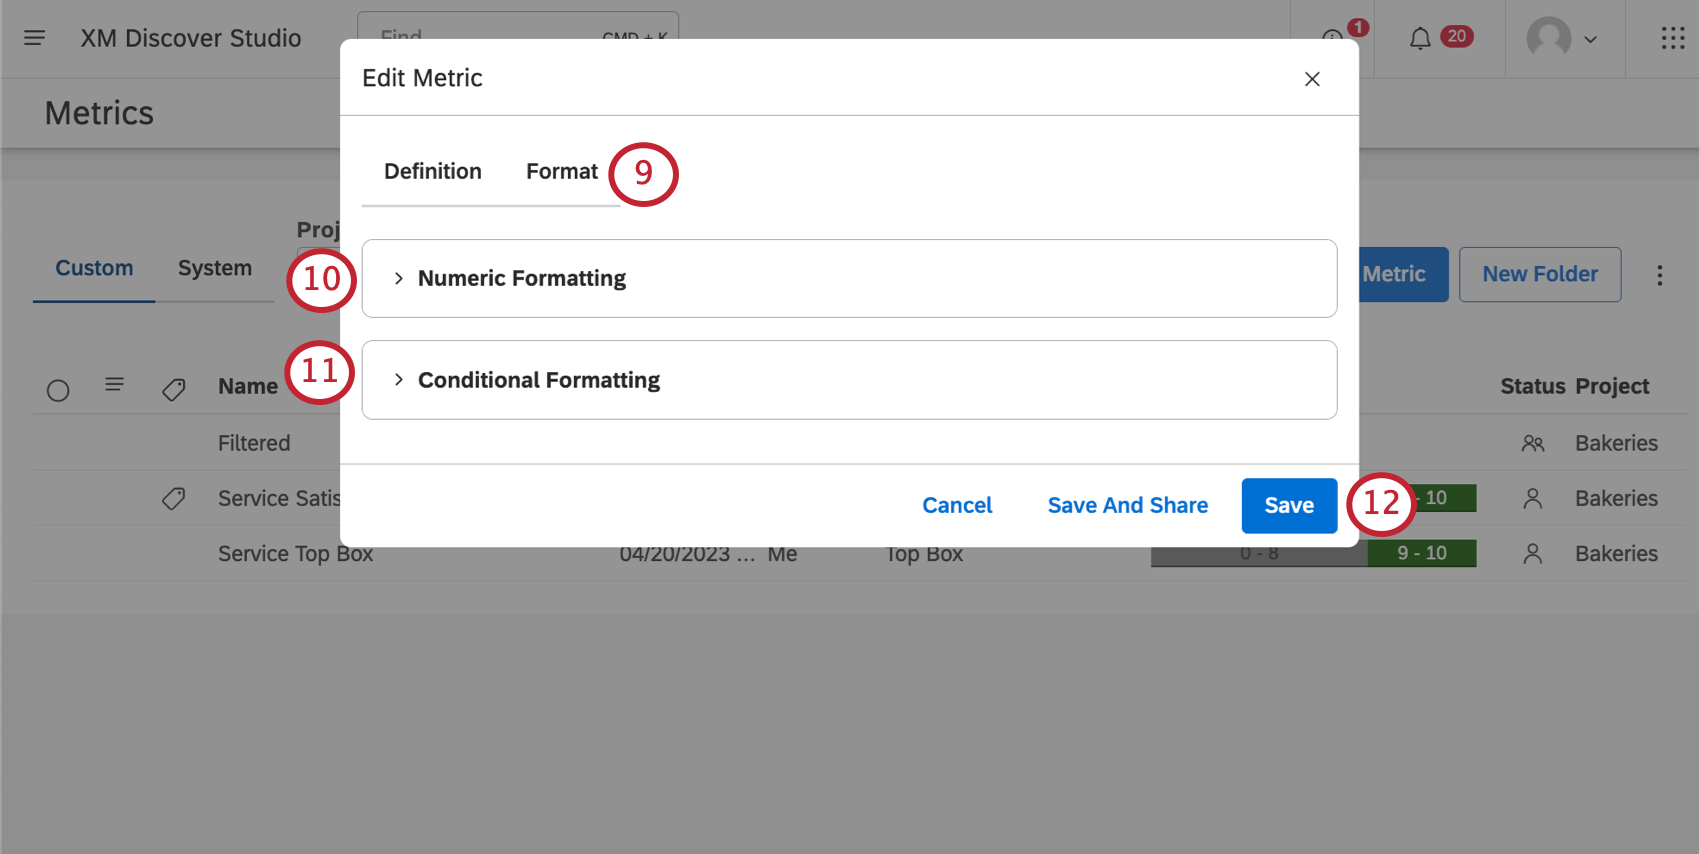
Qtip: Click the arrow next to the title to expand and collapse formatting options.
Qtip: You can also click Save And Share to immediately open the sharing window.
Types of Metrics
Then following is a list of metrics you can create, with instructions on the specific steps needed to define each metric.
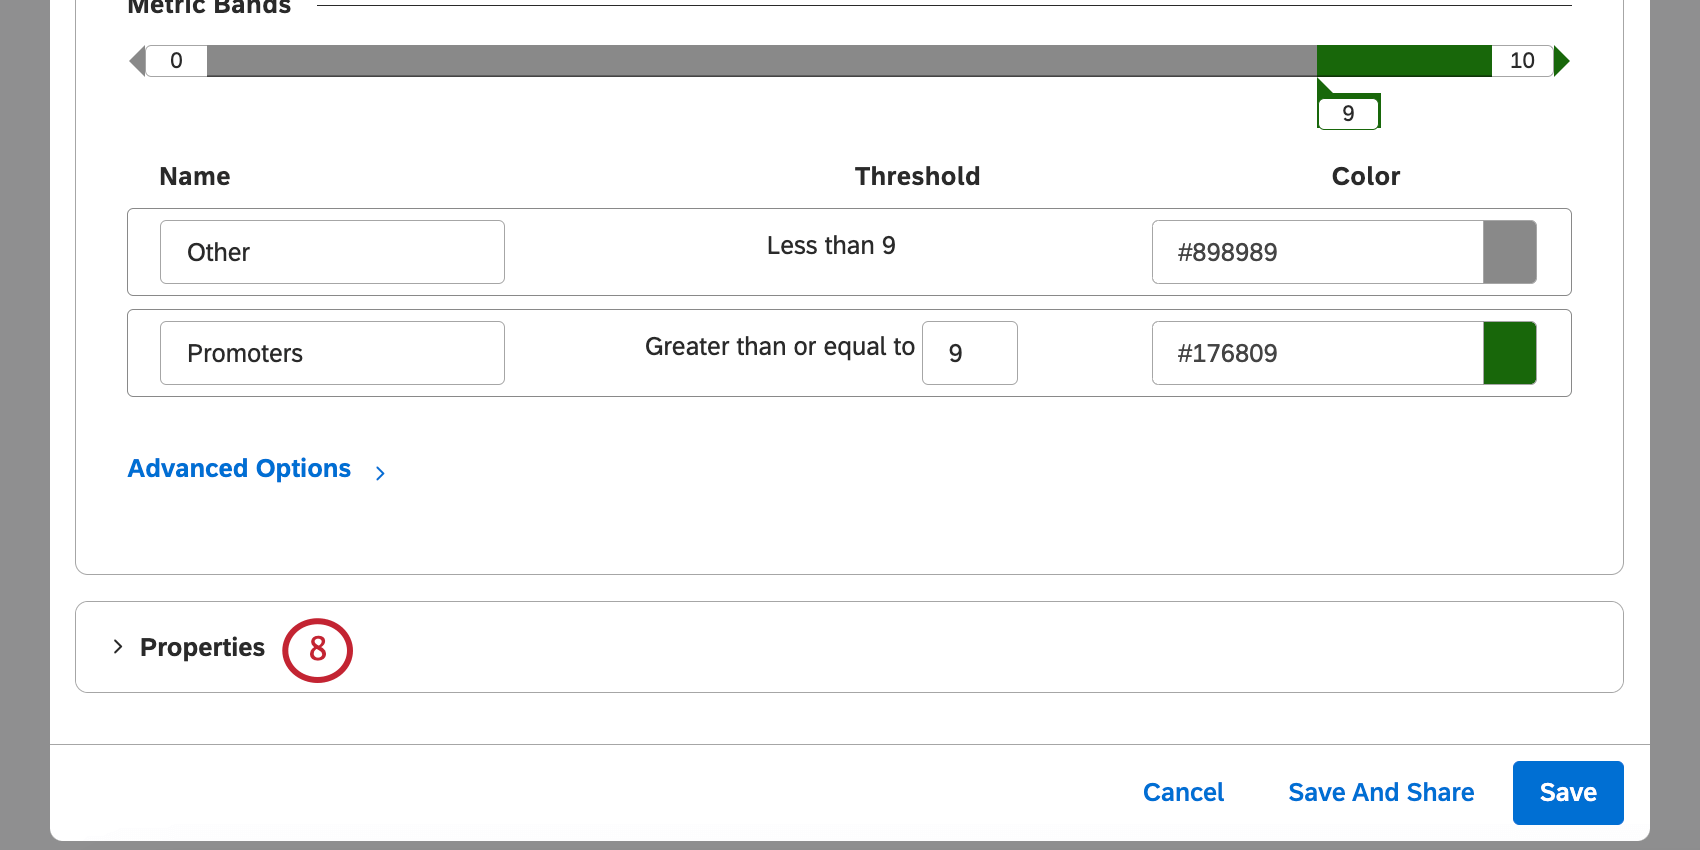
Properties
In the Definition tab, under Properties, you’ll be able to view and adjust additional information for your metric.
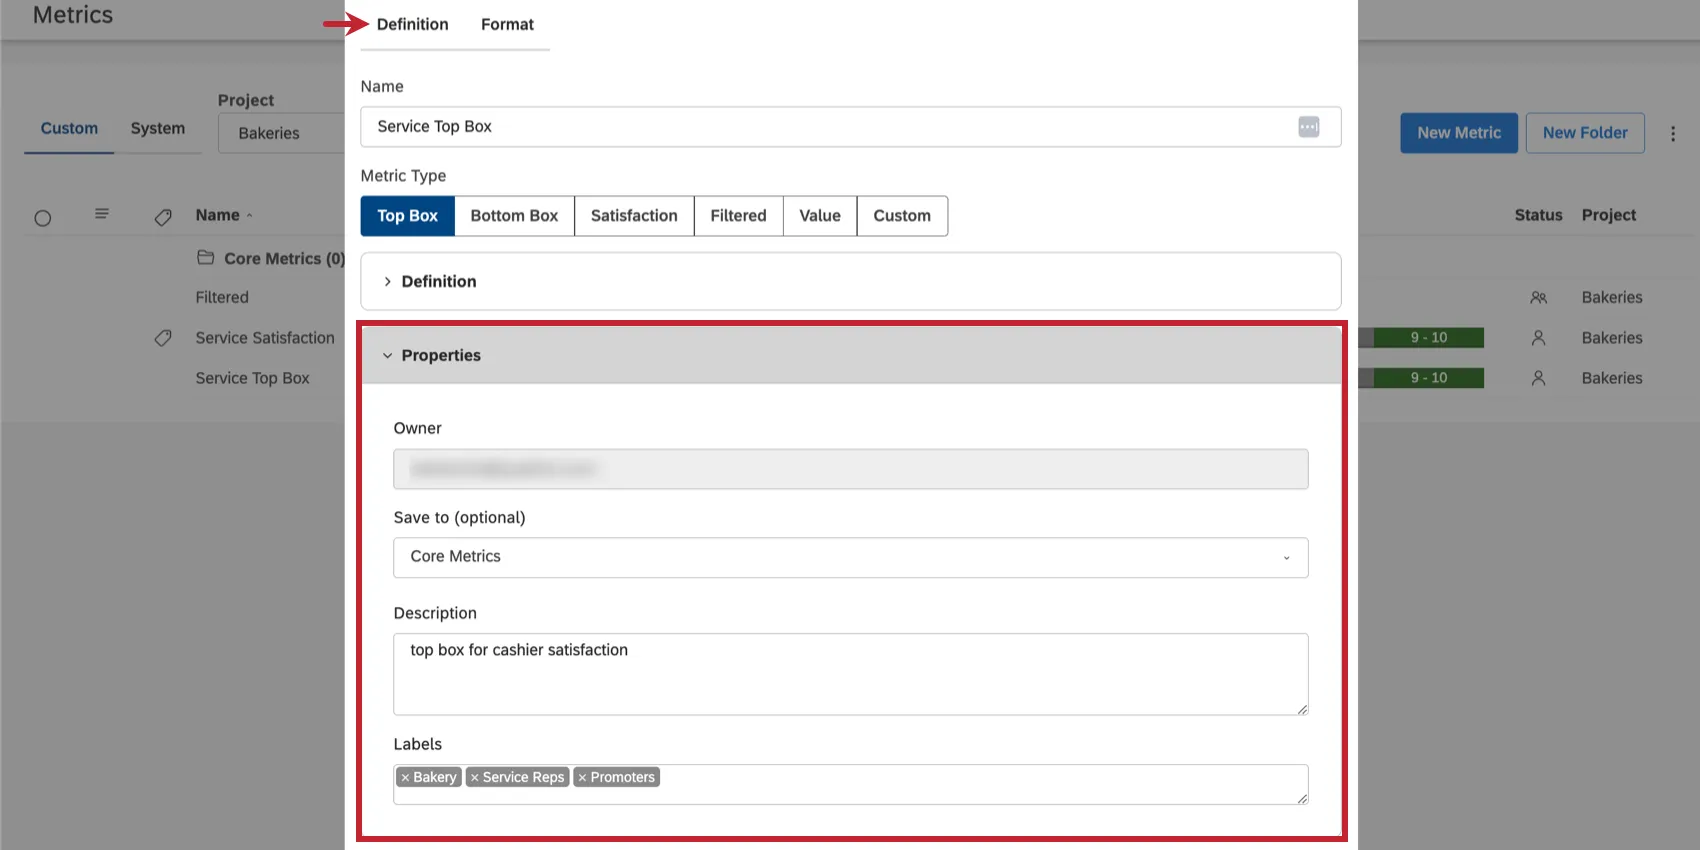
- Owner: The person who owns the metric and has full editing and sharing control over it.
- Save to (optional): Select a folder to save your metric in.
- Description: Add a description for your metric. (Optional)
- Labels: See Labeling Metrics.
Numeric Formatting
In the Format tab, under Numeric Formatting, you can change how numeric data is presented for your metric. As you update the formatting, the Preview will change to reflect your settings.
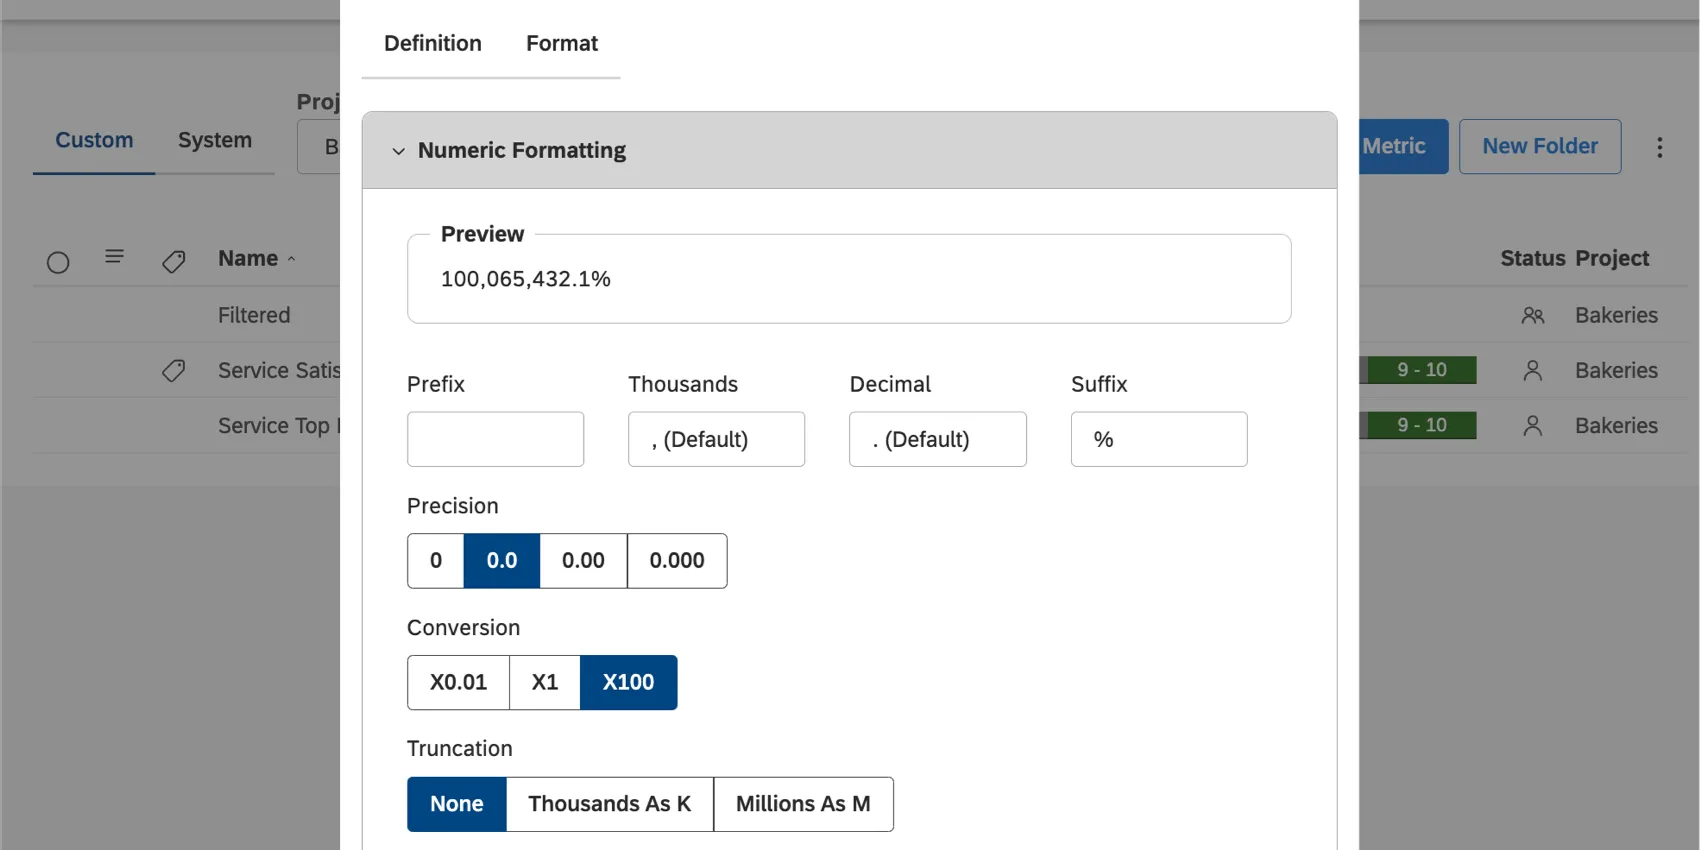
- Prefix: Add a symbol or phrase that should be added in front of the number. You can add up to 10 characters.
Thousands: Specify a thousands separator. You can leave this field empty.

Example: Add a comma ( , ) to display 1000 as 1,000.
- Decimal: Specify a decimal. You cannot leave this field empty.
- Suffix: Add a symbol or phrase that should be added at the end of the number. You can add up to 10 characters. By default, the suffix is set to “%” for top and bottom box metrics.
Precision: Select the number of decimal places to display.

Qtip: Rounding is performed on the original calculation’s value. For example, 3.46 rounded to 1 decimal place is 3.5. If rounded to the nearest whole number, it’s 3, not 4.
- Conversion: Select a conversion.
- 01: Divide the calculation by 100.
- X1: Leave the calculation as is.
- X100: Multiply the calculation by 100. This is the default for top and bottom box metrics.
- Truncation: If you expect your report to contain large numbers, you can choose to abbreviate them so they’re easier to read. For example, if you select Thousands as K option, 555,000 will be displayed as 555K.
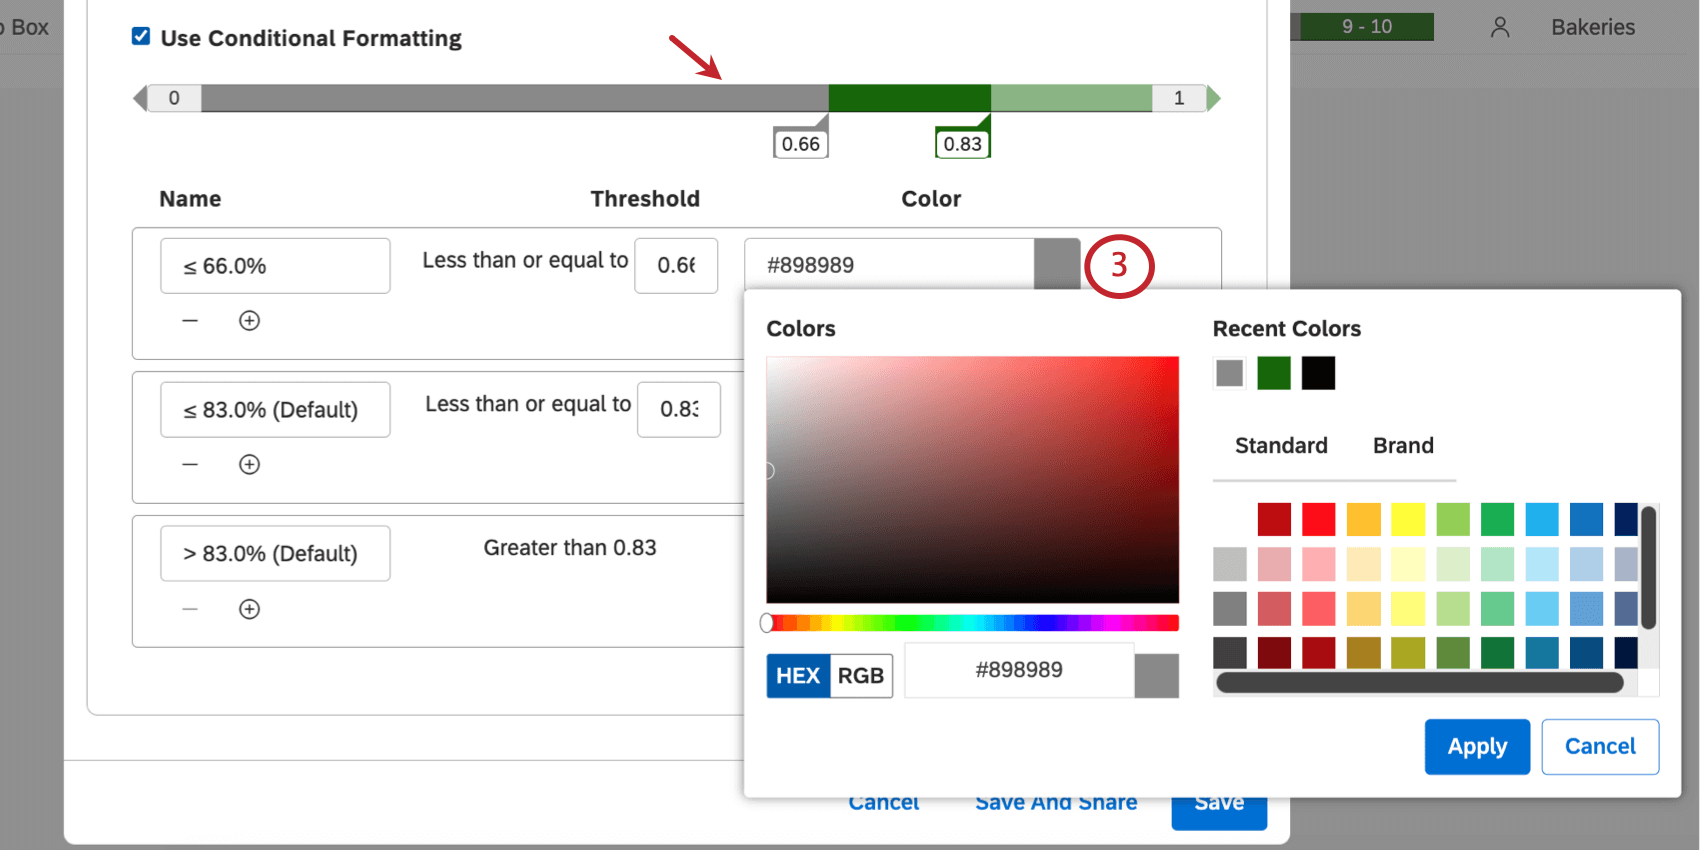
Conditional Formatting
Qtip: Conditional formatting is available for all types of metrics except value metrics.
In the Format tab, under Conditional Formatting, you can define the color bands that will be used when this metric is used in certain reporting.
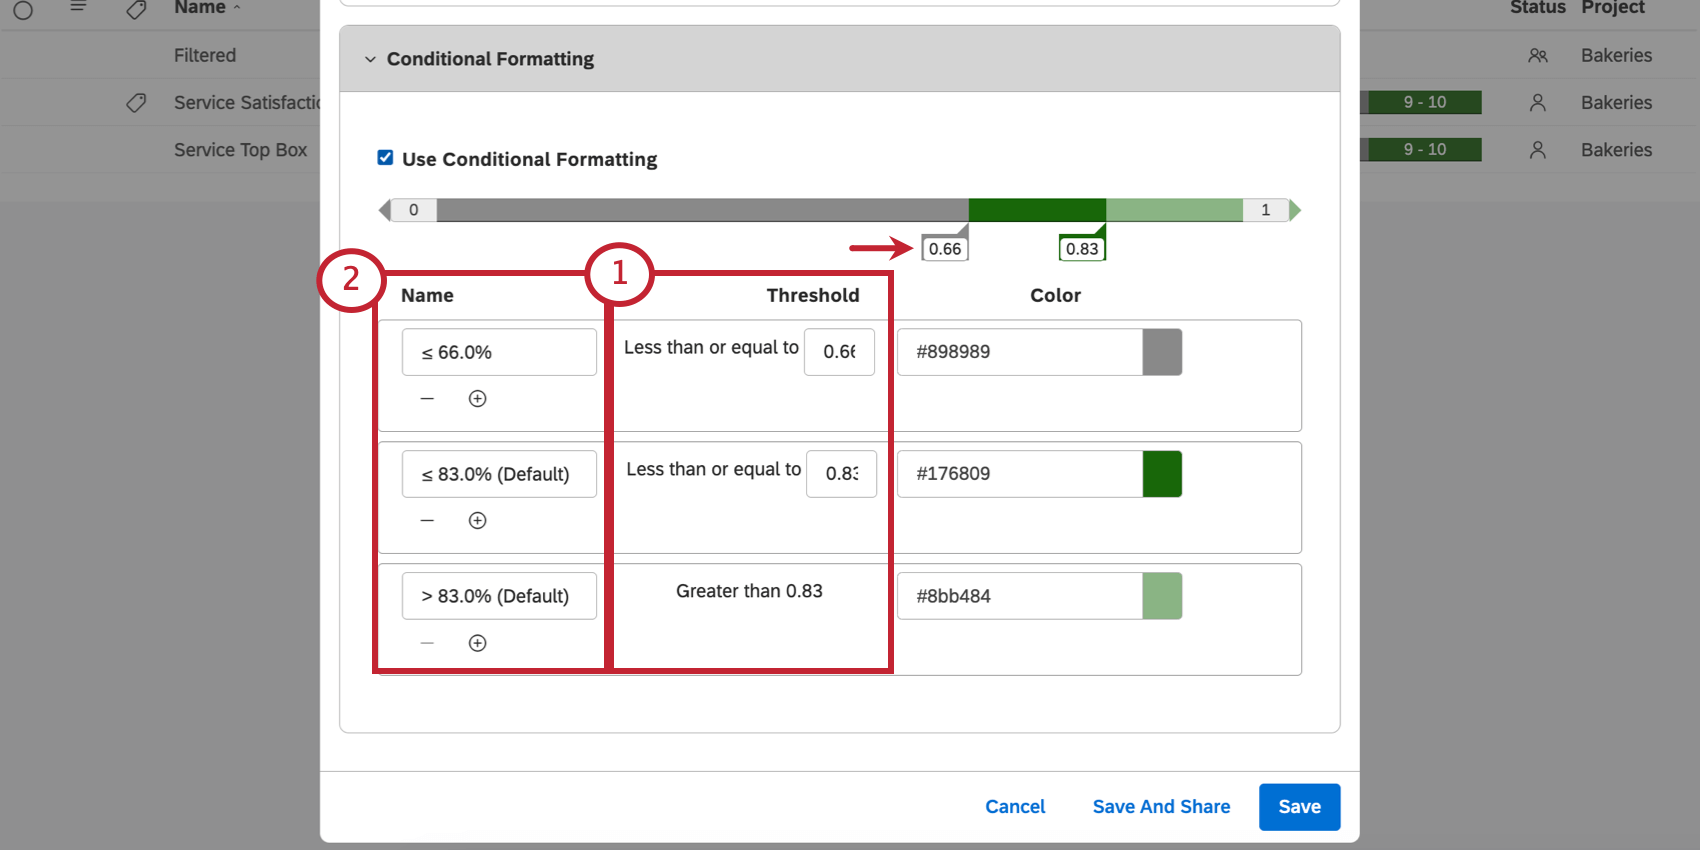
Qtip: You can also adjust the numbers by clicking and editing the numbers on the band itself.
Qtip: Band names do not automatically update as you adjust thresholds.
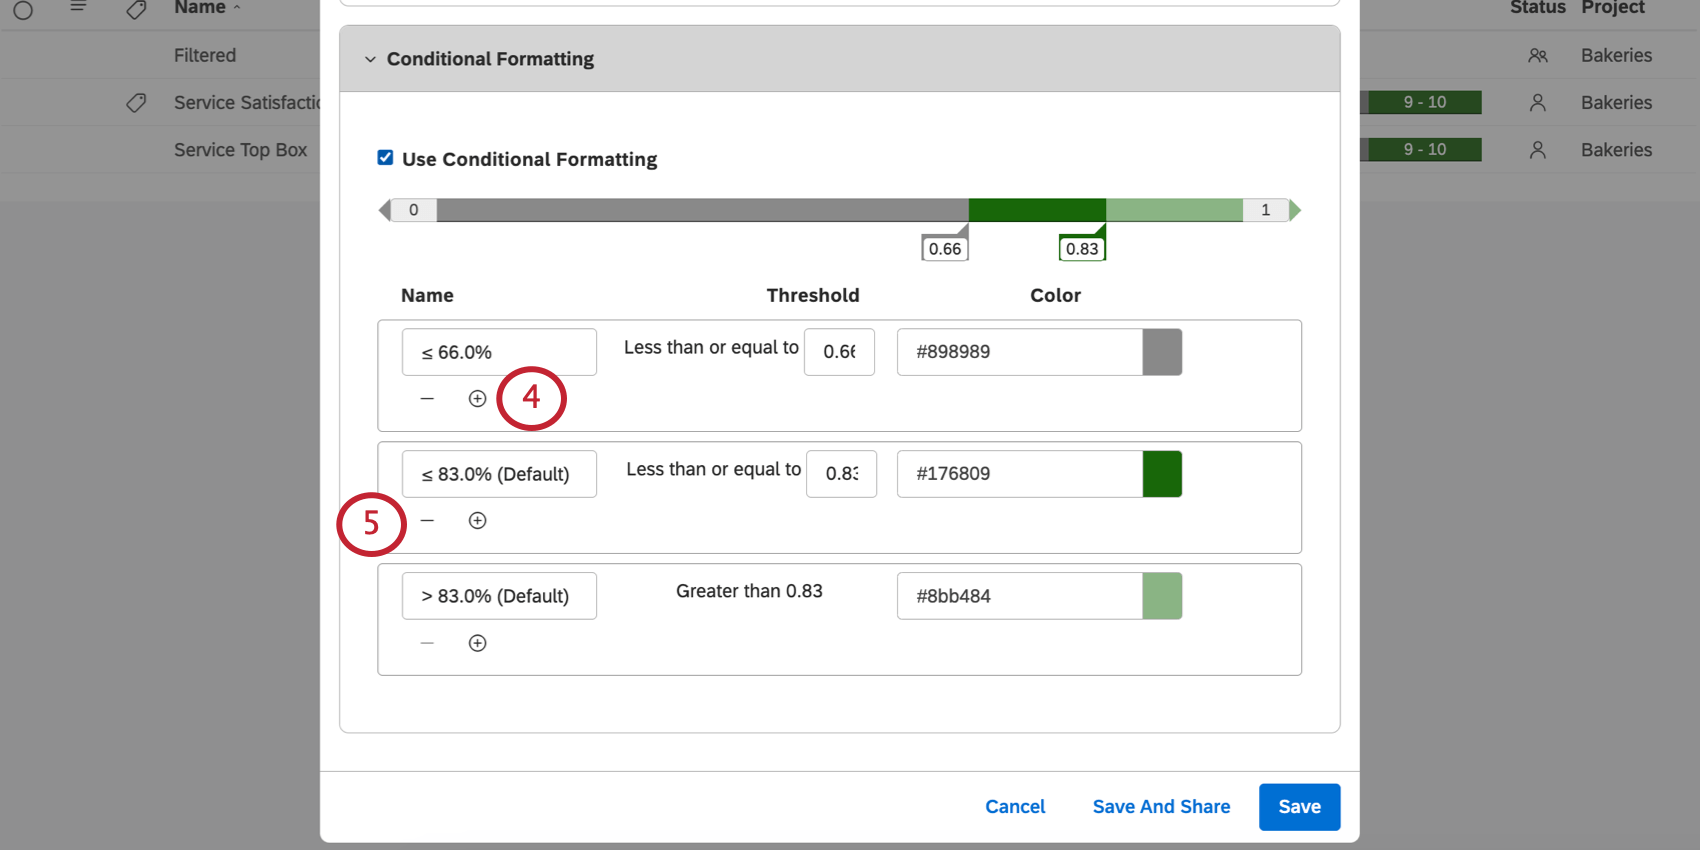
Qtip: You can have a maximum of 5 bands. Most metrics have 2 by default, except satisfaction, which has 3 (detractors, neutrals, and promoters).
Qtip: When a metric is used as a calculation in a widget, widget-level formatting settings will override metric-level settings.
That's great! Thank you for your feedback!
Thank you for your feedback!