
Bottom Box Metrics (Studio)
Suite
Customer Experience
Product
Qualtrics
What's on this page
About Bottom Box Metrics
Bottom box metrics can be used to show the percentage of respondents who gave an unfavorable response in a survey.
Calculation
A bottom box metric is calculated using the following formula:
Bottom Box = Detractors / Total Responses Respondents fall into one of 2 groups: Detractors or Other (Promoters, Neutral). Whether or not a respondent is a detractor depends on a cutoff value that you define.
Example: If you set the detractor cutoff value to 6, respondents who rate your company’s service as 6 or below are considered detractors, and the rest are treated as Other.
Qtip: You can adjust whether undefined values are included in the total when you create your bottom box.
Defining a Bottom Box Metric
This section describes what you need to fill out in the Definition tab of your bottom box.
Qtip: For steps to create and format a metric, see Creating Metrics.
Set the metric type to Bottom Box.
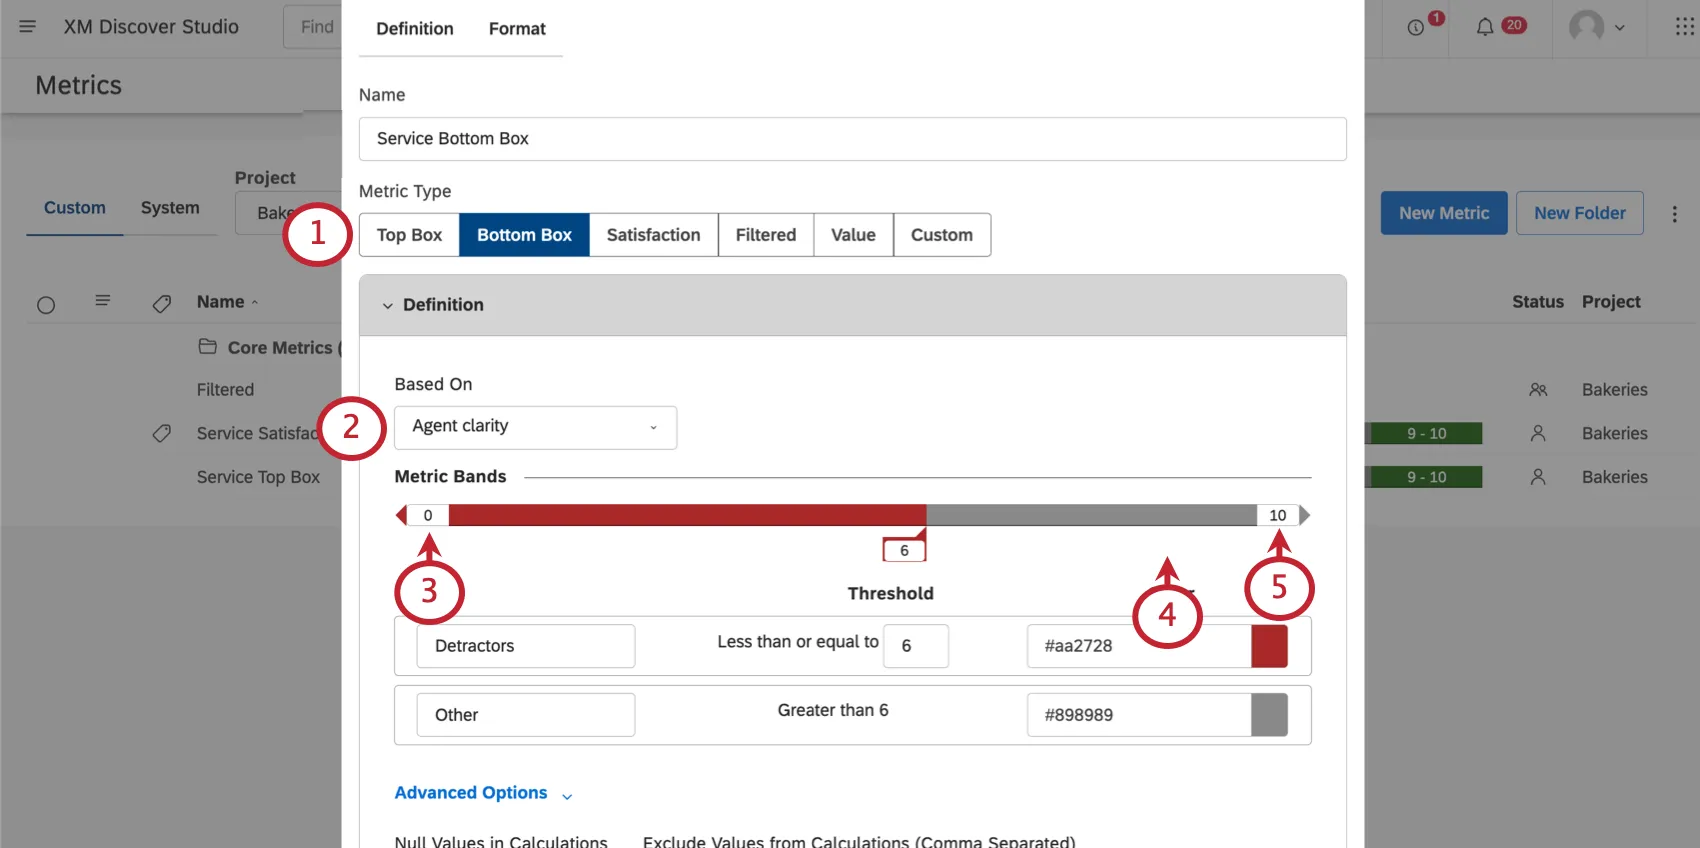
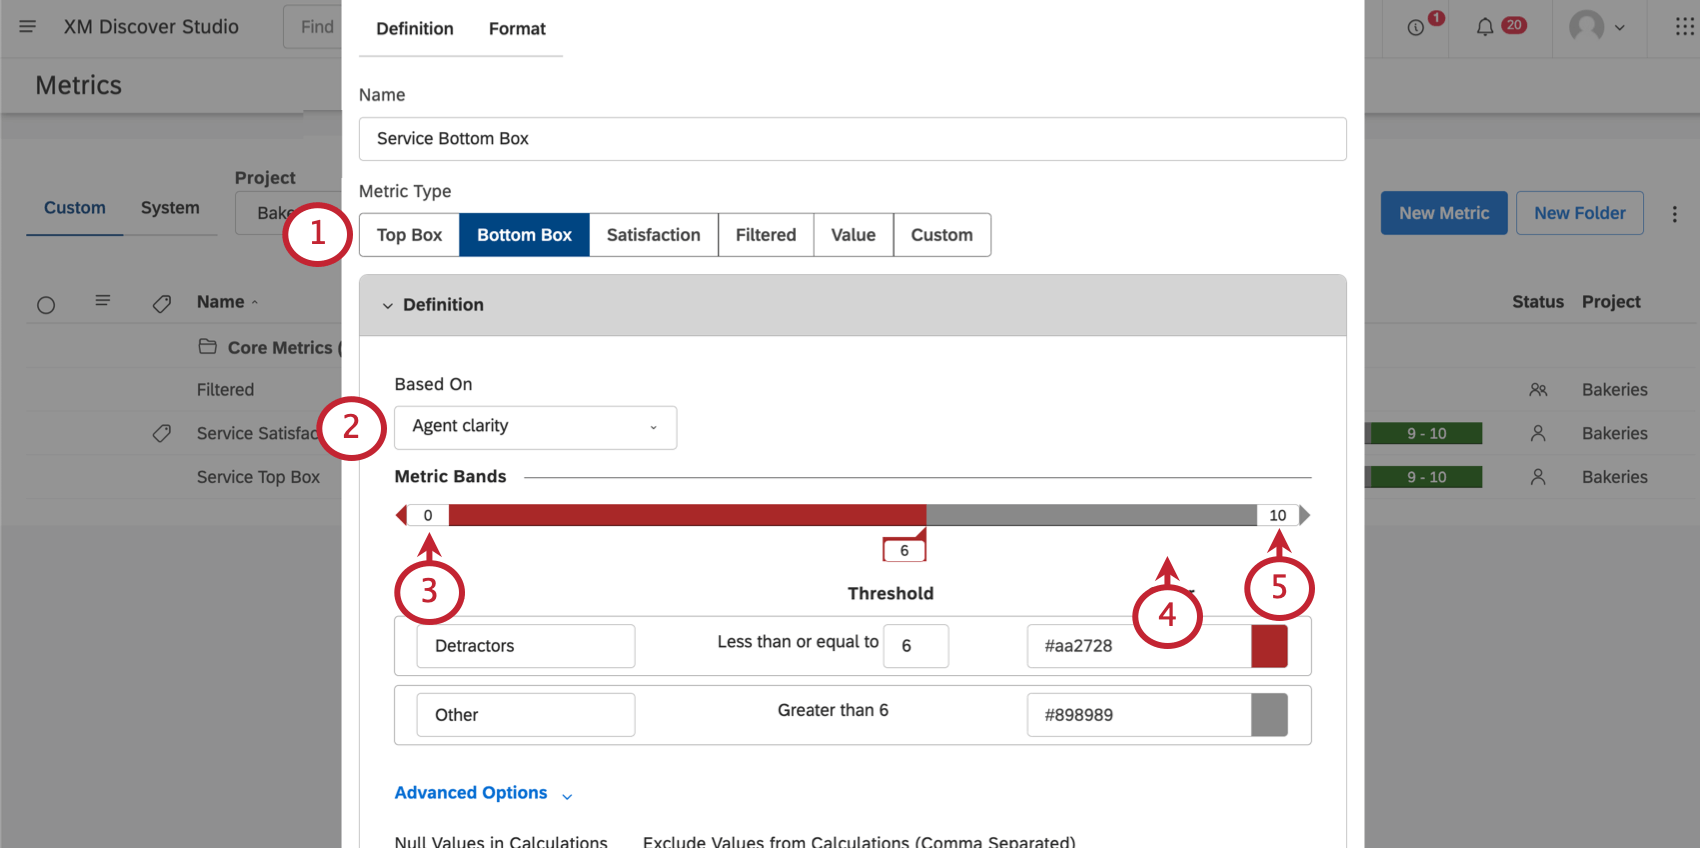
Select the attribute the metric should be based on.
Qtip: You can only select numeric attributes.
Set a minimum value.
Qtip: The minimum and maximum values are used for visual purposes only. For example, if your minimum is 0 and your maximum is 10, a score of –2 is still a detractor, and a score of 77 is still in the other band.
Determine the value that a response must be less than or equal to in order to qualify as a detractor.
Set a maximum value.
Name your groups. By default, these are Other and Detractors.
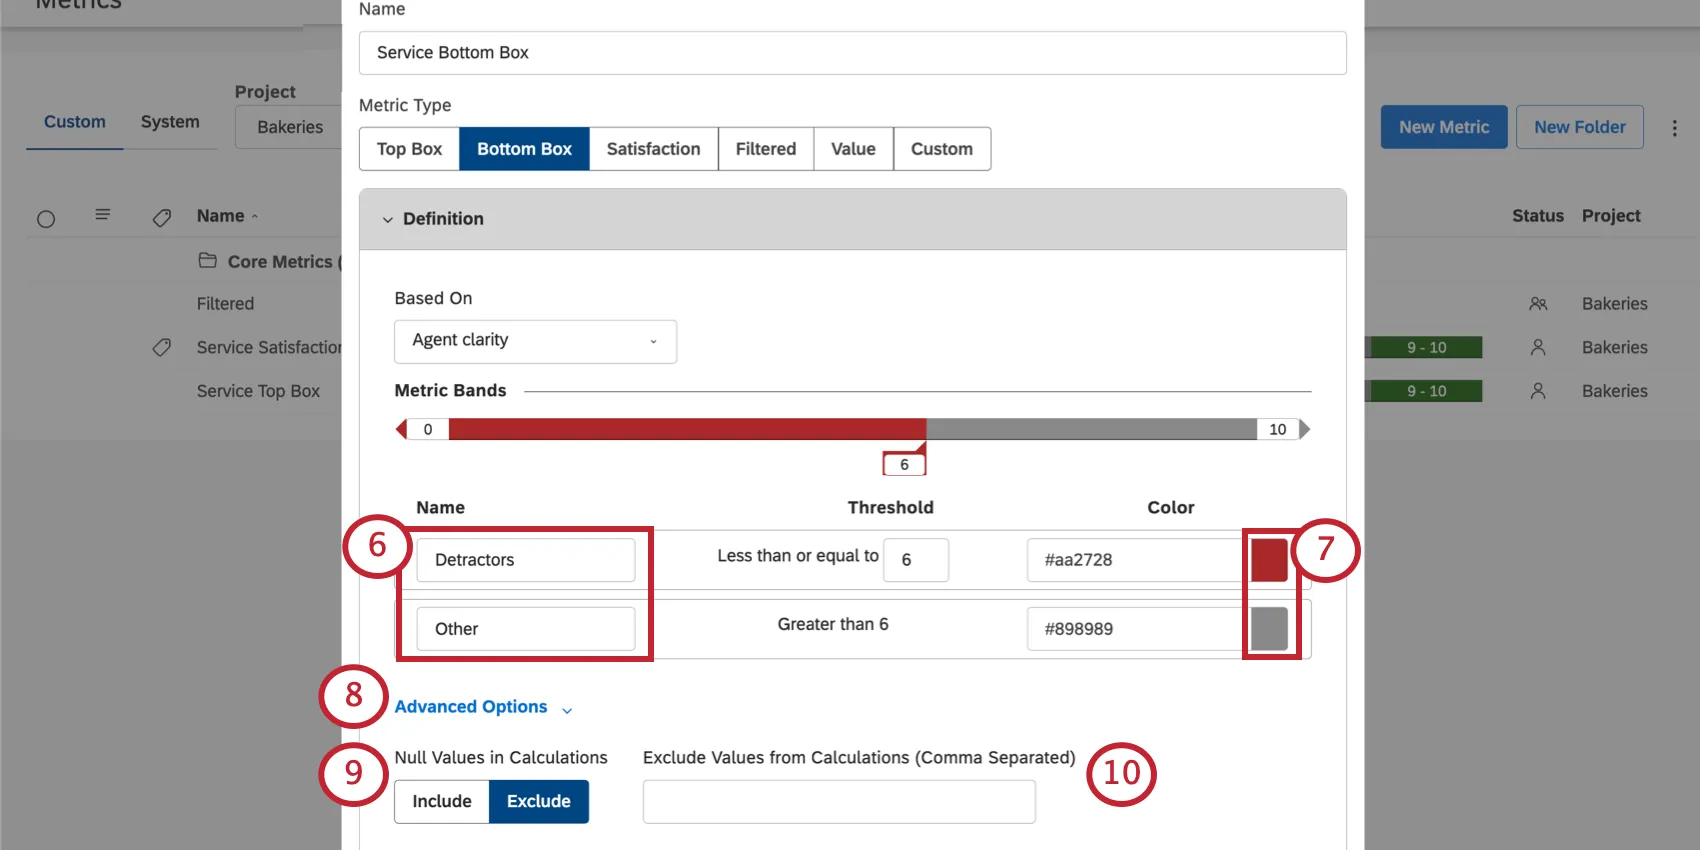
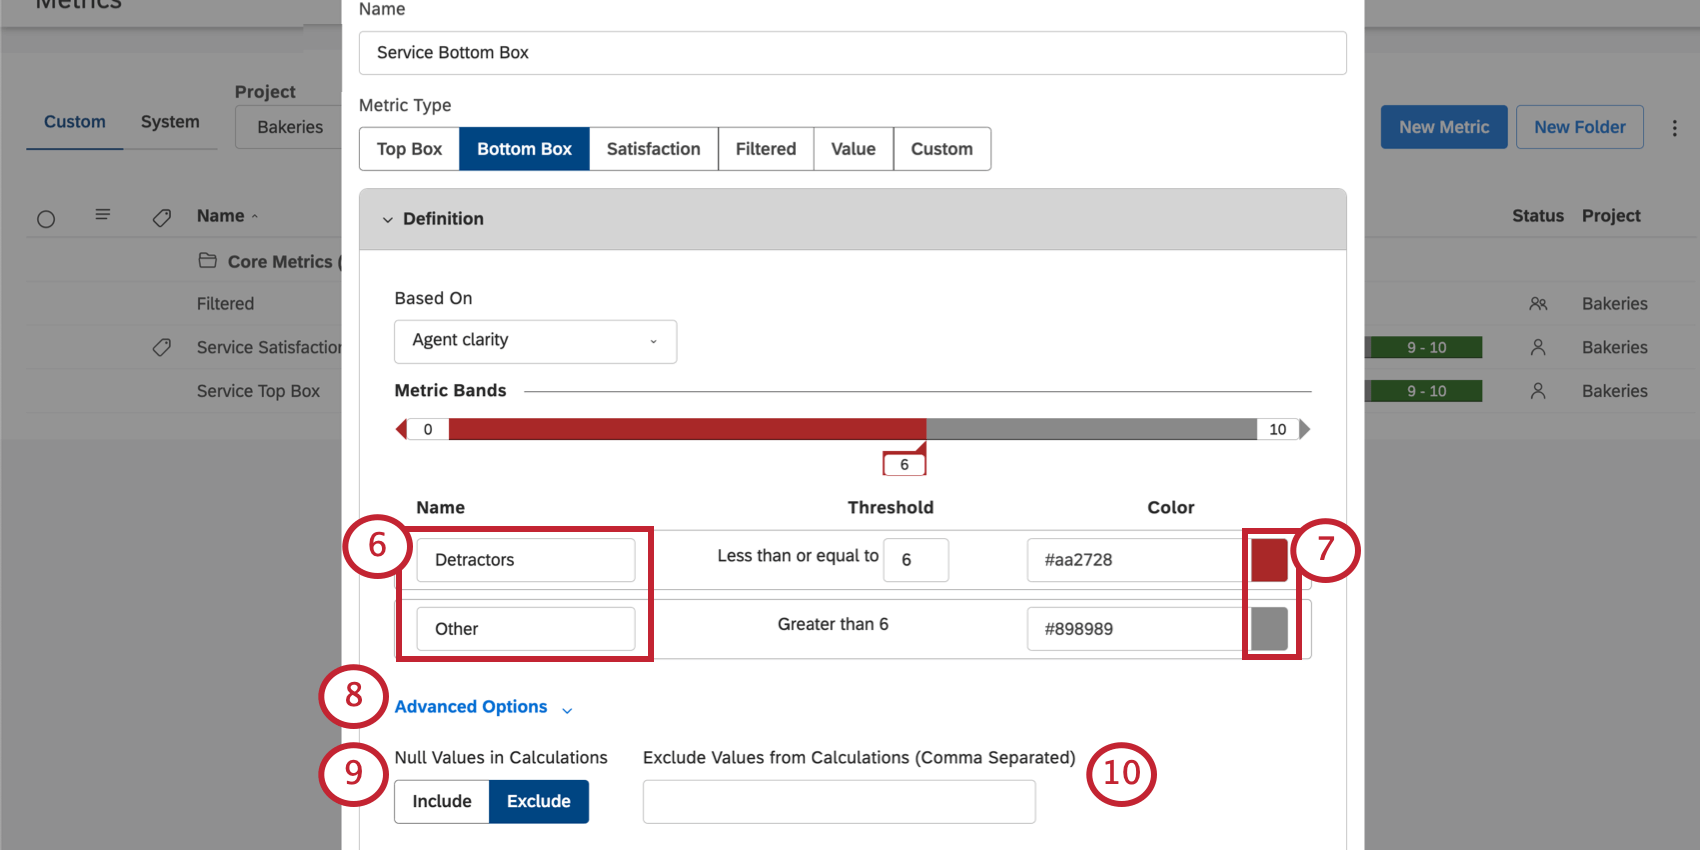
Change the color for responses that fall within that band’s threshold.
If you have null values to define, click Advanced Options.
For Null Values in Calculations, choose one of the following:
- Include: Include null and undefined values in the total when calculating bottom box.
- Exclude: Exclude null and undefined values from the total when calculating bottom box. Qtip: This setting only determines if null values are included in the bottom box calculation. This setting does not determine whether null values are displayed in the report (see Grouping Settings).

Under Exclude Values from Calculations (Comma Separated), type the values you want to exclude from calculations.
Qtip: Make sure to save your changes when you’re finished.
That's great! Thank you for your feedback!
Thank you for your feedback!