
Creating Dashboard Filters (Studio)
What's on this page
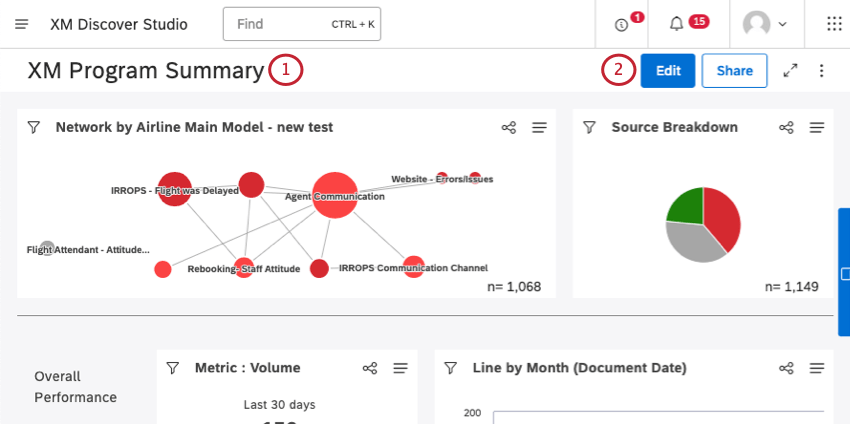
About Filtering Studio Dashboards
You can apply filters to an entire dashboard. This is useful when you need to synchronize your widgets by time or another common parameter.
Attention: We do not recommend using dashboard-wide filters with widgets from different projects, since this may produce unexpected results.
Qtip: Filters can be used with personalization.
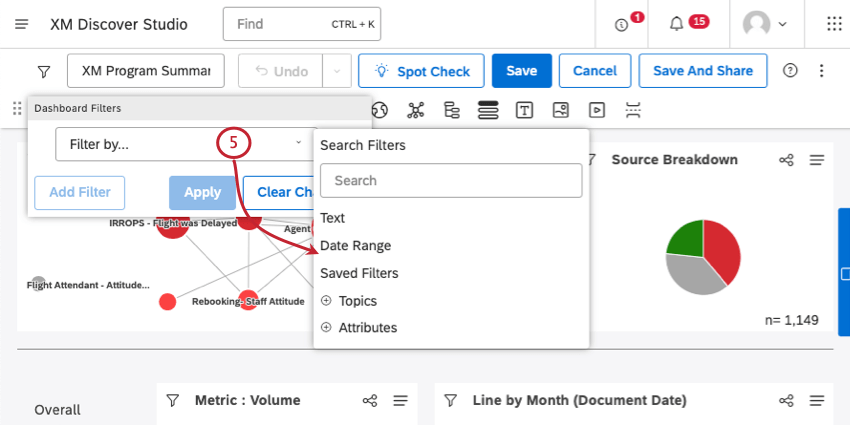
Available Filter Types
Studio enables you to filter dashboards using the following kinds of data:
- Text Filter: Add a text search to a dashboard. Dashboard viewers can filter all the dashboard’s data by a keyword or a phrase that appears in the field. See About Text Filter for details.
- Date Range: Set a date range for an entire dashboard. Date ranges are applied to all dashboard widgets regardless of their source, unless you set your widgets to ignore the dashboard date range. See Date Range Filters for available options.
- Saved Filters: Select a filter created in Studio or use one of predefined filters based on sentiment, effort, emotional intensity, or an intelligent scoring rubric’s passing and failing scores.
- Filters created automatically for Intelligent Scoring rubrics include:
- Rubric-name Passing Score: Filter for passing documents.
- Rubric-name Failing Score: Filter for failing documents. Qtip: Studio dashboards and widgets do not work with Designer filters that use verbatim-level rules. To ensure your dashboards work as intended, we recommend you avoid using these filters in Studio.

- Topics: Filter data by topics from a category model. Qtip: Click the Categorized link above the topics to select an entire category model and return all data categorized into any of its topics.
- Attributes: Filter data by attribute values. You have 2 additional options for every attribute:
- (Any value): Return all data where the selected attribute has any value.
- (No value): Return all data where the selected attribute does not have a value.
- Filters created automatically for Intelligent Scoring rubrics include:
Qtip: When filtering by attributes or topics, you can only use attributes or topics from the default project selected in dashboard properties.
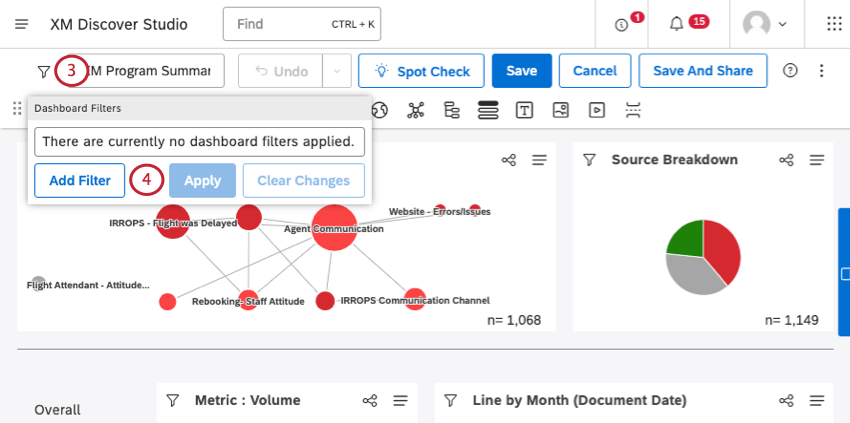
Adding Dashboard Filters
You can add up to 15 dashboard-wide filters. See more on how multiple selections interact.
Qtip: Before you can create filters, you need the Can Edit permission for the dashboard, Create Filter user permission, and access to the dashboard’s default project in the Content Provider.
Qtip: If you plan to use attribute or topic filters, make sure a default project is set in dashboard properties.
Qtip: To learn how multiple filters combine, see the Applying Filters page.
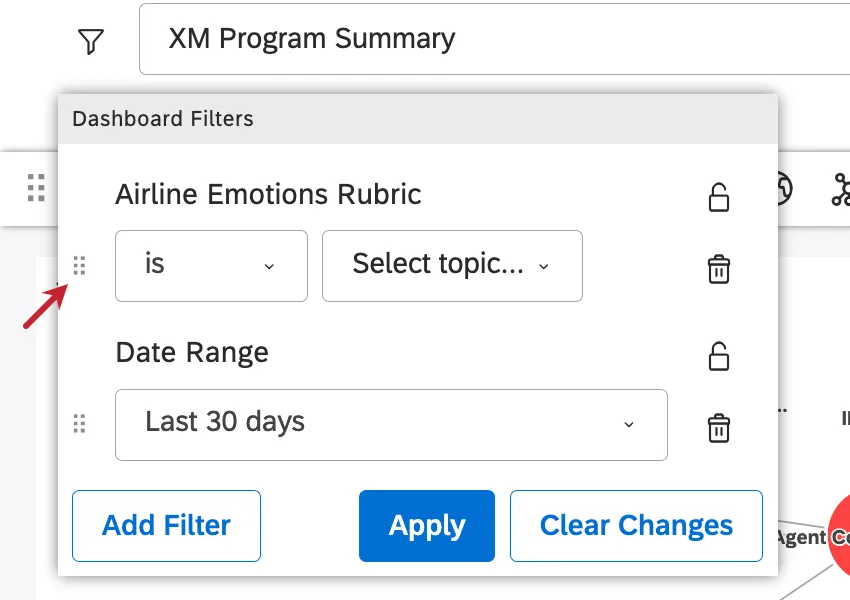
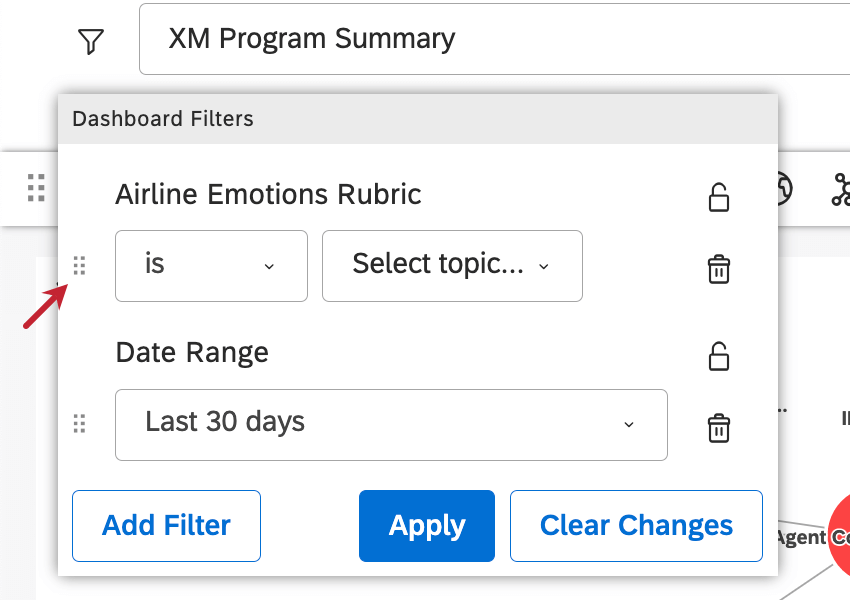
To remove a filter, click the trashcan icon next to it.
Qtip: The order in which filters are added does not affect how the filters are applied. You can arrange filters by dragging them up or down using the icon.
Qtip: You can set individual widgets to ignore specific types of dashboard filters. See Filtering Widgets for details.
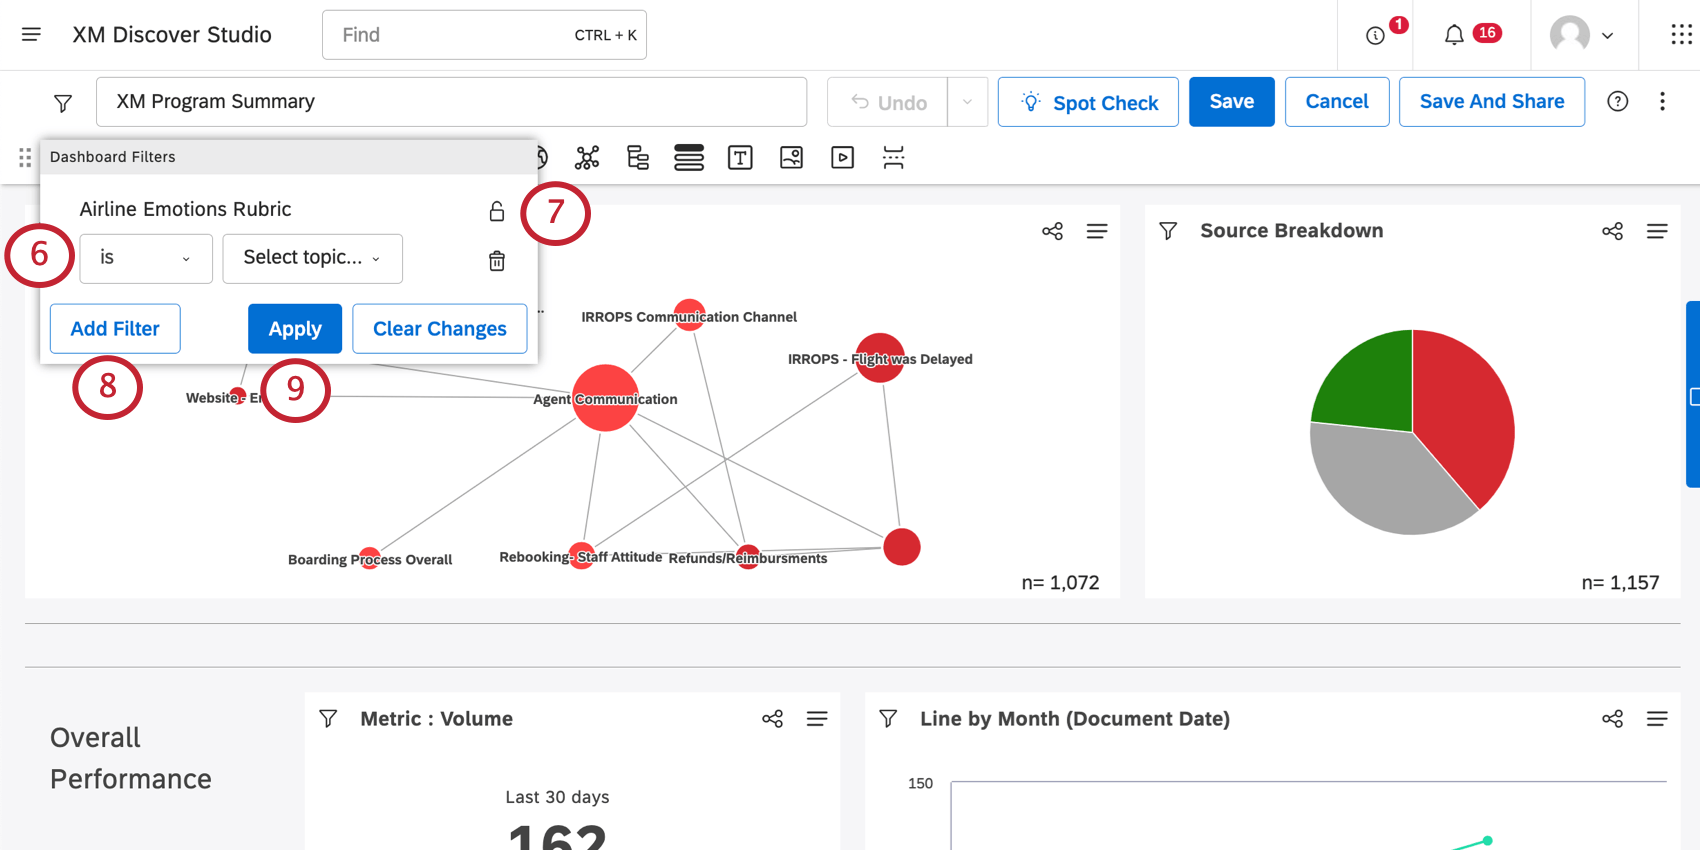
Operators
The following table describes the operators you can use to define filter conditions.
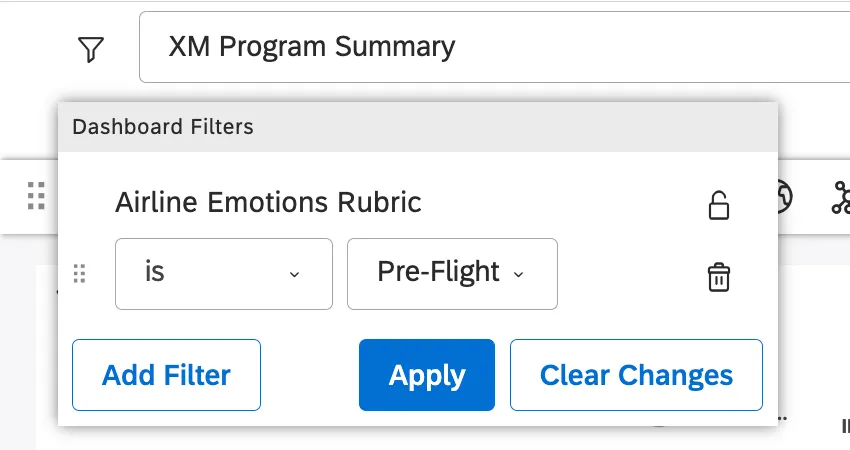
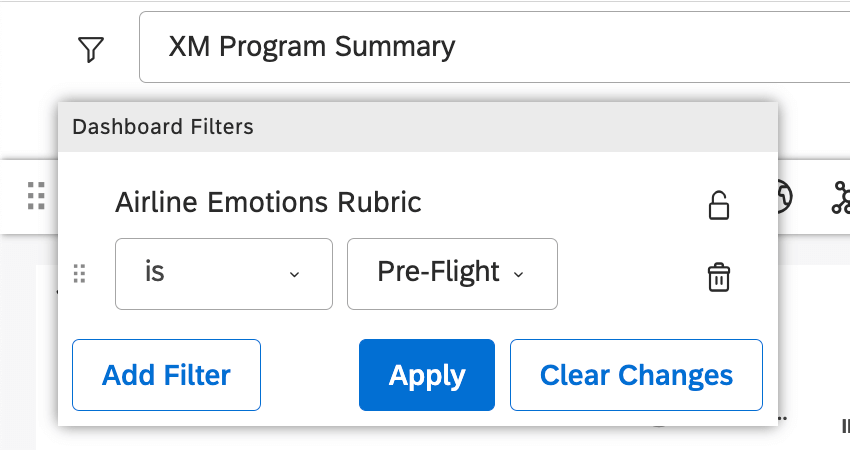
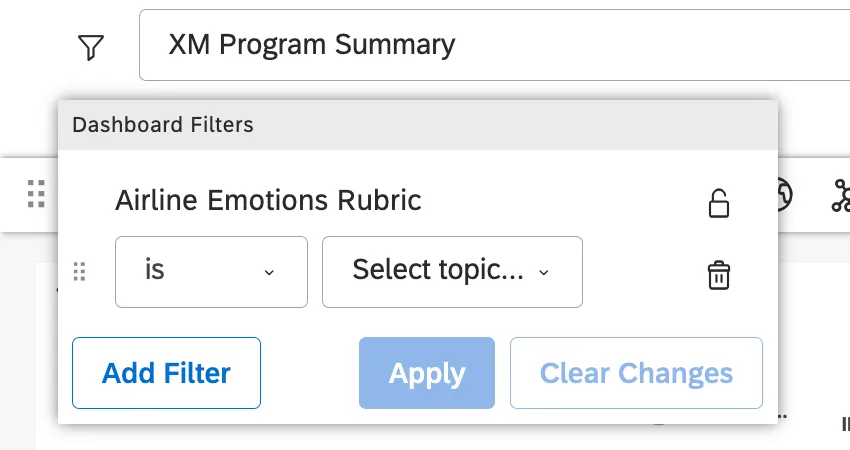
Example: For the condition “Airline Emotions Rubric is Pre-Flight,” “is” is the operator.
- is: Specify an exact match. For example, “City is Boston” will return all data from Boston. You can specify several exact matches, in which case the filter will return data that satisfies ANY of the values (using OR relationship). For example, “City is Boston, New York City” will return all data from Boston OR New York.
- is not: Exclude the value you select. For example, “City is not Los Angeles” will return data from all cities other than Los Angeles.
- is between: For numeric attributes. Define a numeric range to filter by.
- is not between: For numeric attributes. Define a range of numeric values to exclude from the results.
- is greater than or equal to: Return all data where the attribute’s value is equal to or greater than the selected threshold.
- is less than or equal to: Return all data where the attribute’s value is equal to or less than the selected threshold.
- categorized: For category models. Return all data categorized into any of the selected category model’s topics.
- has any value: Return all data where the attribute has any value. You can also think of this as any case where the attribute was answered and not left empty.
- has no value: Return all data where the attribute does not have a value. You can also think of this as any case where the attribute was not answered and instead left empty.
Setting Preselected Values
When adding filters to a dashboard, you can leave them empty or select specific values to be preselected for dashboard viewers. Preselected filter values serve as the default values for this dashboard whenever anyone opens or refreshes it.
Example: By default, this filter will show pre-flight data. The viewer will have to adjust the filter to see a different value. (If this filter was locked, the viewer would not be able to change the filter, and everyone would see pre-flight data.)
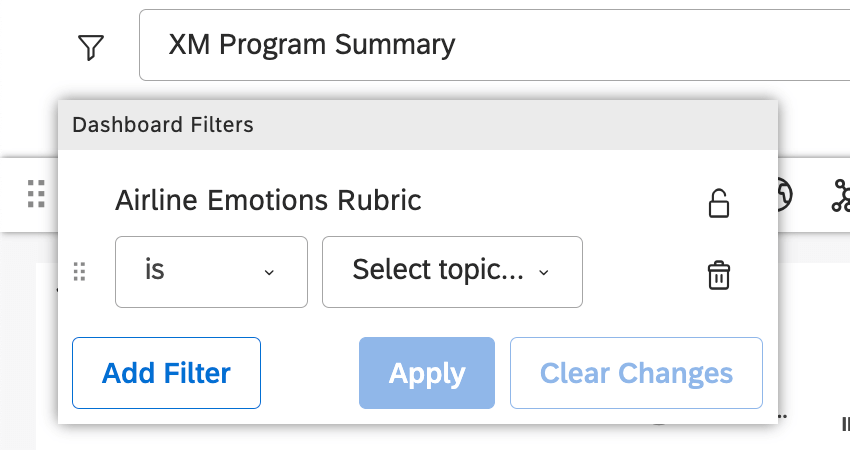
Example: This filter is not applied by default. However, viewers can adjust it to view different Airline Emotion data they’re interested in.
There are 2 exceptions:
- Date Range filters cannot be empty. You need to select a time period to report on.
- Text Filter search queries cannot be preselected. The search field is always empty when you open the dashboard.
Qtip: If you filter data while the dashboard is set to edit, you’ll adjust the default filters that are applied when visitors view the dashboard. However, if you filter data while the dashboard is set to view, your selections will not affect other users.
Dashboard Filter Visibility
Who can see dashboard filters depends on the type of the filter, its status, the user’s access level, and the selections made by dashboard editors. This page covers how to tell what filters your dashboard users can see.
Qtip: For an explanation of each type of filter, see Available Filter Types.
Date Ranges
Predefined date ranges (like “Last 180 days” or “Current month”) are always available to all dashboard viewers.
Custom date ranges are visible if any the following conditions are true:
- A filter is created by or shared with the user.
- A filter has been added to the dashboard by an editor.
Saved Filters
- Predefined sentiment filters (like “Negative Sentiment (predefined)”) are always available to all dashboard viewers.
- Predefined Effort filters (like “Very Easy”) are always available to all dashboard viewers.
- Scorecard filters for rubrics are visible if all of the following conditions are true:
- A rubric is based on the same project as the dashboard.
- A Scorecard filter is not disabled. See Disabling Scorecard Filters.
- Other Designer-shared filters are visible if any of the following conditions are true:
- A user has access to the source project on the content provider side.
- A filter has been added to the dashboard by an editor.
- Filters created in Studio are visible if any of the following conditions are true:
Topics
Topic filters are always visible to all viewers on behalf of the dashboard owner.
Attributes
Attribute filters are always visible to all viewers on behalf of the dashboard owner.
Filters Added by a Dashboard Editor
For all types of dashboard filters, selections saved in Edit mode are preserved and preselected when dashboard viewers open a dashboard. Viewers can adjust those selections as needed, unless a filter is locked.
That's great! Thank you for your feedback!
Thank you for your feedback!