
Drilling Widgets (Studio)
What's on this page
About Drilling Widgets
To “drill” a widget is to click a data point in the widget so you can get more insight on that data point. Once you “drill” a data point, you can:
- See the breakdown of a topic or attribute.
- Create a new widget of the data breakdown.
- Open document explorer and see the feedback behind the results.
You can drill a data point to find its connection to topics and attributes, how it trends over time, see key associated words, and more.
Drilling Widgets
You can drill widgets when viewing or editing the dashboard.
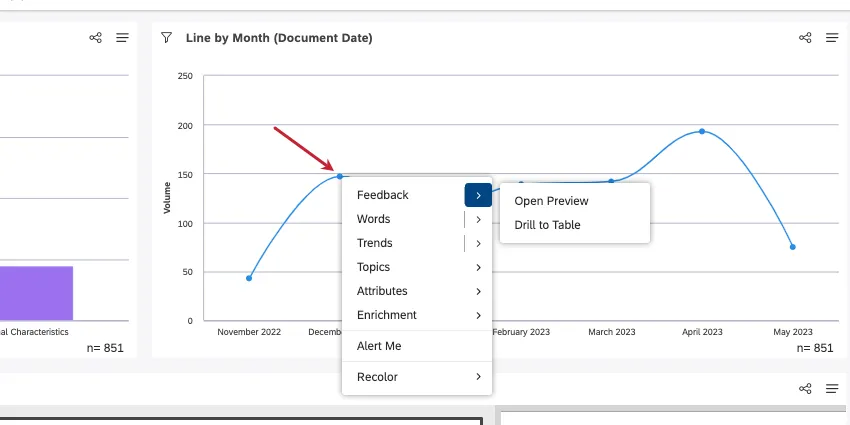
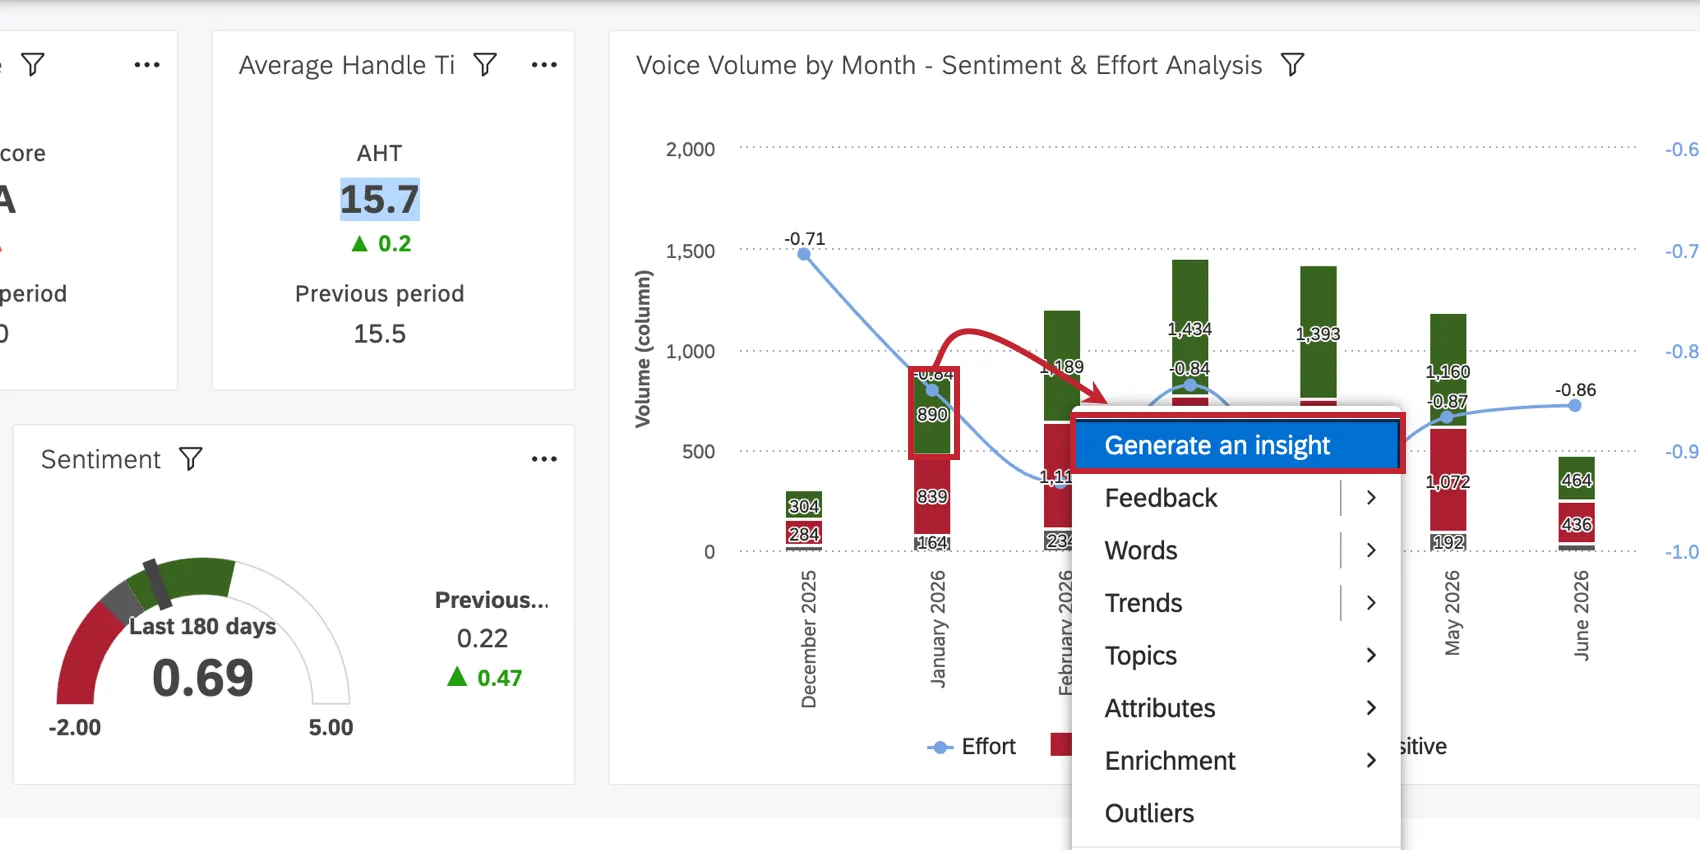
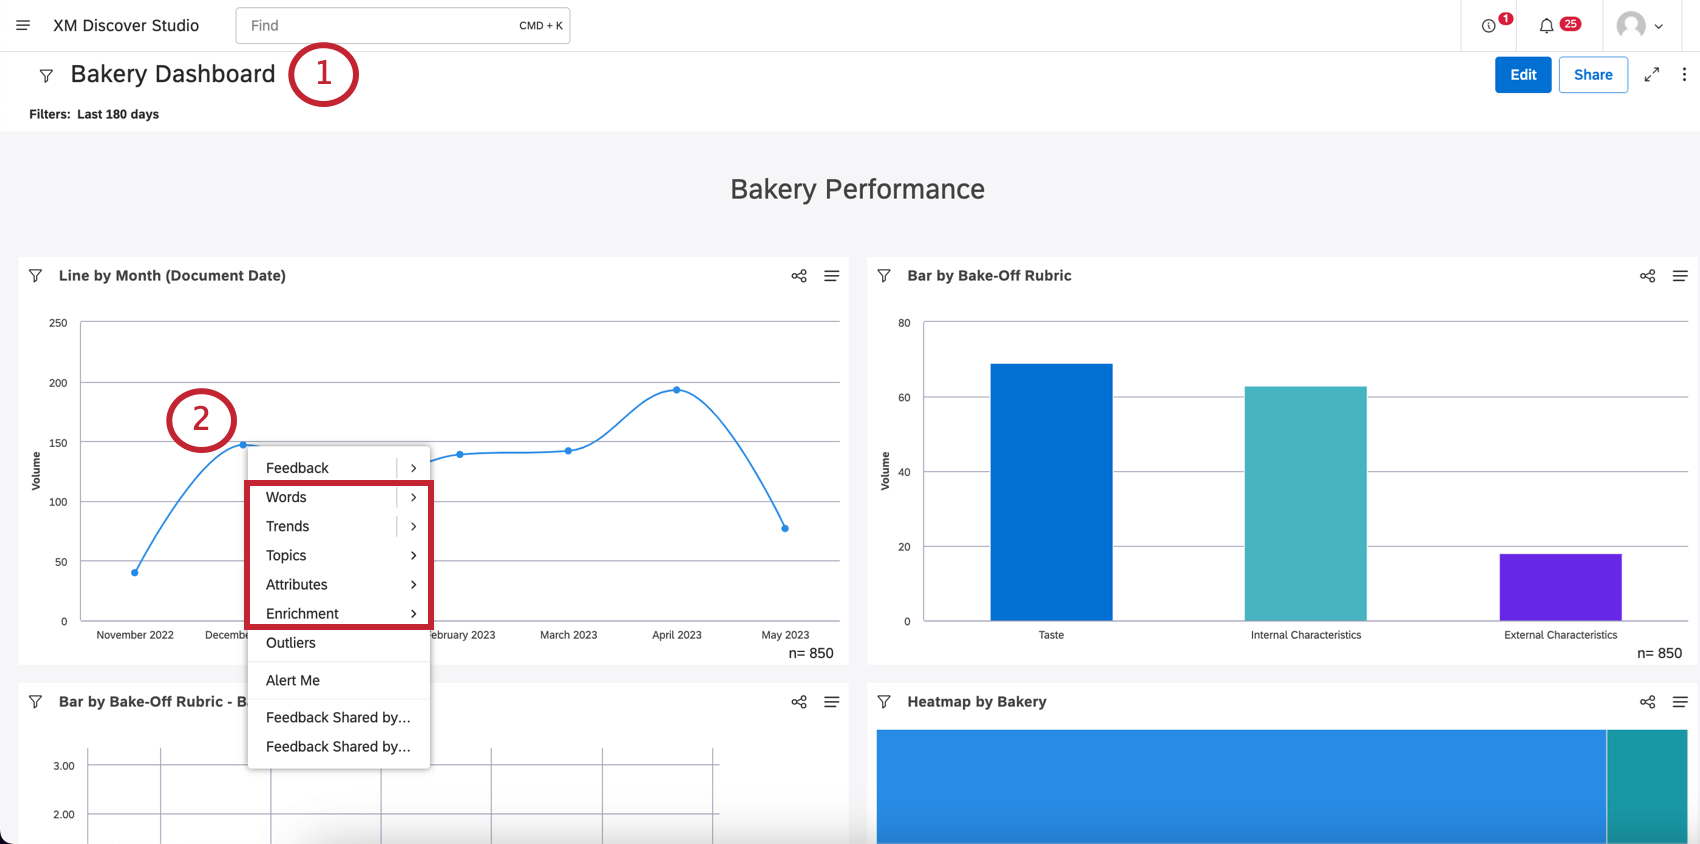
Click a data point on your widget and select one of the options from the menu that appears.
Qtip: If your widget is being used as a filter, you right-click to drill. The left-click filters the dashboard.
Drilling in View vs. Edit Mode
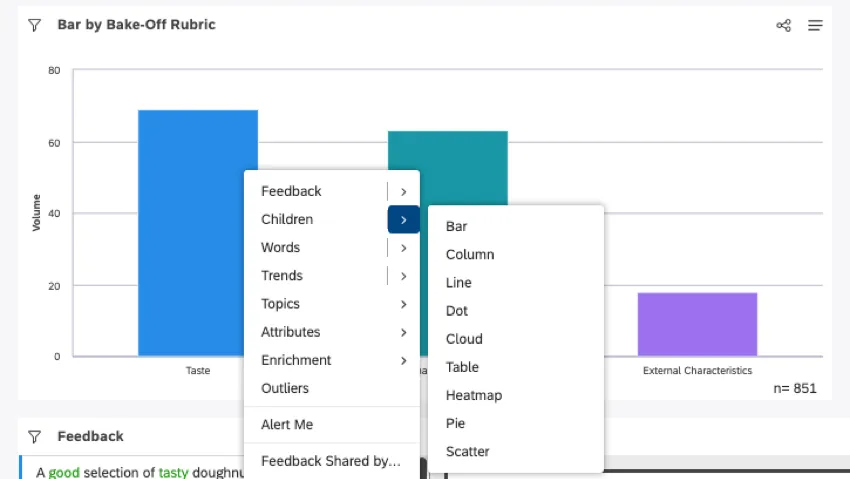
There are a few options, like Children and Words, that let you break down data points further into widgets.
Clicking options while editing the dashboard creates a new widget in the dashboard.
Clicking options while viewing the dashboard only previews a widget. Only you will see this widget, and it will go away if you refresh or leave the dashboard.
You can continue clicking data points to drill deeper and deeper into your insights.
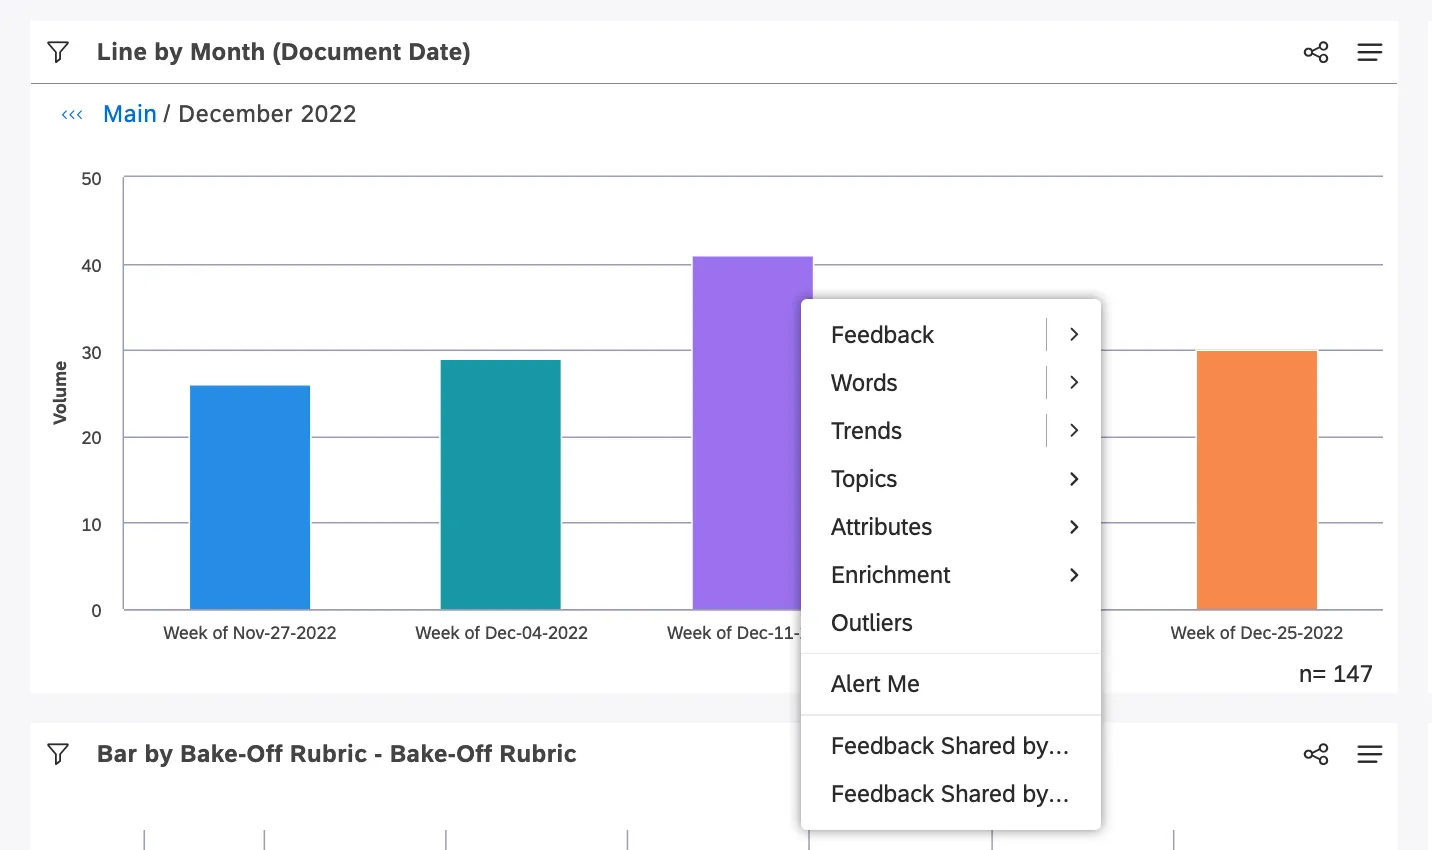
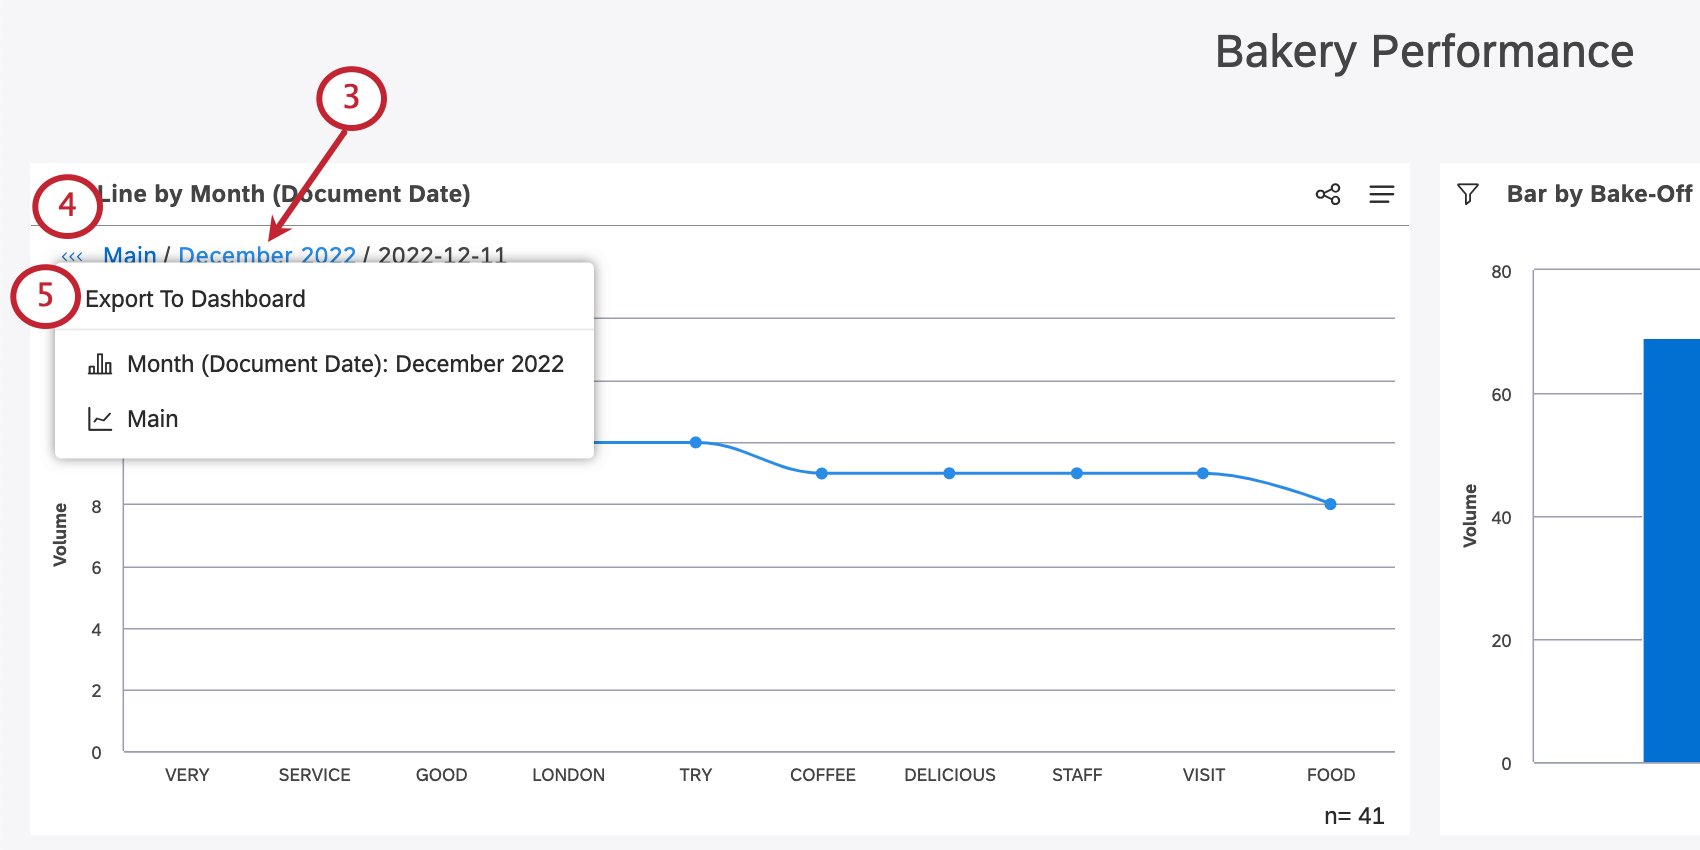
Qtip: Click Main to leave this widget preview and return to the original widget.
Qtip: Drilling in view mode affects data that is exported while drilling.
Permissions
Drilling in view mode is available to all license types and requires the following permissions:
- Drill in Place in View Mode: Lets you drill dashboards and widgets.
Drill to Feedback in View Mode: Lets you drill feedback in a feedback widget or document explorer.

Qtip: The View-only Users Can Drill to Feedback dashboard property overrides this permission for view-only users.
Drilling in Edit mode is available to users with Configuration Analyst and Report Creator licenses.
Widgets
| Widget name | Widget appearance | Drilling options with this widget |
|---|---|---|
| Bar | Horizontal bar | Children Words Trends Topics Attributes Enrichment |
| Column | Vertical bar | Children Words Trends Topics Attributes Enrichment |
| Line | Line chart | Children Words Trends Topics Attributes Enrichment |
| Dot | Bubble chart line | Children Words Trends Topics Attributes Enrichment |
| Cloud | Cloud | Children Words Topics Attributes Enrichment |
| Table | Table | Children Words Trends Topics Attributes Enrichment |
| Heatmap | Heatmap | Children Words Topics Attributes Enrichment |
| Pie | Pie | Children Words Topics Attributes Enrichment |
| Scatter | Scatter | Children Words Topics Attributes Enrichment |
Generate an Insight
If your connected Qualtrics account has access to Insights Explorer, then you can generate an insight based on data in your Studio dashboards. See Generating Insights from Studio Widgets for step-by-step instructions.
Feedback
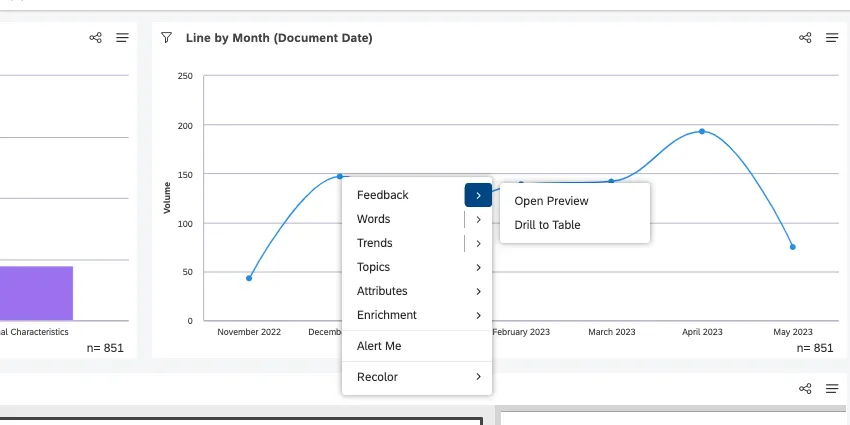
Click Feedback or Open Preview to see the customer feedback behind the data point. By clicking these options, you’ll open the document explorer.
Click Drill to Table to create a feedback widget with the documents behind this data point.
Qtip: Any filters or data groupings applied to the widget and the dashboard will also be applied to the documents that you drill to.
Children

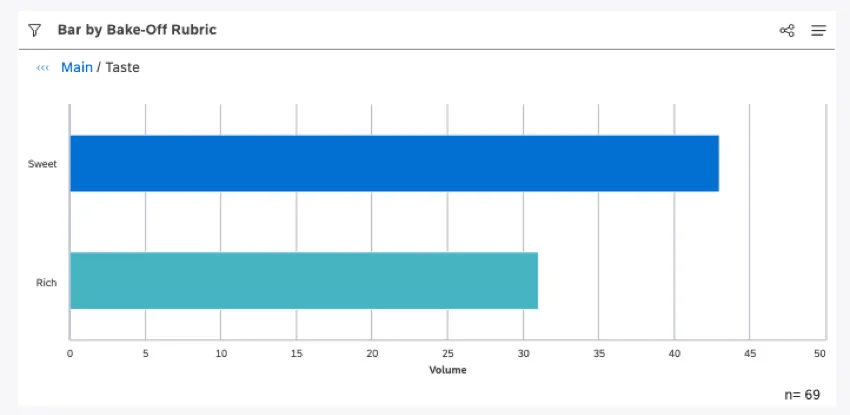
Children appears if you click on a topic in a widget. Since topics can be organized in a hierarchy, this is a way for you to see the volume of your selected topic’s subtopics. Children also appears when you click on an organizational hierarchy.
If you click Children, you will see a horizontal bar widget. If you click the arrow, you will have a series of widgets to choose from.
Qtip: All widgets display the subtopics or organization level immediately below what you selected. For example, if there are 2 subtopics, a cloud will show 2 words.
Sometimes you will not see Children in the drilling menu. This can happen because:
- There are no topics 1 level below the selected topic.
- There are no organization levels below the selected level.
- The lowest level grouping is not based on a topic or hierarchy.
Words
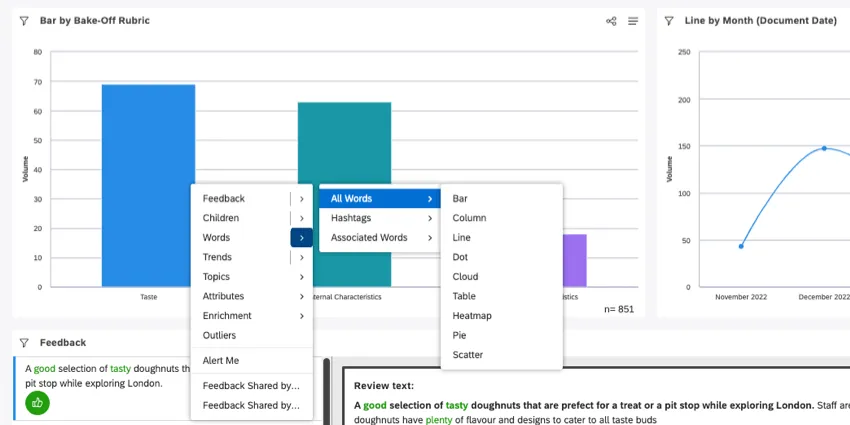
The Words option lets you drill to the most common words or hashtags related to a data point.
Click Words to see a cloud of all words associated with the data point. If you click the arrow, you can visualize one of the following instead:
- All Words: Drill to related words. This will give you an idea of the most common terms customers use when talking about a particular data point.
- Hashtags: Drill to related hashtags.This is most useful if your source data comes from a social media site that uses hashtags.
Associated Words: Drill to related pairs of linguistically connected words. Associated words are presented in the following format: word 1 –> word 2.

Example: room –> clean
If you click the arrow next to any of the options above, you will have a series of widgets to choose from.
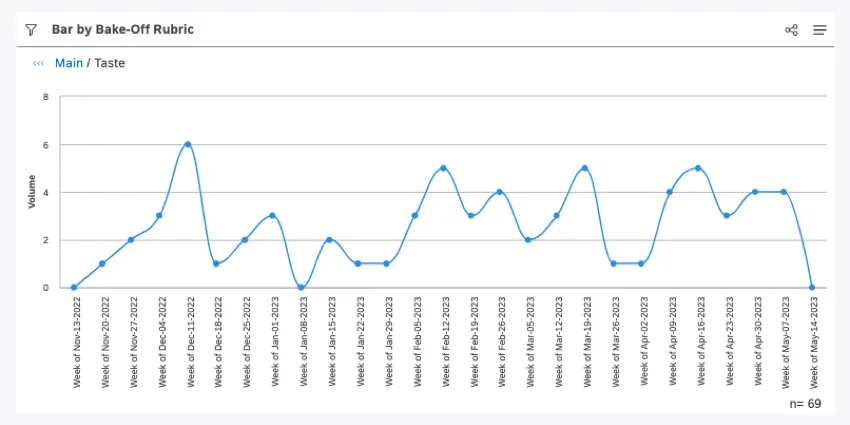
Trends
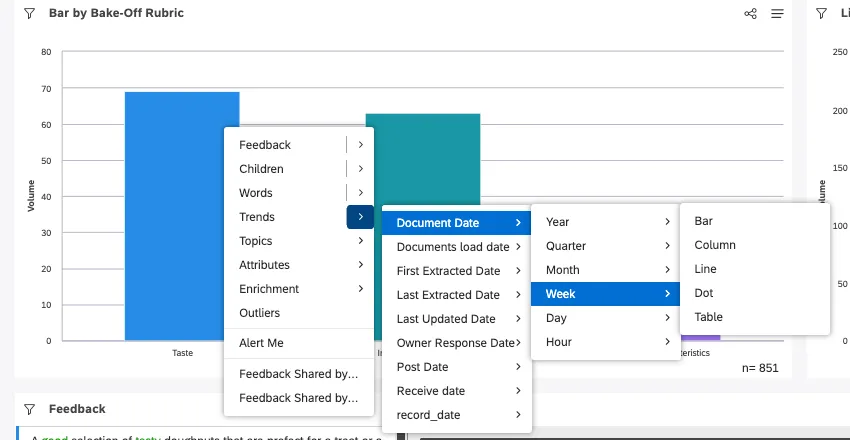
Use the Trends option to analyze a data point on a timeline.
Click Trends to see a line widget grouped by document date. The time scale (e.g., year, quarter, month) is chosen depending on the date filter you have applied or the data point’s date range (whichever is smaller).
Otherwise, you can select a date field to use, a time scale (e.g., year, quarter, month), and a widget.
Topics
Use the Topics option to drill to topics or topic leaves related to a data point.
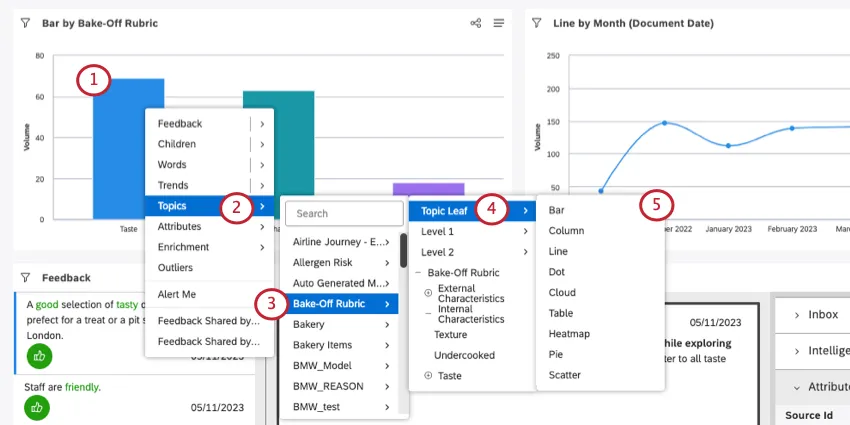
- Topic Leaf: A topic leaf is any category found at the lowest level in the hierarchical structure of a model. It usually represents the most granular categorization level. Qtip: A topic leaf is any category that does not have a sub-category.
- Level 1, 2, and so on: Run a topic report for topics from the selected level. The number of levels depends on the category model.
- Category Tree: Select a specific topic in a category tree.
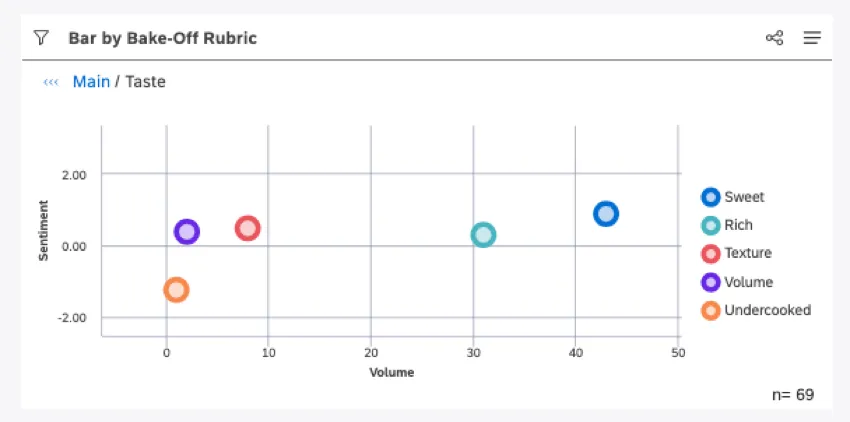
Example: Here, we created a topic leaf scatter chart.
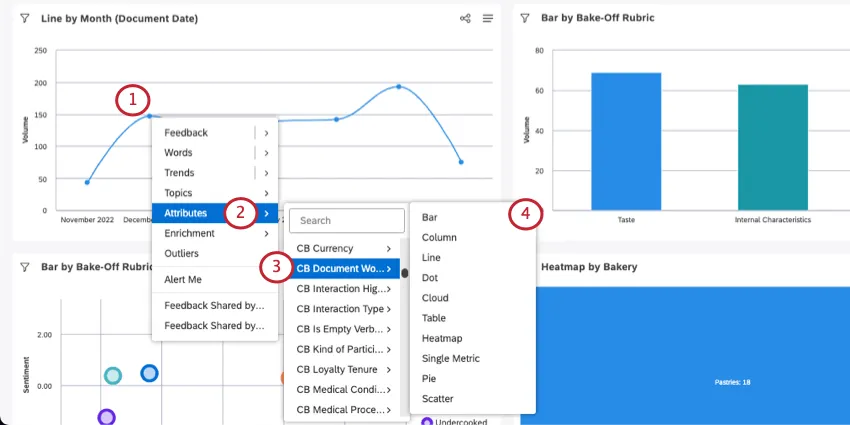
Attributes
You can drill to an attribute’s most common values related to a selected data point.
Qtip: Use the search field to find an attribute by name.
Example: We clicked a volume data point for a particular date, then made a column chart based on the CB Document Word Count attribute. Now we have a chart of the word count for feedback recorded on that date.
Enrichment
Use the Enrichment option to drill to various enrichment attributes derived by XM Discover.
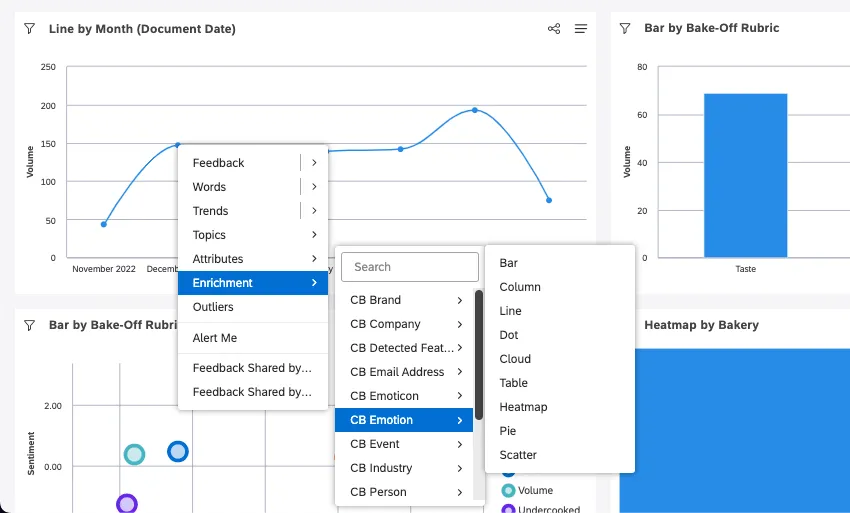
Click the arrow next to Enrichment, then choose from one of the following enrichment attributes:
- CB Brand: Drill to related brand mentions.
- CB Chapters: Drill to conversational chapters that represent semantically related segments of the conversation. For example, Opening, Need, Verification, Solution Step, and Closing.
- CB Company: Drill to related company mentions.
- CB Detected Features: Drill to detected feature types.
- CB Email Address: Drill to related email addresses.
- CB Emoticon: Drill to related emojis and emoticons.
- CB Emotion: Drill to emotion types detected by the NLP engine.
- CB Event: Drill to related standard holidays (like New Year or Halloween), life events (like wedding or graduation), and common cultural events (like the Super Bowl).
- CB Industry: Drill to related industries.
- CB Person: Drill to related names of people.
- CB Phone Number: Drill to related phone numbers.
- CB Product: Drill to related products.
- CB Sentence Type: Drill to sentence types.
- Language and Other: Drill to language and content type attributes:
- Auto-detected language: Drill to automatically detected languages (if your project uses automatic language detection).
- Content Subtype: Drill to subtypes of documents without content, such as ads, coupons, article links, or “undefined.”
- Content Type: Drill to documents with or without content.
- Processed language: Drill to languages the feedback has been processed in.
Once you’ve chosen an attribute, you can choose a widget.
Qtip: Use the search field to find an attribute by name.
Outliers
Outliers show you what words, associated words, and hashtags are unique or unusual about any given data point.
See Using Outliers for details.
Qtip: Drilling to outliers is only available in View mode.
Alert Me
Use the Alert Me option to create a metric alert based on the data point of interest.
See Creating a Metric Alert for details.
Drillable Dashboards
Use the list of drillable dashboards to drill to another dashboard filtered on your selected data point.
See Drillable Dashboards for details.
Qtip: Drillable dashboards are only available when this option is configured in dashboard properties.
Recolor
The Recolor option lets you apply a custom color to one or more report items.
See Recoloring Widget Report Items for details.
Qtip: Recoloring is only available when drilling in Edit mode.
Exporting Drilling Results
As you drill into widgets, you can export the reports you generate into a separate dashboard and share it. This can help you show how you’ve arrived at a particular insight.
Qtip: You need the Create Dashboard permission to export drilling results.
Any filters applied to the widget at the moment of drilling are carried over to the new dashboard.
Qtip: This works with Children, Words, Trends, Topics, Attributes, and Enrichment.
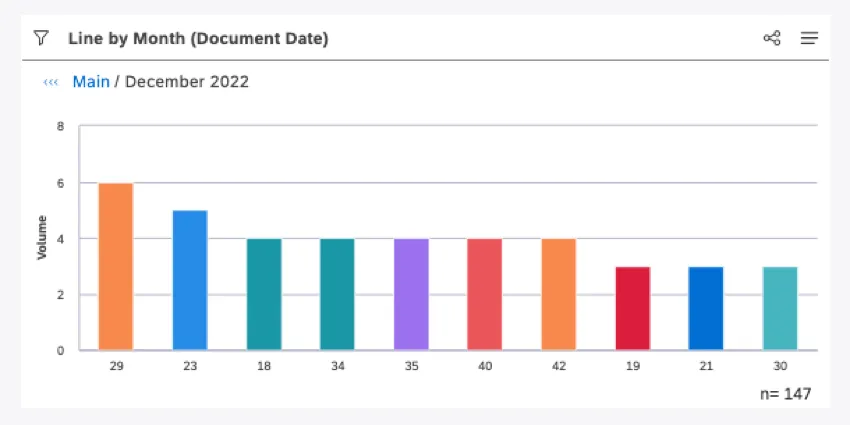
The new dashboard will have the original, undrilled widget (first) with the data point you selected highlighted in gray. Each level of drilling will be included in the dashboard in order after that.
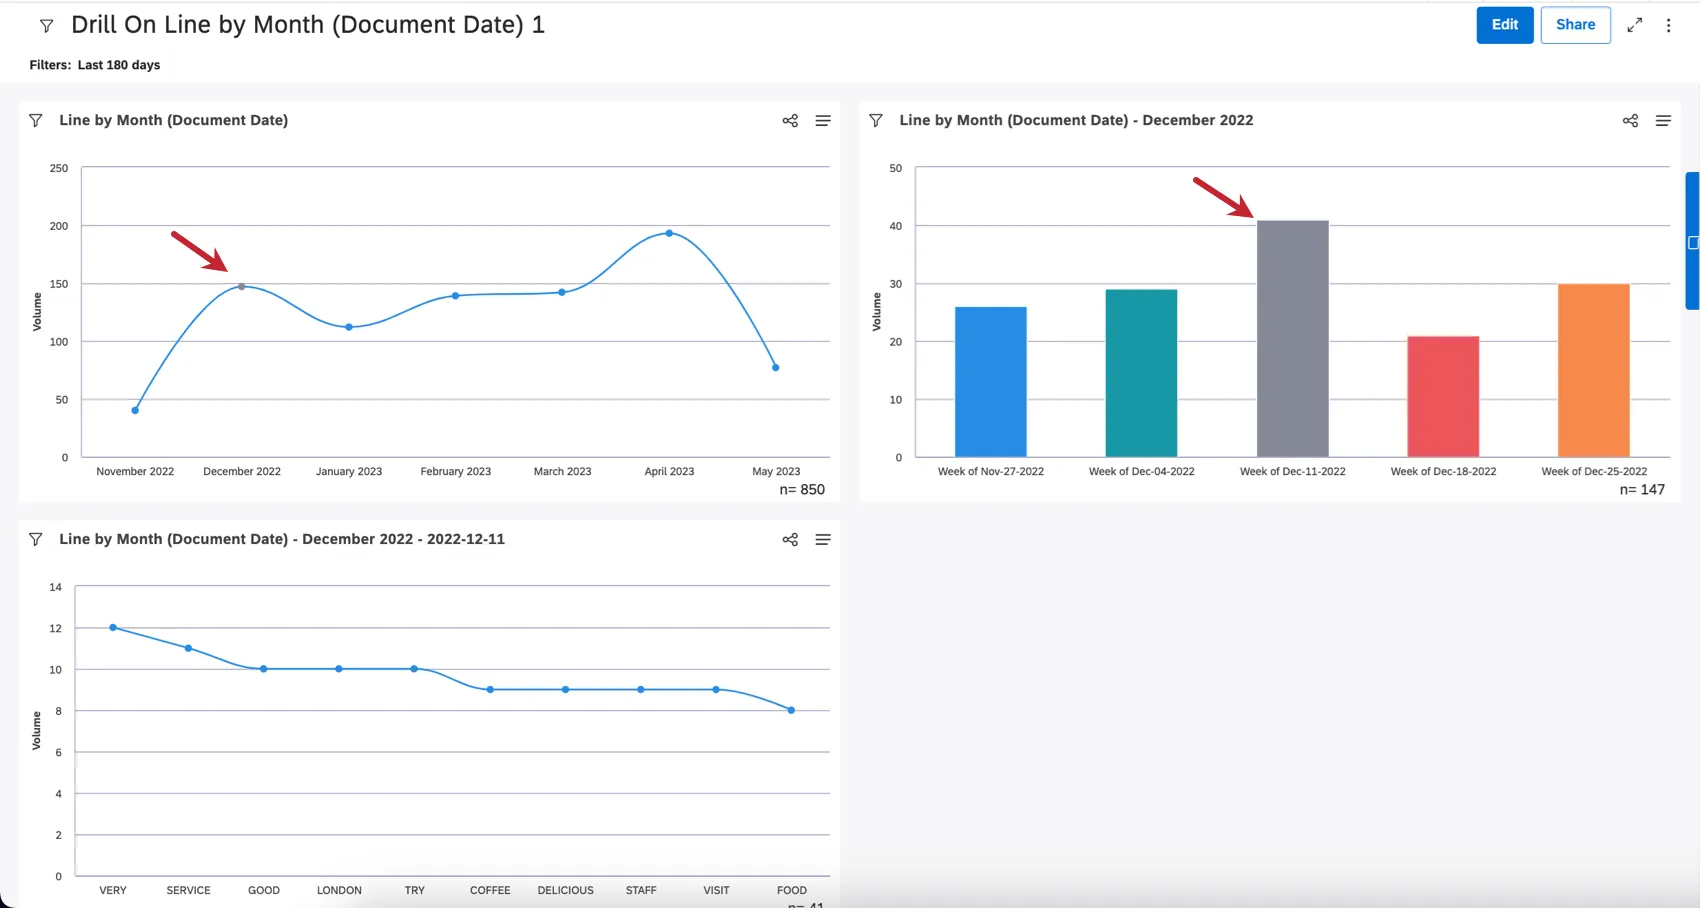
Qtip: To recolor the gray data point, see Recoloring Widget Report Items.
FAQs
What is a category model? What is a topic?
What is a category model? What is a topic?
Since category models are how XM Discover analyzes topics, you will see “category model” and “topic” used interchangeably throughout the platform.
What is considered a document?
What is considered a document?
How are “children” and “parents” defined when you drill a topic in a widget?
How are “children” and “parents” defined when you drill a topic in a widget?
You can also think of parents as topics and children as their subtopics. For example, you may have the topic “digital cameras.” Within this topic, you could have the subtopics “picture quality," "battery life," and "ease of use."
In this context, parent and child does not refer to widget data grouping.
How does widget ownership affect the data the dashboard user sees when they drill?
How does widget ownership affect the data the dashboard user sees when they drill?
- A user who drills a widget in View mode gets exactly the same level of data access as the widget’s owner.
- A user who drills a widget in Edit mode essentially sees data according to their own access level.
That's great! Thank you for your feedback!
Thank you for your feedback!