Loading...
Skip to article
  • Qualtrics Platform
    Qualtrics Platform
  • Customer Journey Optimizer
    Customer Journey Optimizer
  • XM Discover
    XM Discover
  • Qualtrics Social Connect
    Qualtrics Social Connect

Editing Dashboards (Studio)


Was this helpful?


This site is protected by reCAPTCHA and the Google Privacy Policy and Terms of Service apply.

The feedback you submit here is used only to help improve this page.

That’s great! Thank you for your feedback!

Thank you for your feedback!


About Editing Studio Dashboards

After a dashboard is created, you can change its properties or edit its widgets.

Assigning Dashboard Editors

To edit a dashboard, you must have an Edit Dashboard permission and have the specific dashboard shared with you with the Can Edit permission enabled.

If a dashboard is personalized, you must also be included in the related organization hierarchy’s users mapping file to be able to edit the dashboard.

Switching Between Edit and View Mode

To edit widgets, you need to open the dashboard in edit mode. There are several ways to do this:

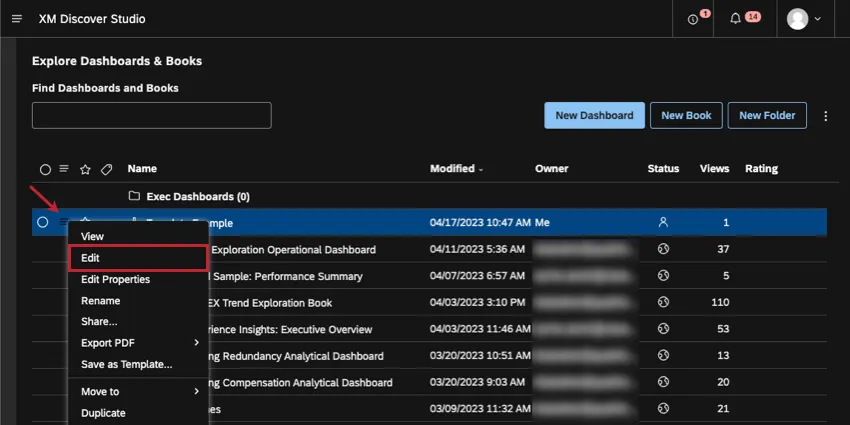
  • On the homepage, under Explore Dashboards and Books, click the menu next to your dashboard and select Edit.
    Hamburger menu next to dashboard expanded on Studio homepage
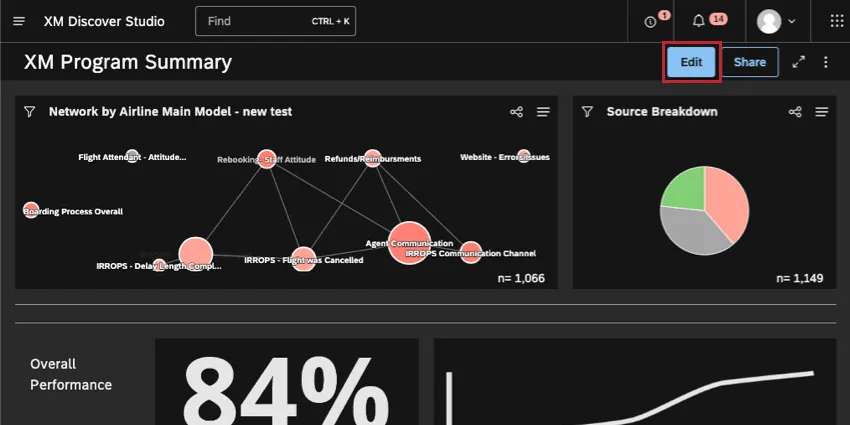
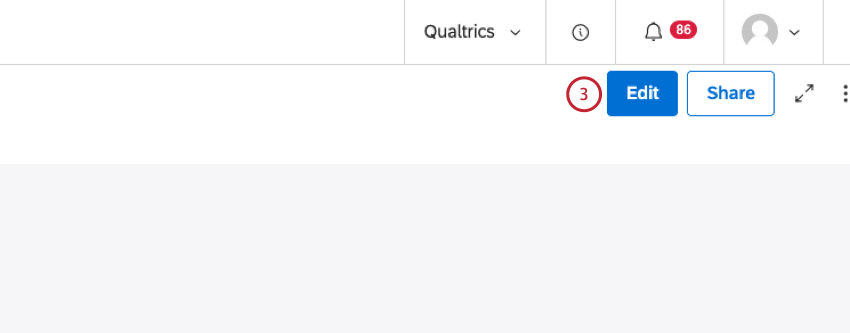
  • When viewing a dashboard, click the Edit button in the dashboard header.
    Edit button at the top of a dashboard
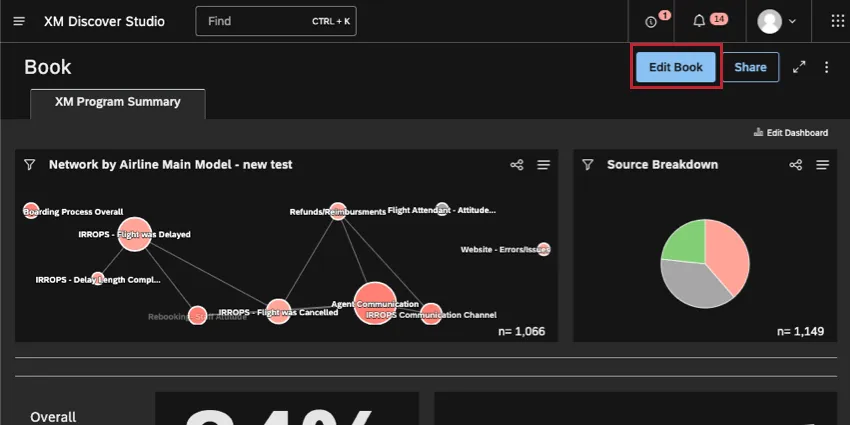
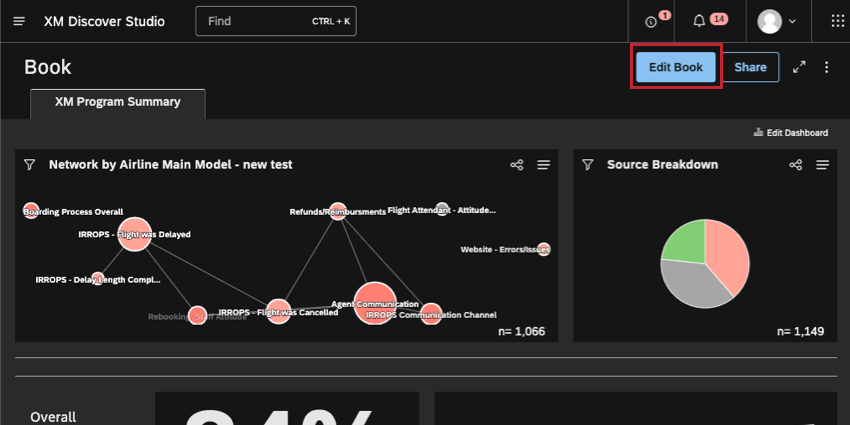
  • When viewing a dashboard inside a book, click the Edit Dashboard button in the book header.
    Edit book button

To return to View mode, either save or cancel your changes using corresponding buttons at the top.

Top of a book

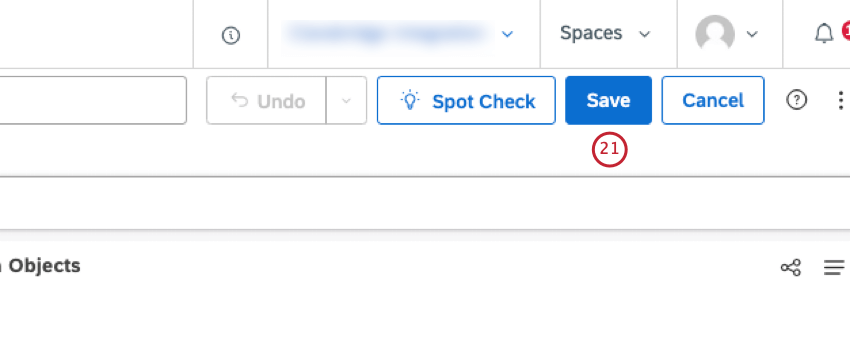
Saving Your Dashboard

Top of a book

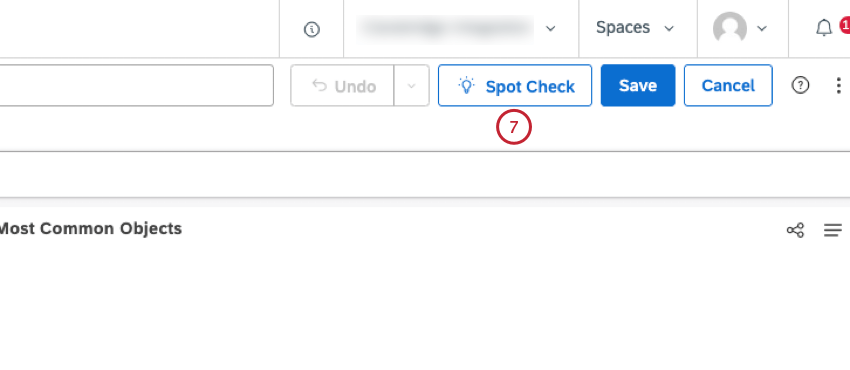
Click Save in the upper-right to save your changes.

Changes Saved Automatically

Your dashboard is saved automatically every time you perform the following actions:

  • Add a new widget from the menu or using drilling.
  • Change the dashboard name.
  • Copy a widget.
  • Delete a widget.

Editing Dashboard Properties

The Dashboard Properties editor contains some basic information about the dashboard, such as name, owner, and color palette, in addition to advanced settings, such as drilling settings.

See Dashboard Properties to learn more.

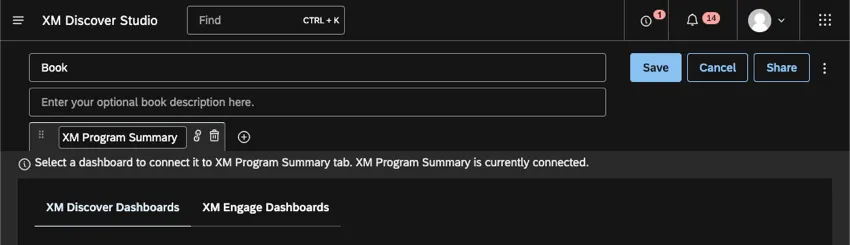
Qtip: When editing your dashboard, you can change the name in the top-left without going to the dashboard properties.
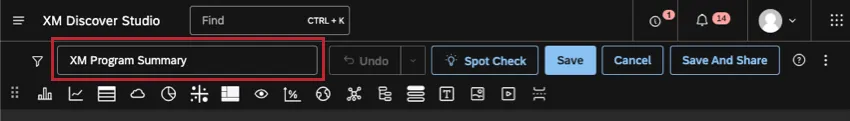
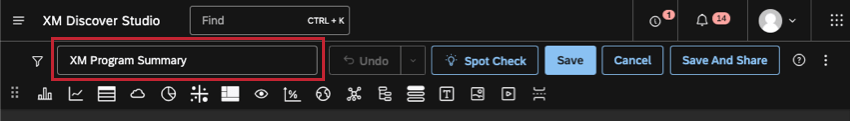
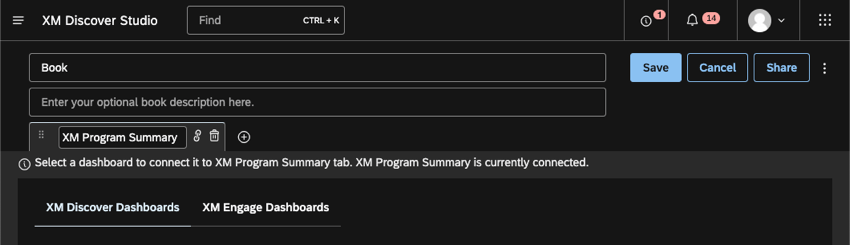
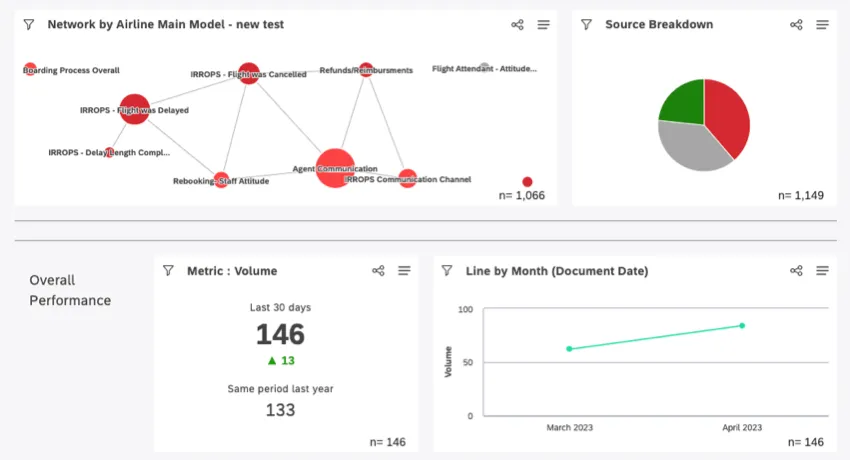
Renaming upper-left of a dashboard

Editing Widgets

Widgets are content you can add to your dashboard. Widgets can display reports, images, text, and videos.

For more on how to add, copy, resize, and customize your widgets, see Widgets Basic Overview (Studio).

Dashboards filled with widgets, like line charts, numbers showing change over time, and a network widget

Undoing and Redoing Dashboard Edits

Attention: To be able to undo and redo edits to a dashboard, you must own or have edit rights for the dashboard.

The undo and redo feature is available when doing the following in a dashboard:

  • Adding a widget
  • Duplicating a widget
  • Deleting a widget
  • Linking and unlinking a widget-as-filter
  • Updating widget settings
  • Moving widgets
  • Resizing widgets
  • Updating dashboard properties

Studio will remember up to the 10 most recent actions made to widgets in a dashboard to allow you to undo or redo them if necessary. For more information about widgets, please see Widgets (XM Discover).

  1. Sign into Studio.
  2. Navigate to the dashboard.
  3. Click the Edit button.
    Edit button in a dashboard
  4. Make one or more edits to a dashboard widget or widgets. The Undo button will become active when you edit a dashboard widget. You can click the Undo button to undo your most recent action.
    arrow next to undo button expanded, showing revisions to choose from
  5. Alternatively, you can click the down arrow button to view a list of up to the 10 most recent edits to widgets in a dashboard that you can undo.
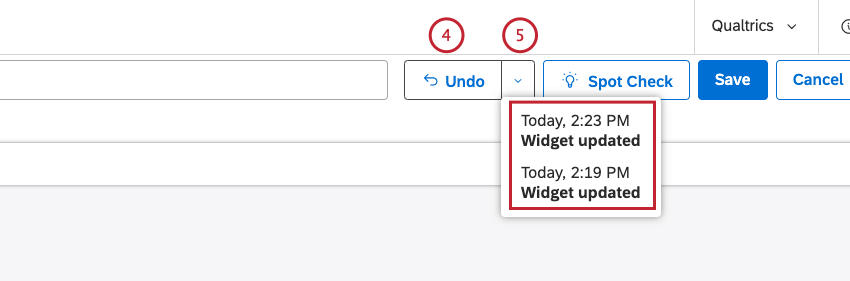
    Qtip: You can click each of the separate edits in the list in any order.
    Attention: For edits that are connected, for example updating a widget and then deleting it, undoing an edit from the list may result in multiple edits being undone.
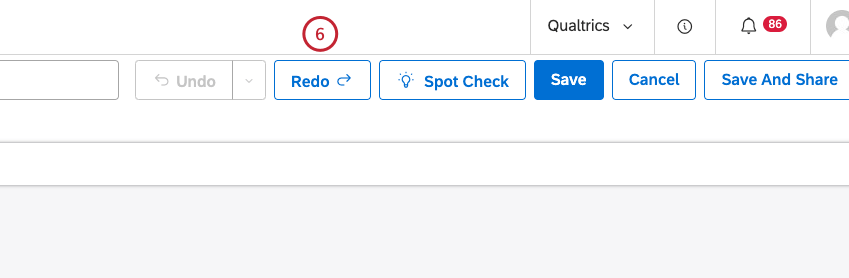
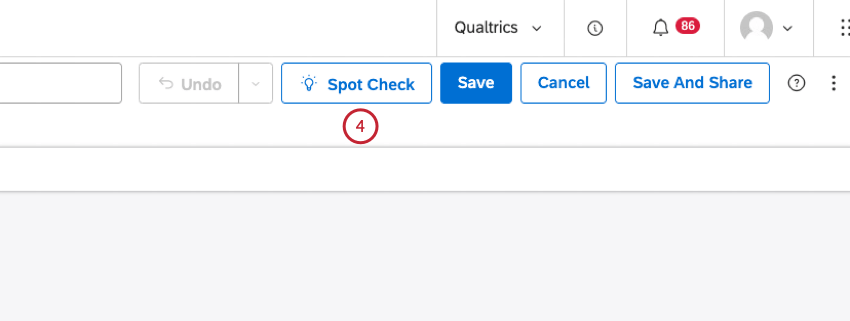
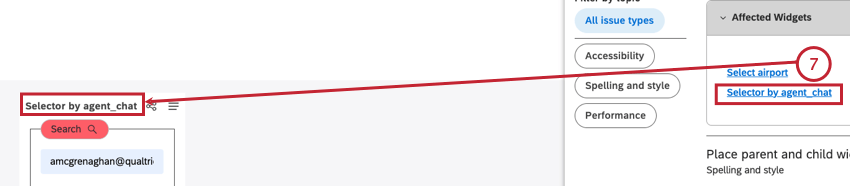
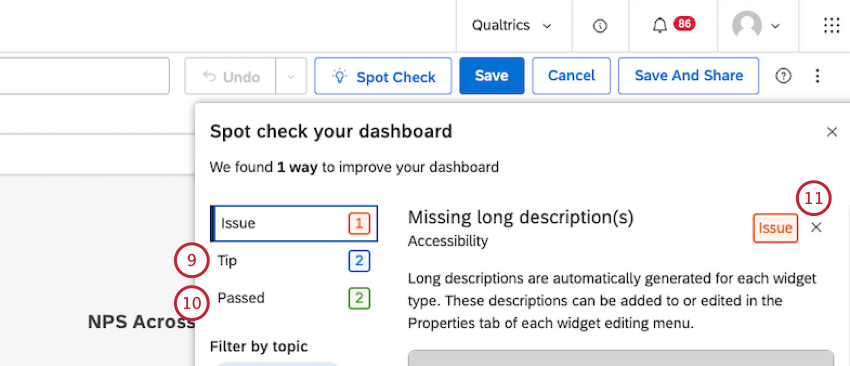
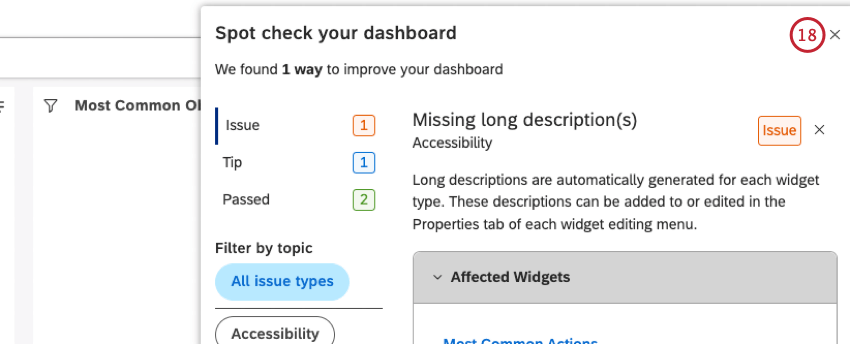
  6. Click Redo to redo the most recent edit that you chose to undo. Once you click Redo, the Undo button will appear.
    Redo button
  7. Click Save.

Using Spot Check

Attention: To use spot check to scan a dashboard, you must own or have edit rights for the dashboard.

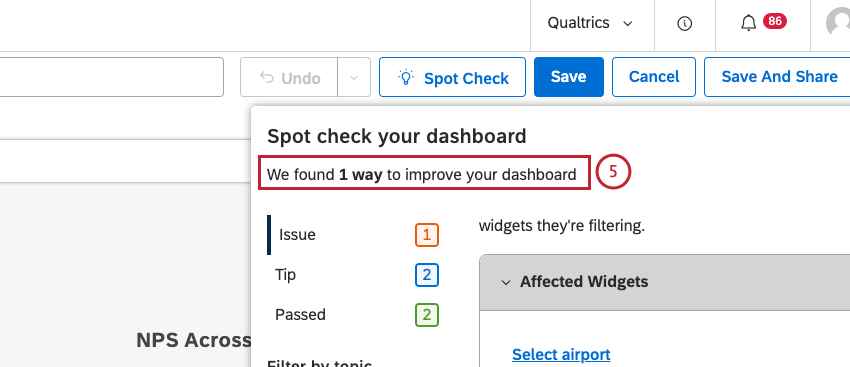
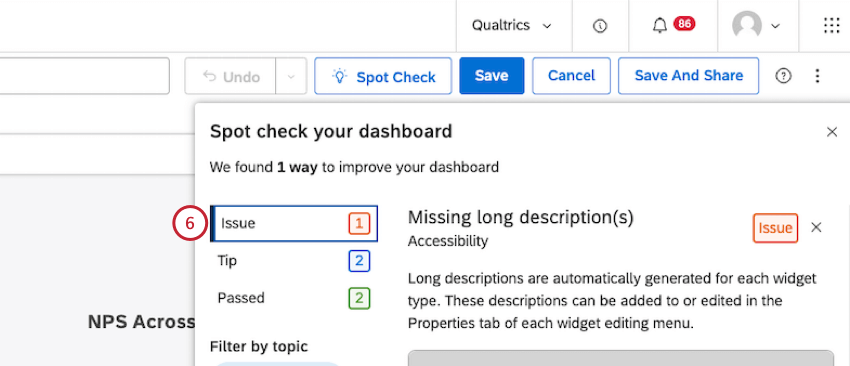
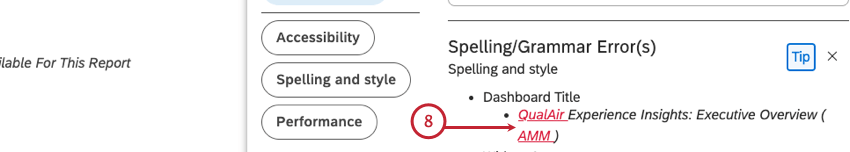
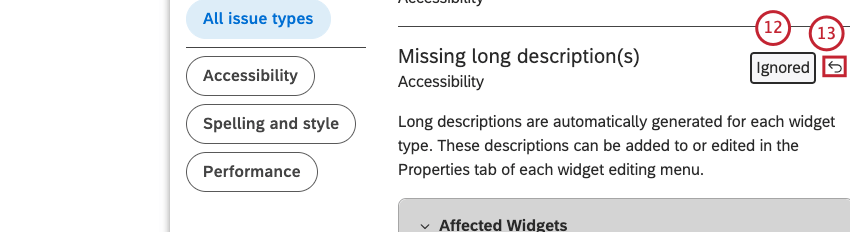
You can use spot check to scan dashboard content for common issues and leverage best practice tips to improve dashboard performance. This enables you to:

  • Ensure that the dashboard is accessible, polished, and performing efficiently.
  • Quickly troubleshoot issues and get back to editing the dashboard.
  • Catch issues before deploying a dashboard to a large audience.
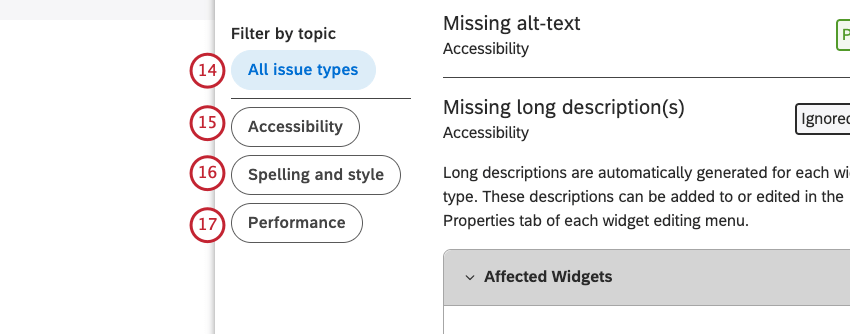
 

  1. Log into Studio.
  2. Navigate to the dashboard.
  3. Click the Edit button.
    Edit button in a dashboard
  4. Click the Spot Check button.
    Spot check button
  5. In the Spot check your dashboard window, you can see at a glance the total number of recommendations for improving the dashboard.
    Spot check your dashboard window
  6. Click Issue to view all the highest priority dashboard fixes that we recommend adjusting before publishing or sharing dashboards to a broader audience.
    issue is selected
  7. For each recommendation, you can click a link in the Affected Widgets section to be taken to the issue (for example, a missing long description) in the specific widget in the dashboard.
    clicking a link to see the corresponding problem
  8. Spelling and grammar errors are shown in red and underlined.
    spelling and grammatical errors
  9. Click Tip to view all the tips for improving the dashboard design or performance.
    tip and passed in the left sidebar of the spot check window
  10. Click Passed to view all the items that are configured correctly.
  11. You can click the X next to Issue or Tip to ignore suggestions that are not relevant for the dashboard.
  12. Scroll to the bottom of the Spot check your dashboard window to view the Ignored suggestion.
    undo button
  13. You can click the Undo button to move an ignored issue back to its original place in the list.
  14. Click All Issue Types to filter the scan results to show all accessibility, spelling and style, and performance issues and tips.
    window says fitler by topic: all issue types, accessibility, spelling and style, performance
  15. Click Accessibility to filter the results to show data visualization widgets that are missing long descriptions and image widgets that are missing alt text.
  16. Click Spelling and Style to filter the results to show dashboard title, widget title and text widget spelling issues, and style and layout tips, including widget positioning.
  17. Click Performance to filter the results to show tips to improve report speed and performance.
  18. Click the x at the top-right of the Spot check your dashboard window to close Spot Check.
    X to close spot check
  19. Make any edits that you wish to make to the dashboard based on the recommendations.
  20. Click the Spot Check button to reopen spot check. The results will update to reflect any edits you made.
    spot check button
  21. Click Save.
    save button

Filtering

Adding filters can help you focus on data especially important to you. Narrow down data by date, topics, and attributes, and save the filters you use the most. You can apply filters to specific widgets or to the entire dashboard.

For more, see: