
Participation Summary Widget (EX)
What's on this page
Qtip: Unsure which Employee Experience projects have this widget? See our Widget Types and Project Compatibility table.
About Participation Summary Widgets
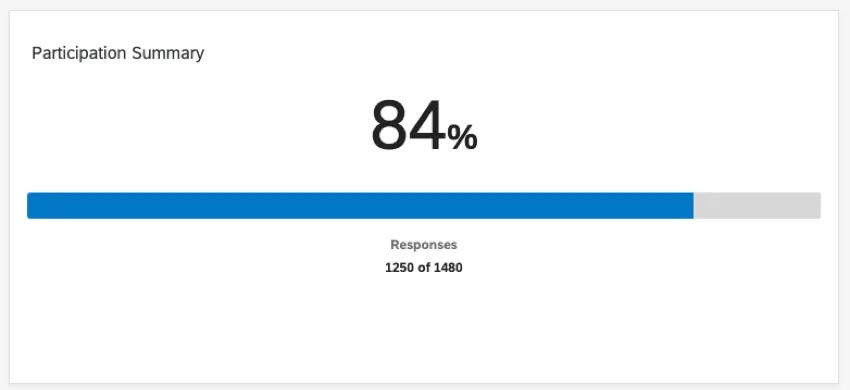
The participation summary widget displays the percentage of participants who answered your employee survey.
The participation summary widget will calculate the percentage of participants who completed the survey, using the total number of participants in the project as the denominator. Whenever you want to update your participation summary to match newly uploaded participants, you will need to Update Invited Counts in the Participants tab. This can be done automatically by message automations in Lifecycle projects.
Your participation summary will adjust to your dashboard filters.
Qtip: Participation Summary widgets do not support breakouts.
Attention: Participation summary widgets can only be calculated for the primary data source in a dashboard. If a secondary data source is added to the dashboard, the widget will only show the participation rate for the primary data source.
Attention: The participation summary widget can only be filtered by an Org Hierarchy or participant metadata that is mapped as a Multi-Answer Text Set field type. Additionally, this widget cannot be used on any pages that contain a drill down filter.
Qtip: You cannot filter participation summary widgets by metadata fields that have been recoded. To filter by these fields, you will need to do one of the following:
- Edit the metadata field values directly in the participant window so they match the recoded values.
- Add a new metadata field with your recoded values and map the new field into your dashboard.
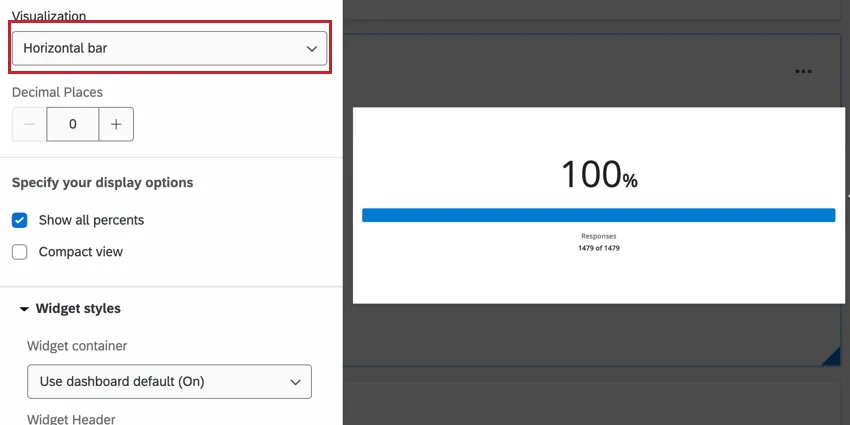
Visualizations
You have 2 visualization types to choose from, which each can be displayed in a compact or non-compact view.
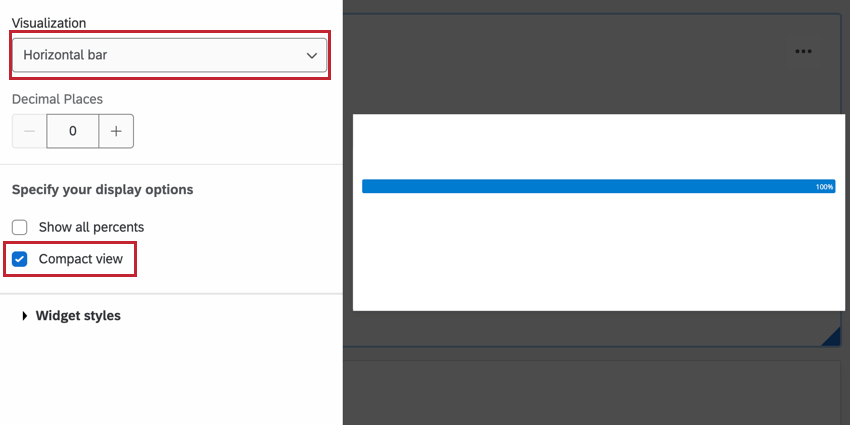
Horizontal Bar: The default option. Engagement scores will be displayed as a horizontally stacked bar with the engagement score as a large number on top.
When Compact View is selected, the visualization will hide the large number on top and the response counts on the bottom.
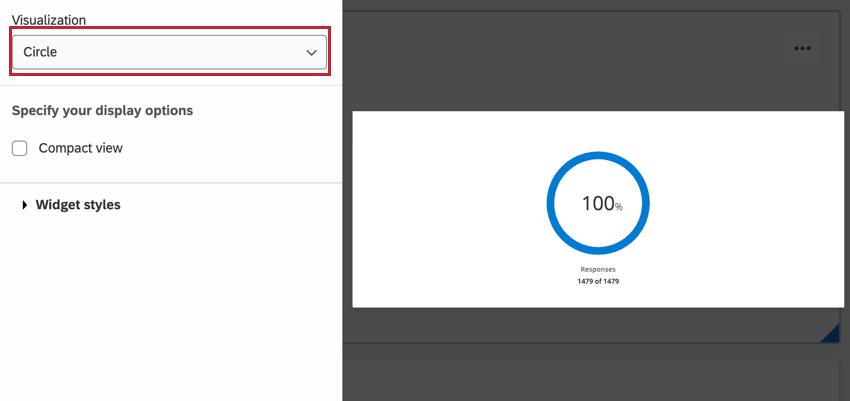
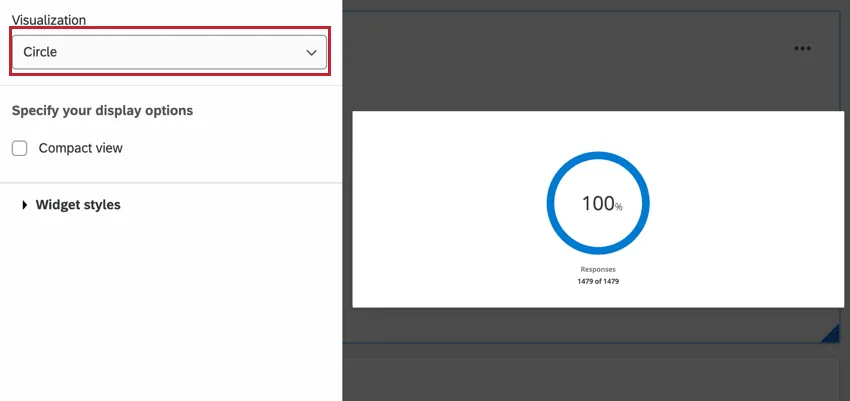
Circle Visualization: This view switches the engagement score display to a pie-chart style circle with the engagement score in the center. Response counts will be displayed below the circle.
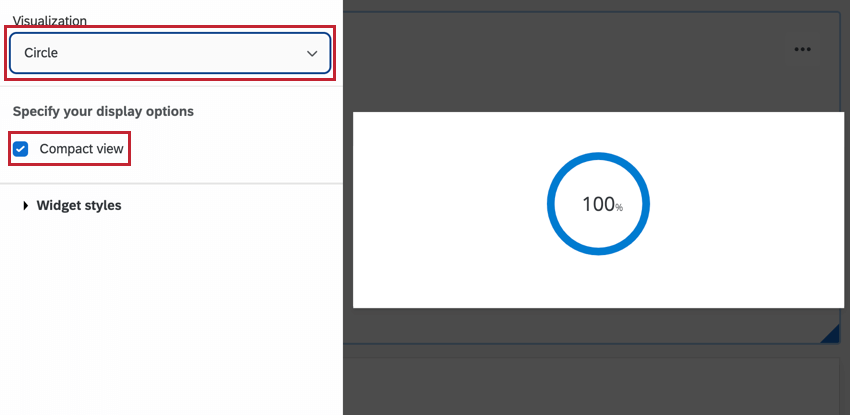
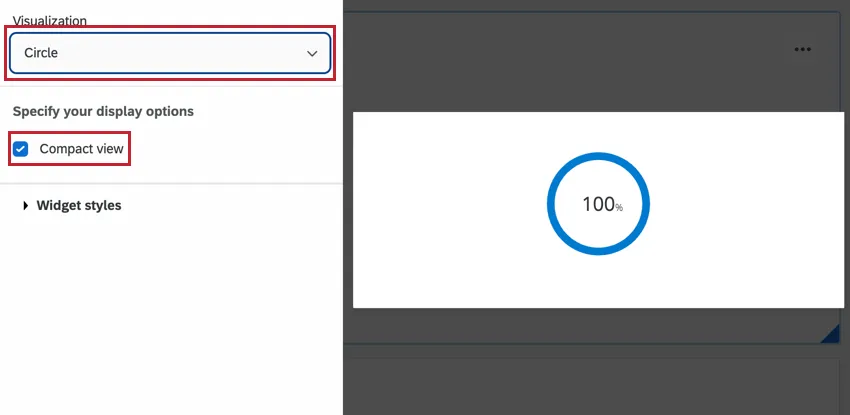
When Compact View is selected, response counts will be hidden.
Behavior with Multiple Lifecycle Responses
You can allow Lifecycle participants to submit multiple responses based on metadata criteria you set. When you create a participant summary widget for this kind of project, the widget will show the number of responses as:
- Numerator: The number of responses.
- Denominator: The number of people in the project who haven’t answered the survey but still match the metadata criteria.
Example: You send an invite to 250 participants whose “Employment Type” metadata is set to “Part-Time.”
- 50 participants reply to the survey.
- No one’s “Employment Type” metadata is edited.
Thus the response rate would be shown as 50 / 250.
Example: You send an invite to 500 participants whose “Start Date” metadata is set to “January.”
- 100 participants reply to the survey.
- 200 participants have their metadata changed so their “Start Date” is no longer “January.”
- 500 – 200 = 300 participants whose “Start Date” is still equal to “January.”
Thus the response rate would be shown as 100 / 300.
FAQs
Why didn't my Participation Summary widget in my EX dashboard change when I updated my participants?
Why didn't my Participation Summary widget in my EX dashboard change when I updated my participants?
Why is my Participation Summary widget in my EX dashboard showing a different percentage than what I calculated? I already updated my invited counts.
Why is my Participation Summary widget in my EX dashboard showing a different percentage than what I calculated? I already updated my invited counts.
That's great! Thank you for your feedback!
Thank you for your feedback!