
Results vs. Reports
Suite
Strategy & Research
Product
Qualtrics
What's on this page
Qtip: There is a new version of Results available. To opt in to the new Results Dashboards, navigate to the Results tab and click Try it now.

About Results vs. Reports
Qtip: If you do not have the Results or Reports tab available to you and the survey has been shared with you, contact the survey owner to request that they give you permission to access the survey’s reports. If you own the survey and don’t have the tab available, contact your Brand Administrator so they can enable the permission on your account.
You can build reports under the Results tab or the Reports tab, each with a separate purpose:
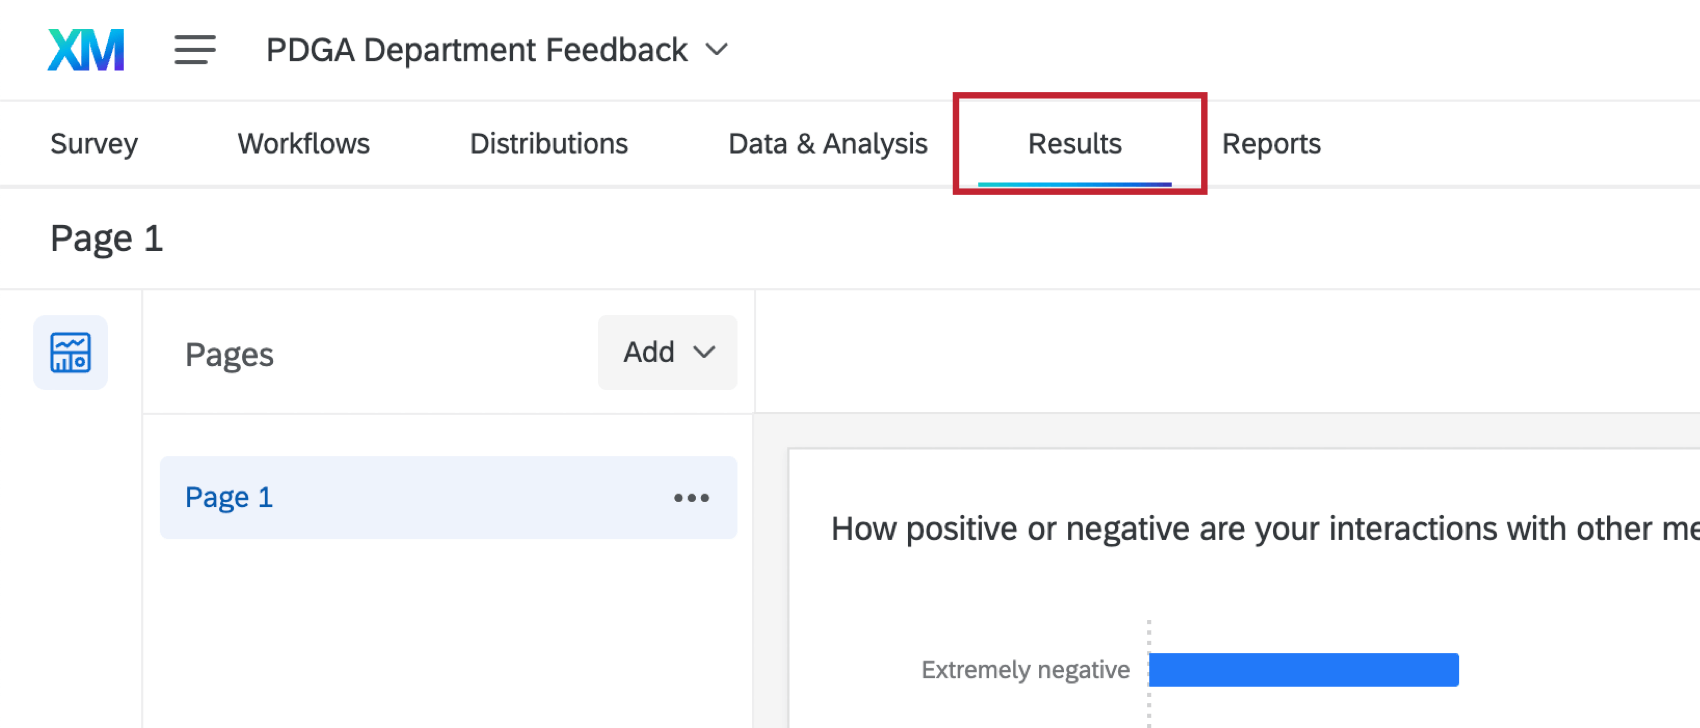
Results-Reports Basic Overview: New to reporting or need to see real-time Results fast? Instantly generate question-based report pages and visualizations, displaying Results that you can analyze, filter, style, edit, enhance, and share with a minimum of effort.
Example: Results are great for at-a-glance reporting. For example, say you asked about which products your customers use. You want to know which ones are the most popular. Results provides easy-to-read tables and graphs that provide this kind of basic information.
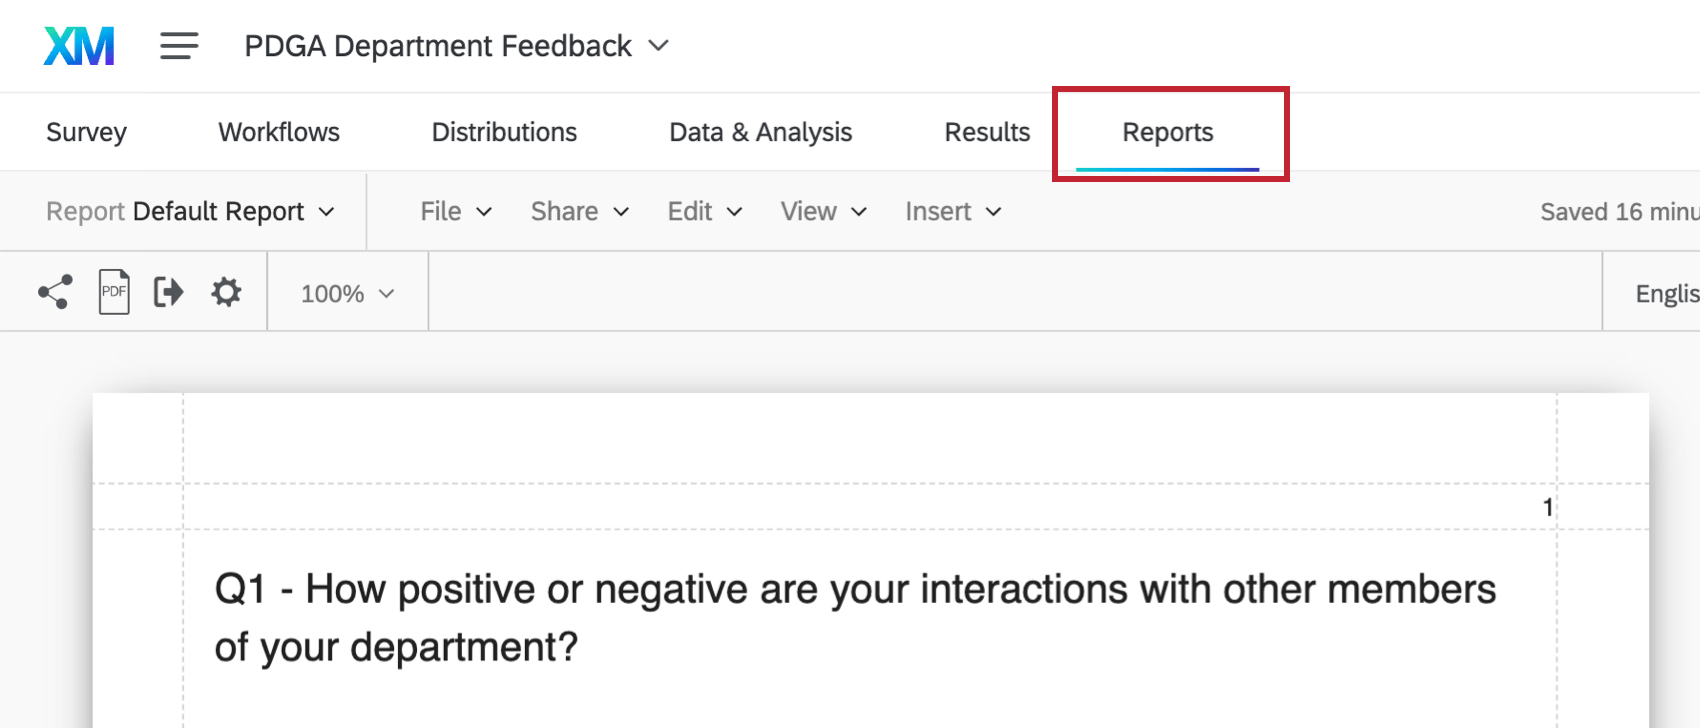
Advanced-Reports Basic Overview: Designing your Reports from scratch? Design eye-popping Reports for your important research sharing events.
Example: If you want to create and distribute data with company logos, specific letterheads, and more customizable tables and graphs, Reports is the better tool.
Qtip: If you are new to Qualtrics or are less than familiar with Reporting, start with the Results-Reports Basic Overview.
That's great! Thank you for your feedback!
Thank you for your feedback!