
Dashboard Basic Overview (EX)
What's on this page
Qtip: This page describes functionality available to Engagement, Lifecycle, and Ad Hoc Employee Research projects. For more details on each, see Types of Employee Experience Projects.
About Dashboards
Dashboards are the principal reporting tool for Employee Experience projects. Each dashboard can contain multiple pages which, in turn, are made up of widgets that visualize your data. Dashboards can be shared with other dashboard users within your organization and set to only show them the information to which they should have access. For more information about widgets, visit the Widgets Overview page.
Qtip: This page is targeted towards Brand Administrators, EX Administrators, and Employee Insights Admins. If you do not have editing access to a dashboard, see the Dashboard Viewer support page.
Qtip: For optimal use, dashboards are intended to be built after collecting EX responses.
Navigating Between Dashboards
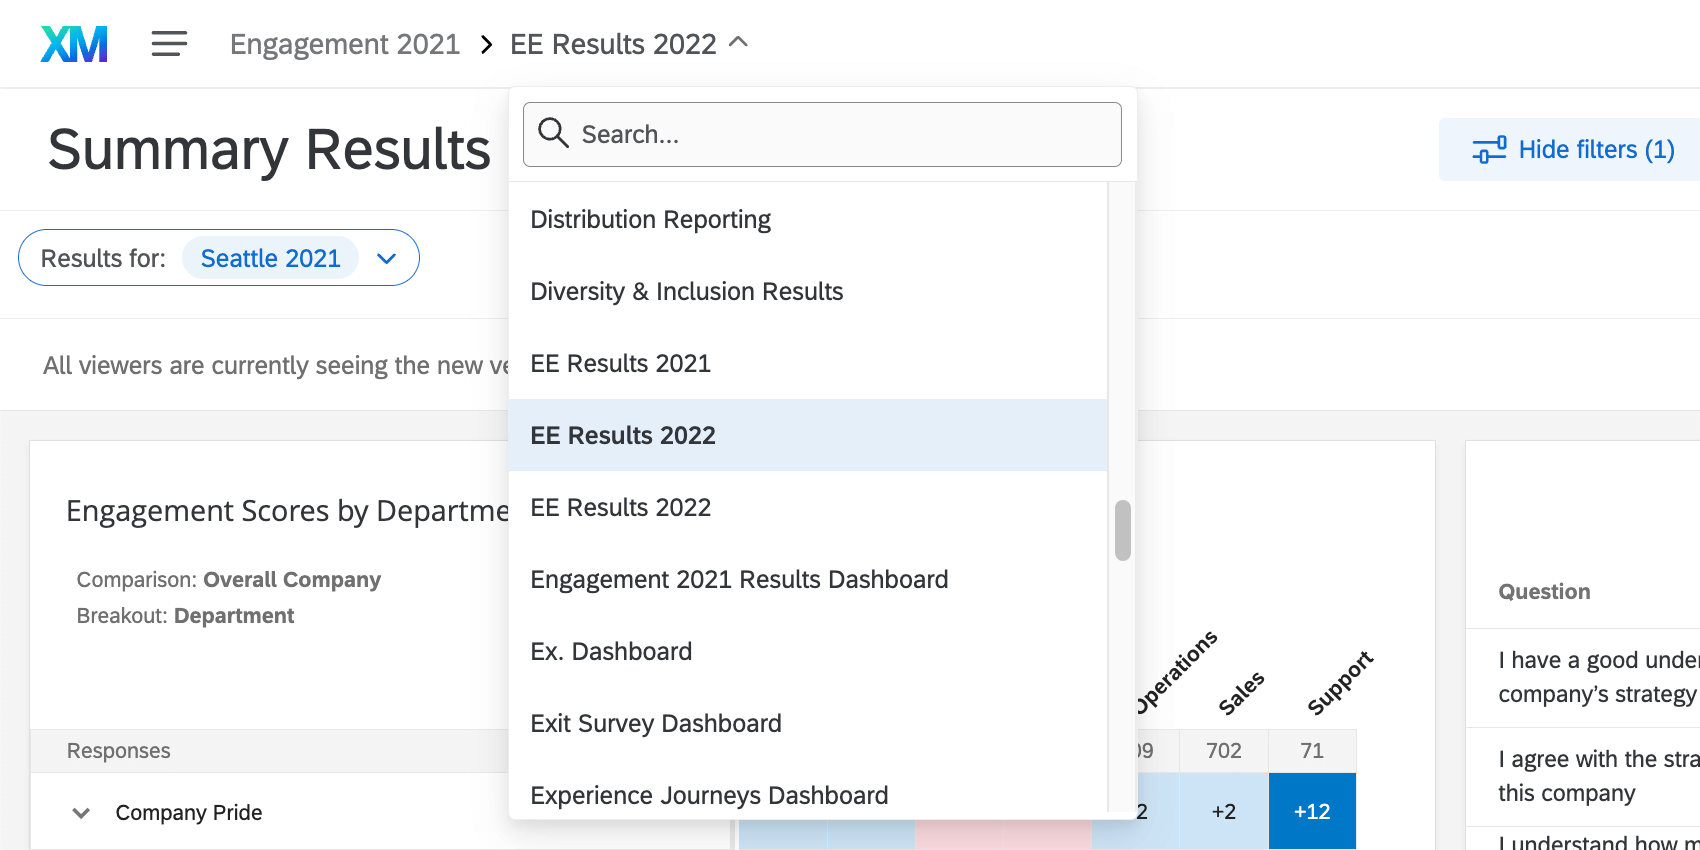
You can easily navigate to any other dashboard available in your account without exiting your current dashboard. To do so, click the dashboard’s name in the upper left-hand corner and select any other dashboard name. This will allow you to edit and view other dashboards quickly and efficiently.

Creating and Managing Pages
Adding pages to your dashboards allows you to effectively organize your data and widgets in whatever way you would like. To create a new page, click the dropdown showing the name of the page you’re currently on, then click Add in the panel that opens.
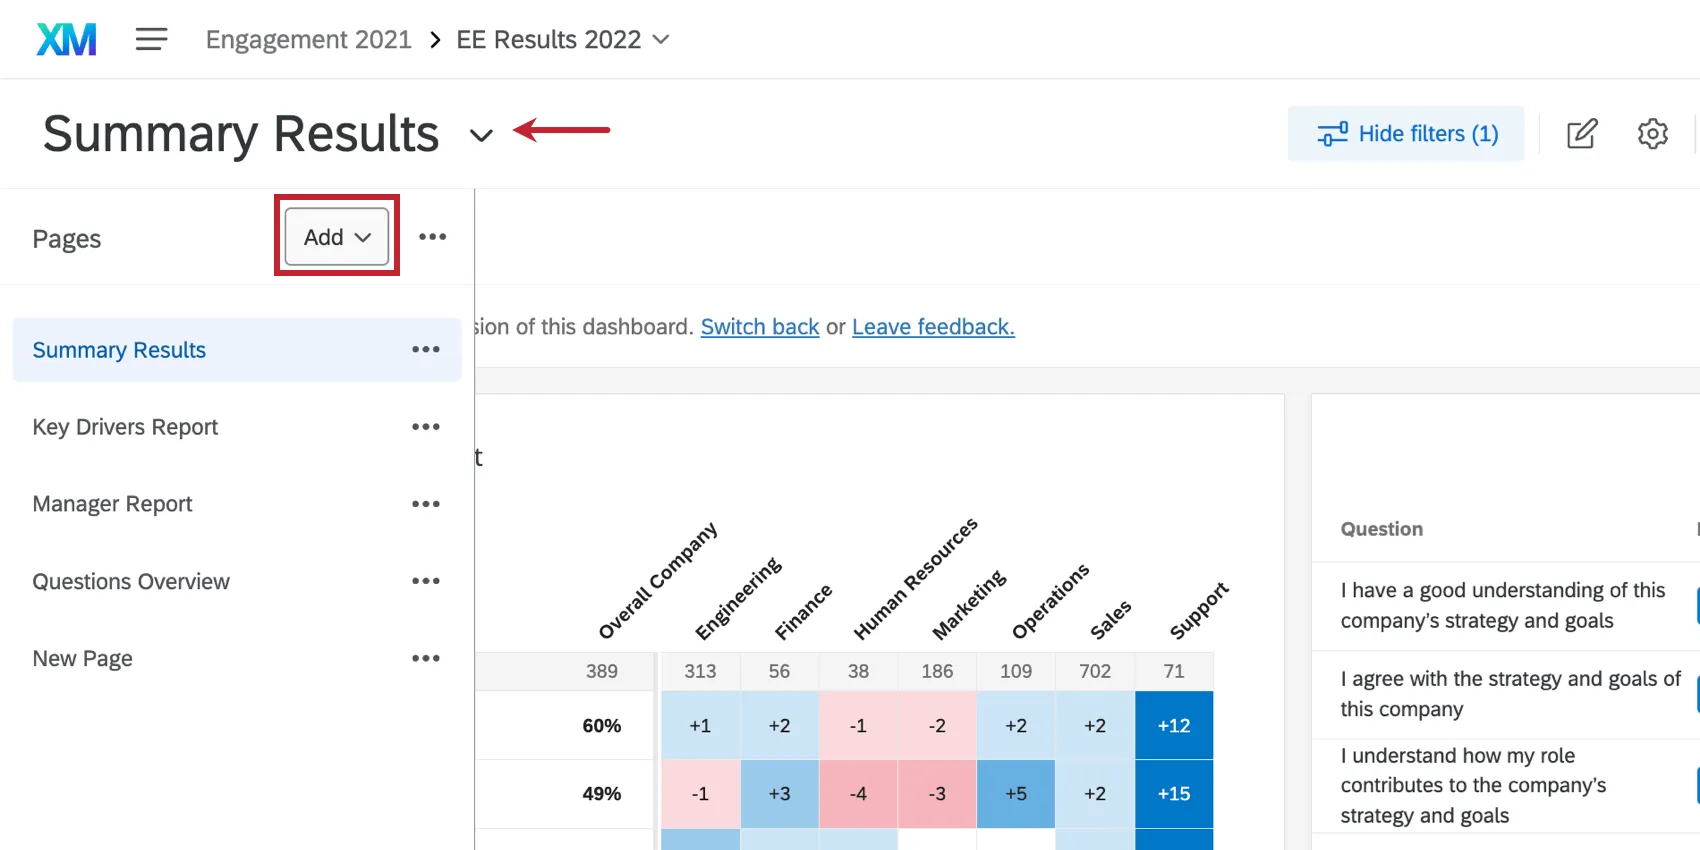
You can add the following types of pages:
- Blank Page: A regular dashboard page for adding widgets.
- Private Page: Same as a regular dashboard page, but only the creator can see it. Private Pages are useful for testing page designs and for internal reporting. Attention: Private pages can’t be made public, but you can make a public copy of a private page.

- Action Planning Page: A dashboard page used to report on action planning.
You can change the order of your pages by dragging and dropping the pages on the page navigation.

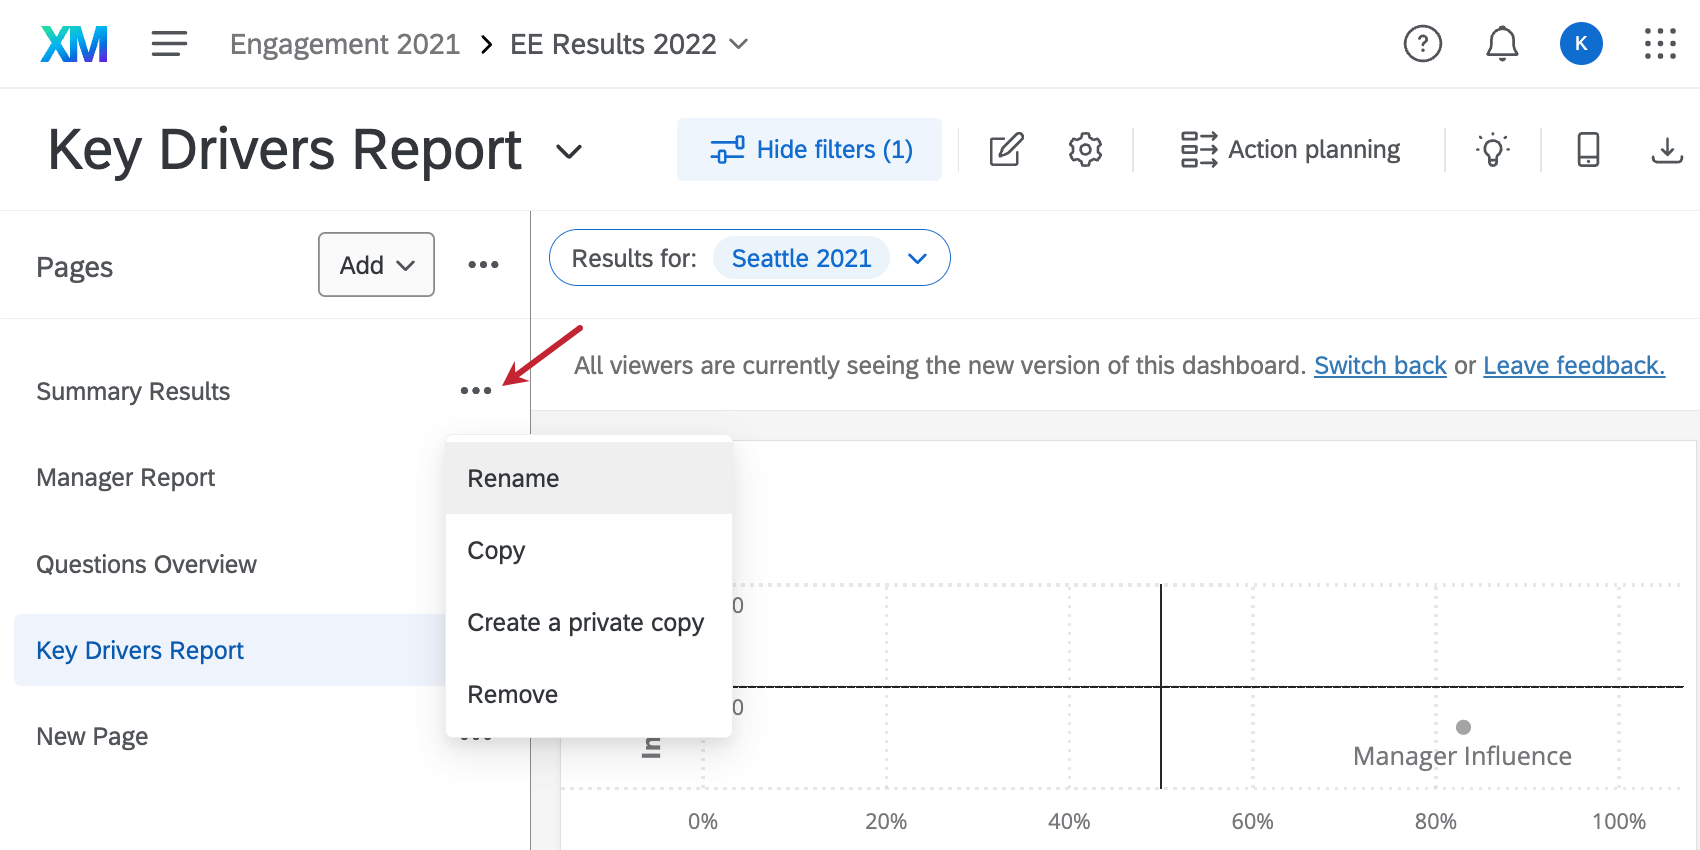
Page Options
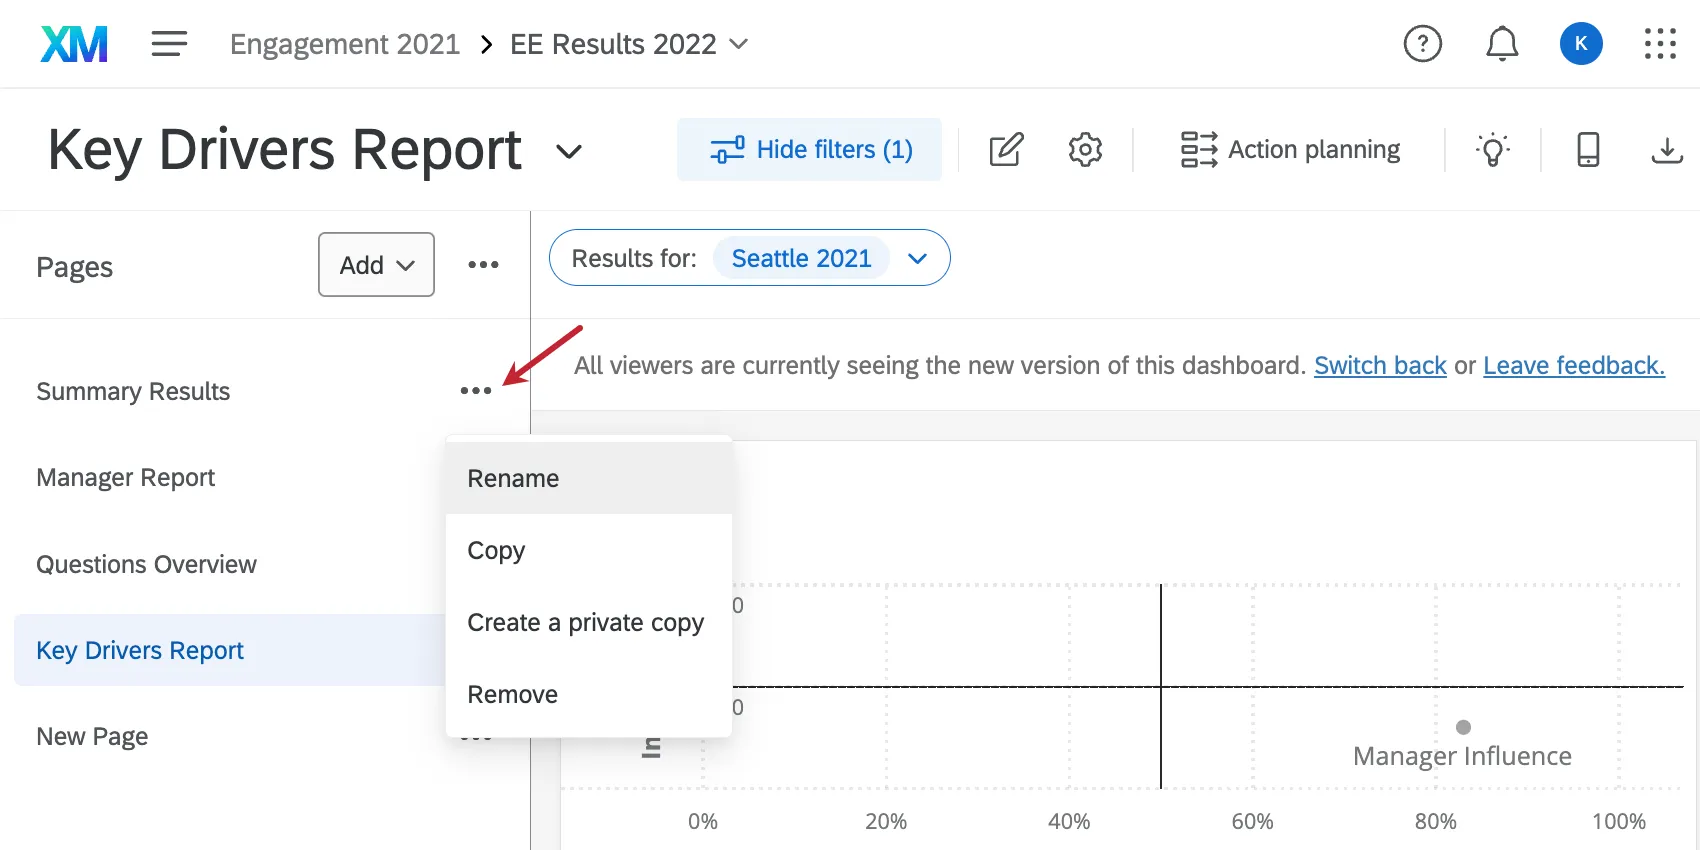
- Rename: This will allow you to rename the current page.
- Copy: This will duplicate the current page, including all of its widgets and settings.
- Make Private Copy: This will create a private copy of the page that only the creator can view. Private pages are useful for testing page designs and for internal reporting. Attention: Private pages can’t be made public, but you can make a public copy of a private page.
- Remove: This will remove the current page from your dashboard. In addition to the widgets on the page, all applied settings and filters will be lost and irretrievable.
You cannot use these options to copy a page from one dashboard to another; pages can only be copied within the same dashboard. If you need to use the same page elsewhere, try copying an entire dashboard instead.
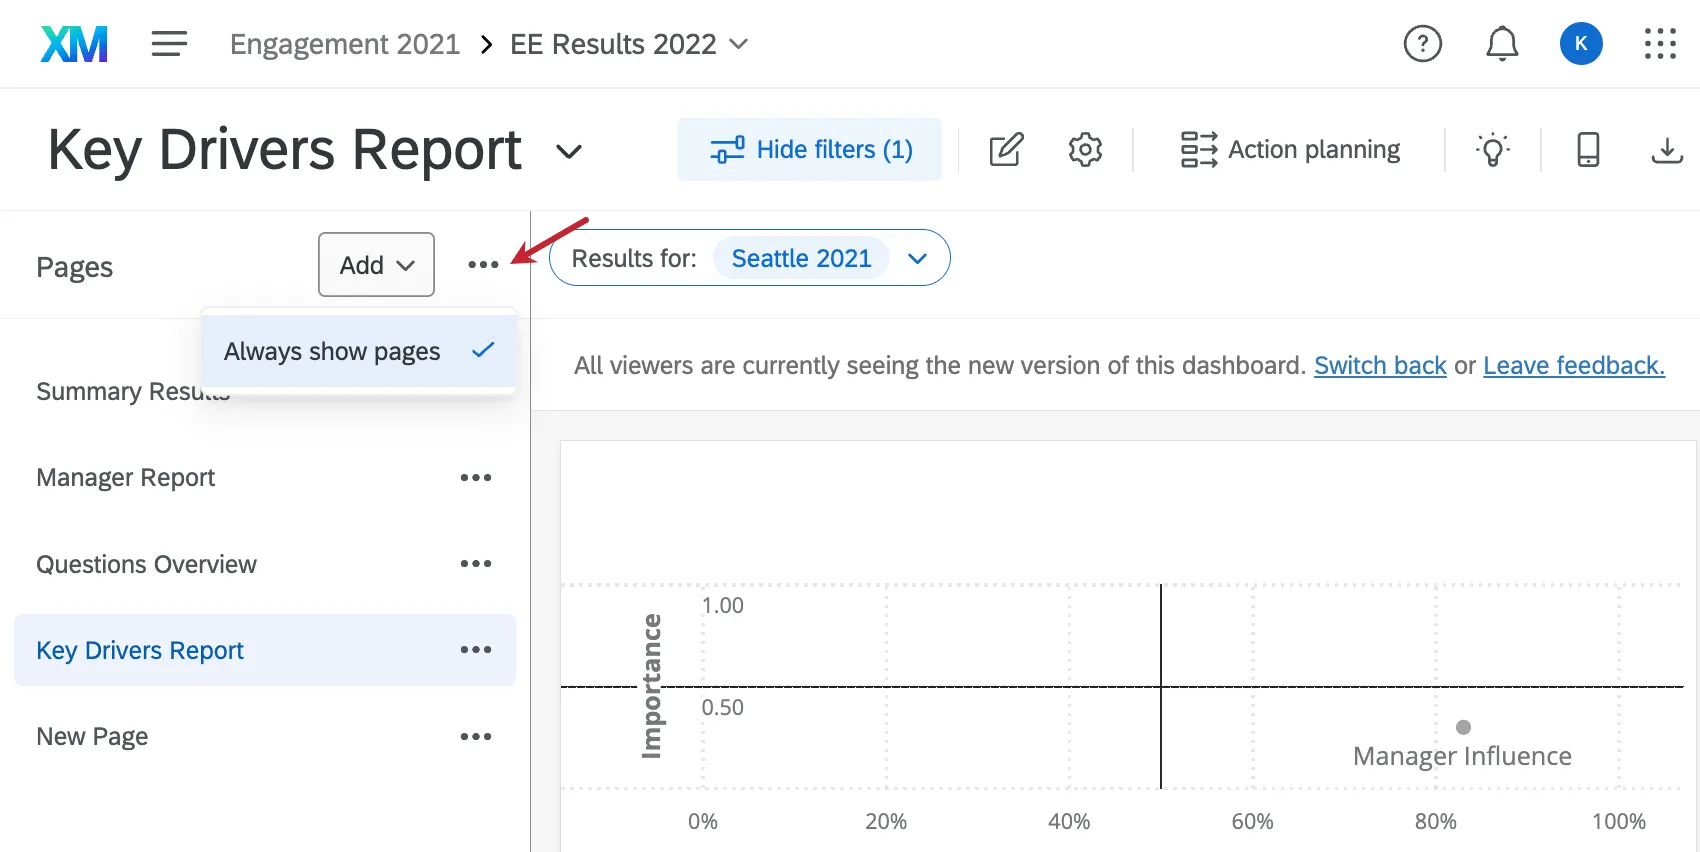
Qtip: If you’d like to display your page list all the time, click the options next to the Add button, and select Always show pages. This setting applies to all of the dashboards you have switched to the new experience. You can deselect this option any time.
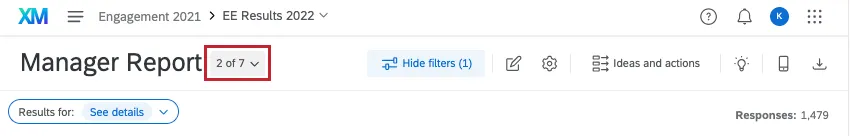
Qtip: When your pages aren’t pinned, you’ll see the page number of total pages next to each page name. For example, here we see the page “Manager Report” is page 2 out of 7 total.

Making Dashboards Available for Export
You can make your dashboard pages available for you and your users to export as PDF, JPG, PPTX, or DOCX files. See Exporting Data from EX Dashboards for more details.
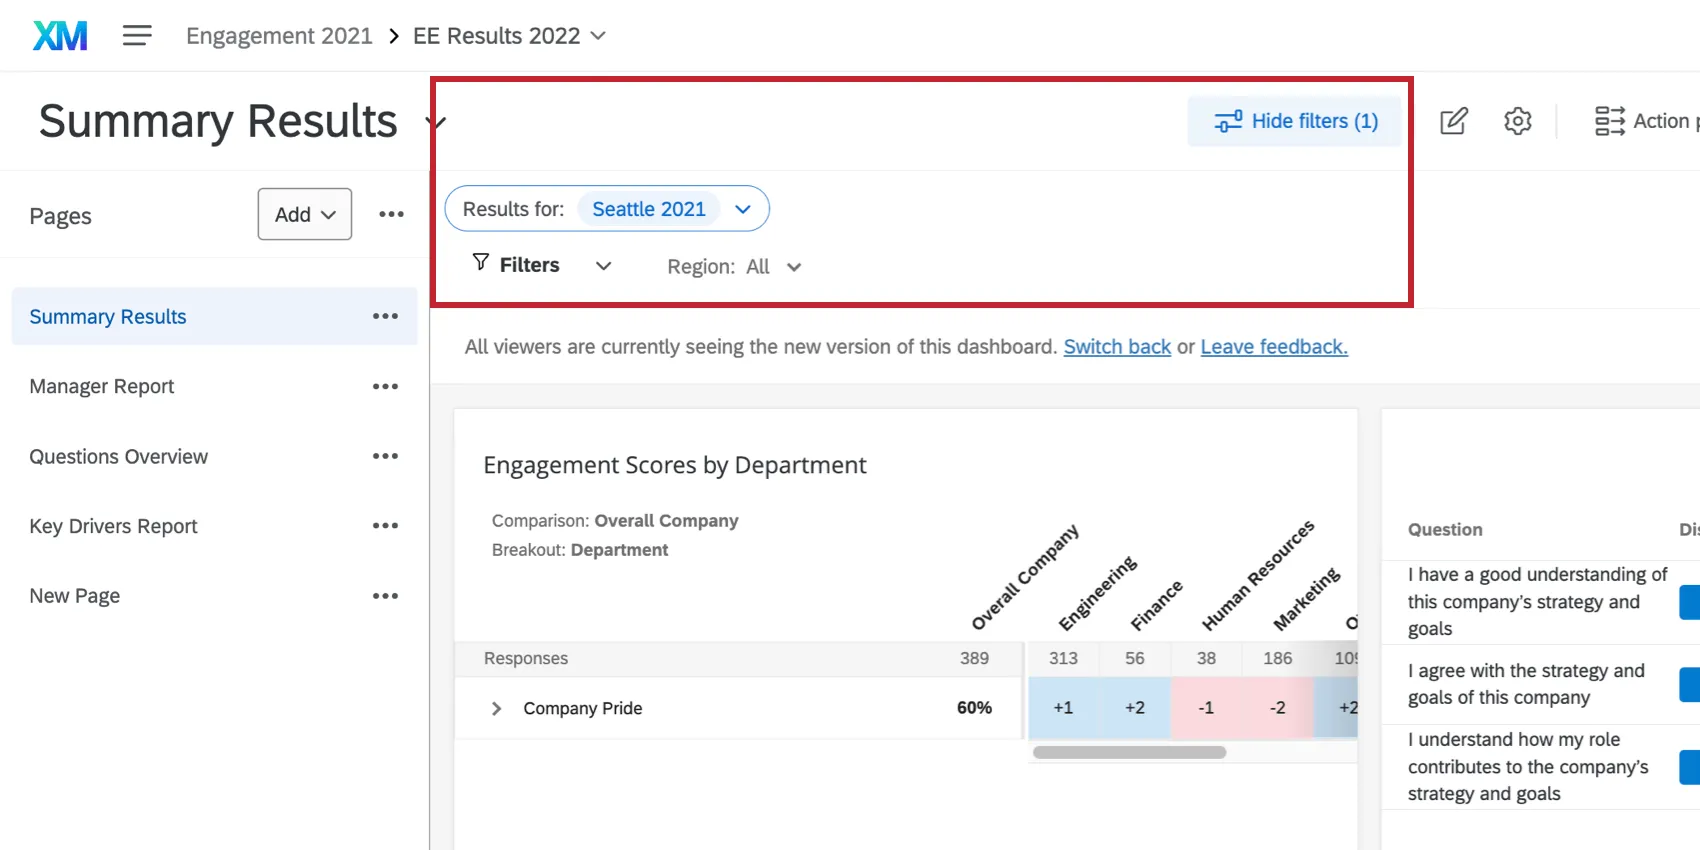
Filtering Your Dashboard
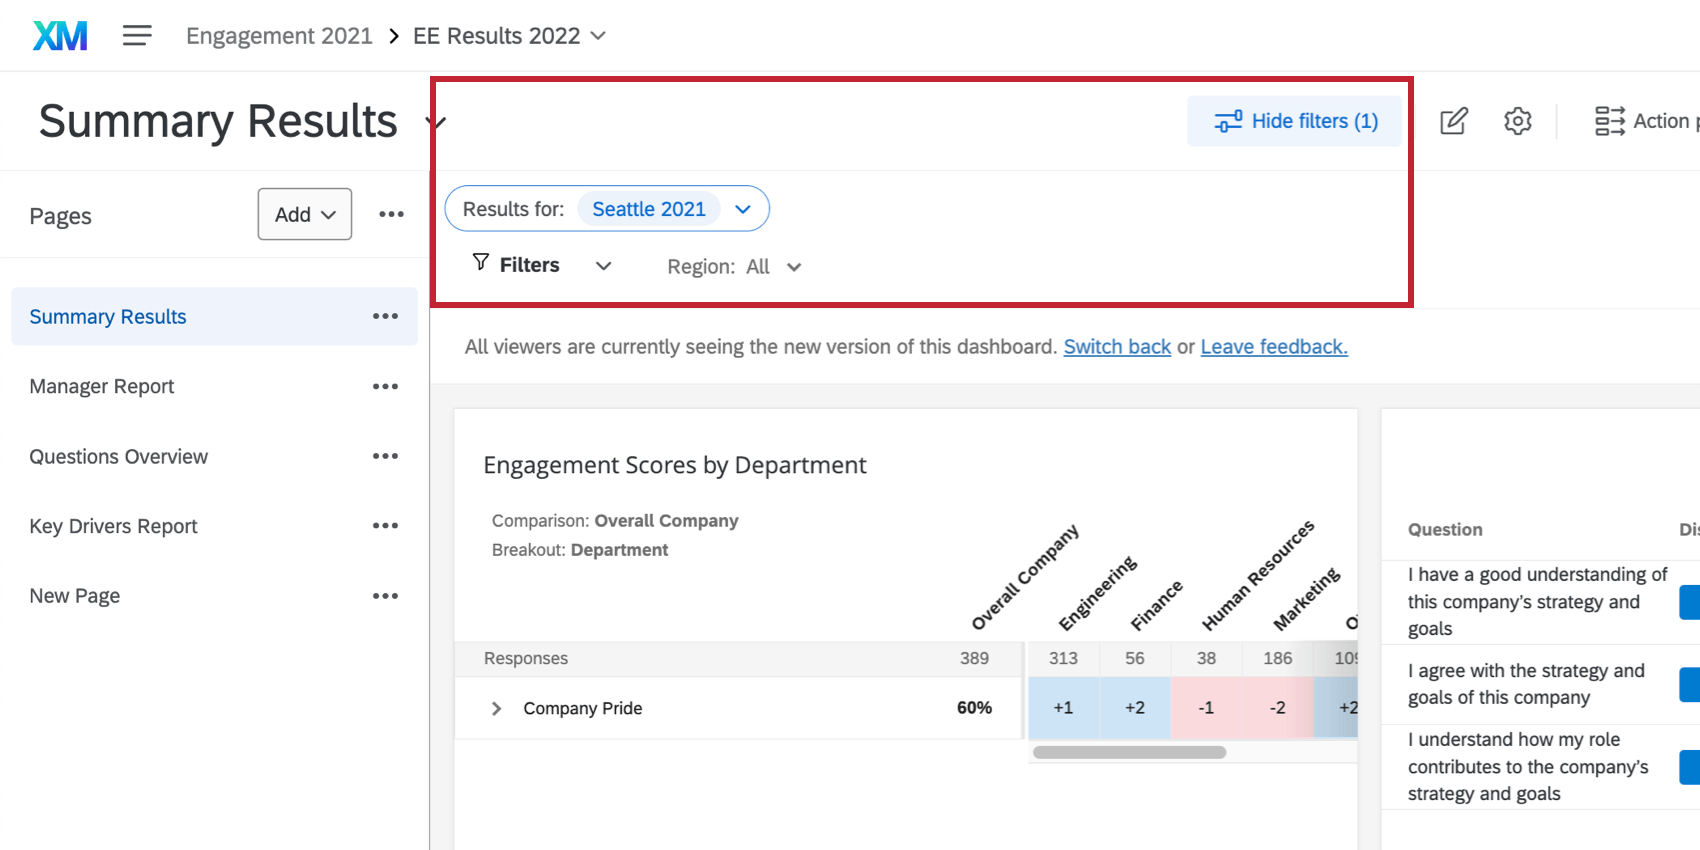
You can filter your dashboards by applying a filter to every widget on a page or by applying filters to individual widgets. This allows you to dive into the data and find trends that you would not be able to see with the data in aggregate alone.
Dashboard exports generally respect the default filters set for the dashboard, unless you have adjusted the filters. The page you export will respect any filters you currently have applied instead of the filters set as the default. If you are exporting multiple pages of the dashboard, only the page you’re currently on will respect filters you currently have applied; otherwise, the additional pages of the export will revert to the default filters for the page.
See the Filtering Dashboards support page for more details on dashboard-wide filters. For widget-level filters, see the Widgets Basic Overview.
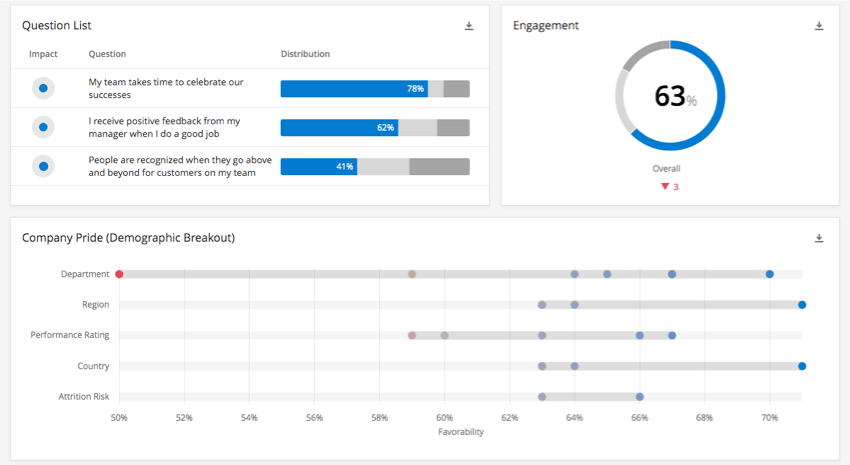
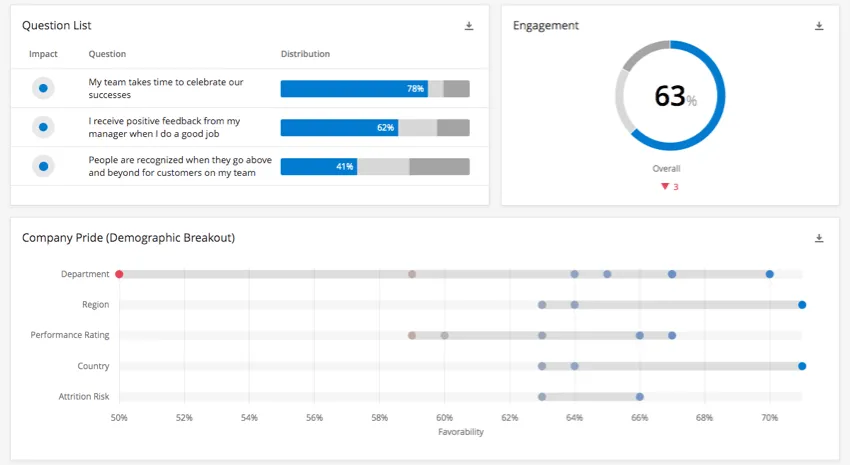
Widgets
Widgets are the graphs and tables that illuminate the data for everyone who visits the dashboard, and there are many different kinds to suit your unique reporting needs. To learn more about adding and customizing widgets, see the Widgets Basic Overview.
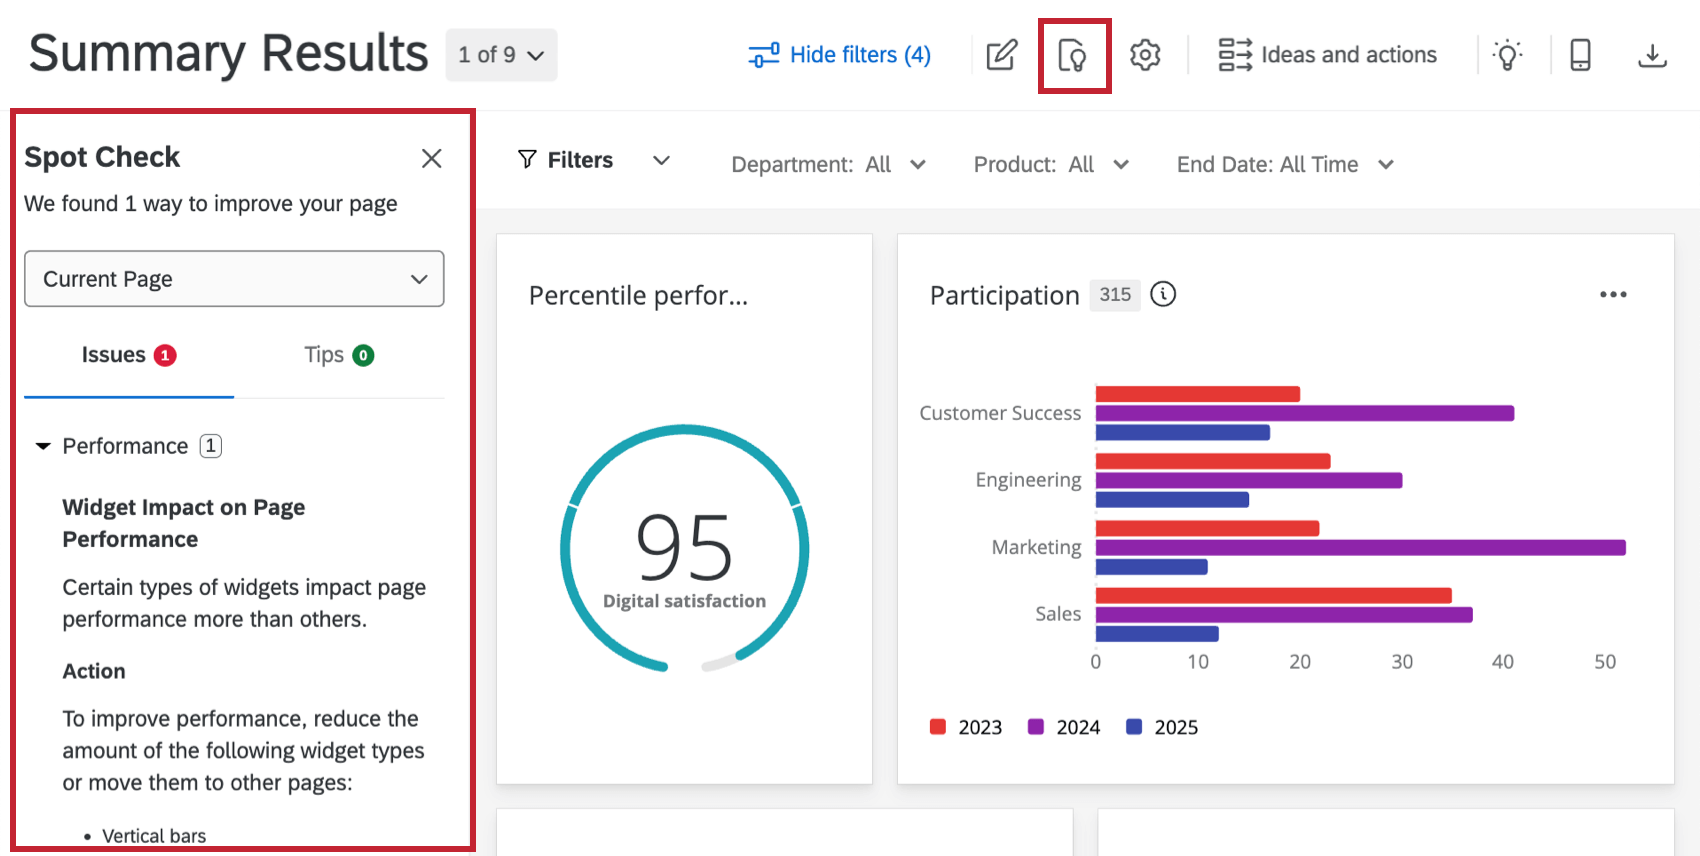
Dashboard Spot Check
Spot Check provides recommendations for improving your dashboard pages. Click the spot check button at the top of your dashboard to open it.

Recommendations are divided into 2 categories:
- Issues: Any errors or problems that may impact your dashboard. Issues are accompanied by an action you can take to resolve them. Example: You are getting close to the widget limit for a page, which may impact the success of dashboard exports.

- Tips: Suggestions to improve dashboard performance or accessibility. Example: Your page includes large images that exceed the recommended resolution, which may impact how they appear on the dashboard and in exports.
Once you’ve taken action on a specific issue or tip, the recommendation will be removed. Use the dropdown to view suggestions for the entire dashboard, or for the dashboard settings. Note that when dashboard is selected, tips and issues for individual pages are not shown.
Action Planning
Action plans are initiatives you can create based off your lowest areas of engagement. They allow you to assign tasks and plan resolutions to some of your company’s biggest issues with employee experience. For example, if employees disagreed that they were adequately trained, a larger-scale action plan could be to implement a new training program.
To learn more about all the steps required in the action planning process, see the Action Planning Basic Overview support page.
Mobile Preview
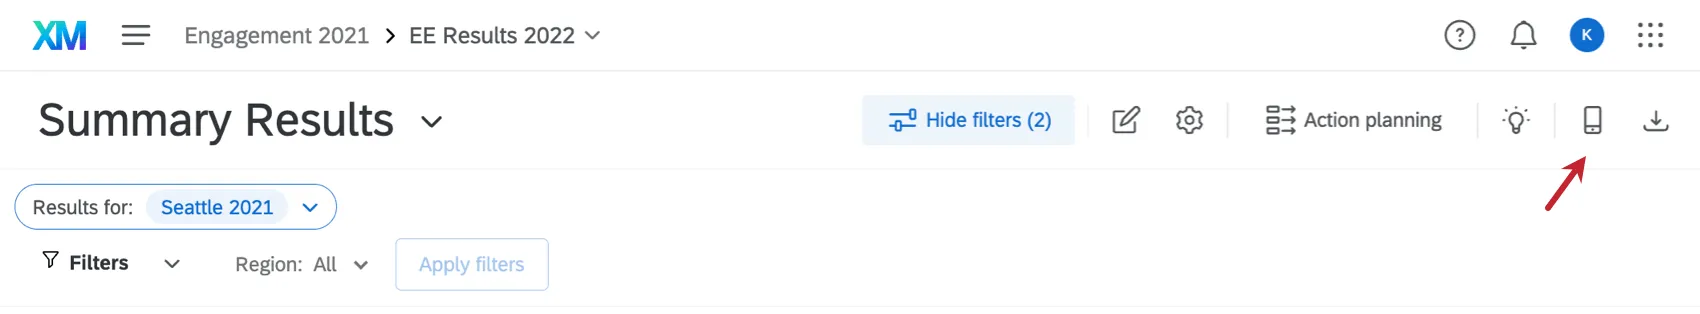
When viewing a dashboard in the XM App, it’s important to make sure that your dashboard is formatted for mobile. Mobile preview lets you see how your dashboard will look on a mobile device from the convenience of your computer browser.
To see the mobile view of your dashboard, click the mobile preview button in the dashboard toolbar.
While previewing the mobile dashboard view, you can do the following:
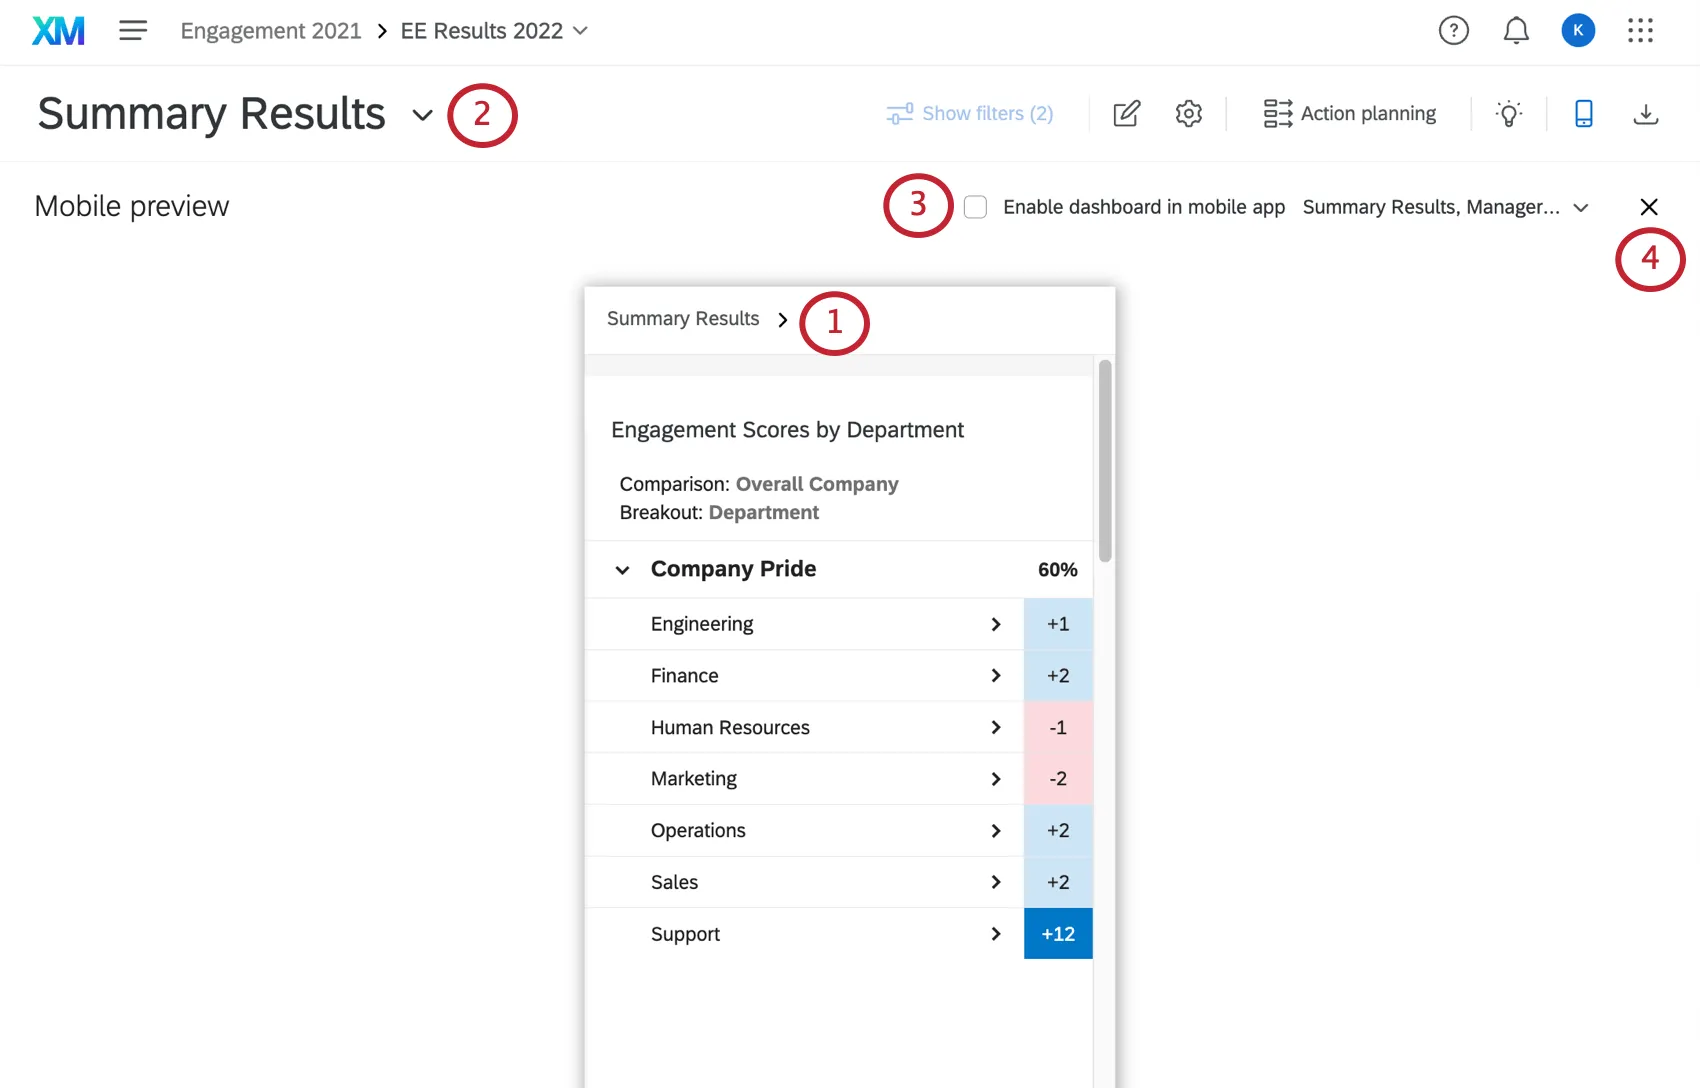
Qtip: You cannot edit your dashboard while previewing the mobile display. Exit the mobile preview to edit your dashboard.
FAQs
Why are my response rates showing up wrong in my widget in my EX dashboard?
Why are my response rates showing up wrong in my widget in my EX dashboard?
If I have two sources mapped in my Dashboard Data, how can I make it so this widget only displays data from a single source in my EX dashboard?
If I have two sources mapped in my Dashboard Data, how can I make it so this widget only displays data from a single source in my EX dashboard?
The count in my Number Chart widget does not match the count for the same value that I see in other widgets in my EX dashboard. Why is this?
The count in my Number Chart widget does not match the count for the same value that I see in other widgets in my EX dashboard. Why is this?
When a participant logs into his EX dashboard, he can’t see any data and gets an error message saying he doesn’t have permission to access the dashboard. How do I fix this?
When a participant logs into his EX dashboard, he can’t see any data and gets an error message saying he doesn’t have permission to access the dashboard. How do I fix this?
I opened my EX dashboard and it says there is no data when I know there was data yesterday. What happened?
I opened my EX dashboard and it says there is no data when I know there was data yesterday. What happened?
- Check to make sure that you don’t have a filter selected. If you select a filter value as the administrator when using Enable Editing on the dashboard, that filter selection will be applied to the entire dashboard. If the filter value is coming from a sensitive field, that filter may not be visible on all dashboards for dashboard viewers to use. Simply select All as the filter value when using Enable Editing so that no filter view has been applied.
- If you have made changes to your participant list after constructing the dashboard, those changes won’t automatically refresh in the dashboard. To refresh the dashboard with changes in Metadata or participants, you can run an Metadata update. Navigate to the Participants tab. Using the Tools menu, select the option to Update All Responses With Current Metadata. The final step is to update data in the dashboard itself. To do this, Enable Editing on the dashboard and find the Response Rates widget. Use the option Update Invited Counts to refresh the dashboard data. This may take a few minutes, but it should update your dashboard with changes to your Metadata or hierarchy.
The count of responses on the Response Rates widget and/or Participant Summary widget doesn’t match the expected response count in my EX dashboard. How can I fix this?
The count of responses on the Response Rates widget and/or Participant Summary widget doesn’t match the expected response count in my EX dashboard. How can I fix this?
I have some comparisons displayed on my EX dashboard, but they aren’t matching the historical data like I would expect. How do I fix this?
I have some comparisons displayed on my EX dashboard, but they aren’t matching the historical data like I would expect. How do I fix this?
Next, check to make sure the comparison is correctly set up in the Settings tab of your new dashboard. Check the Comparisons section to confirm that the source of the survey is your historical project. If you have a filter in place on your comparison, be sure to check that as well.
Lastly, if you are comparing org hierarchies, make sure that your hierarchies are mapped. If they haven't been mapped, map your hierarchies. Then, Update All Responses With Current Metadata in both the historical and current project after mapping the hierarchies.
I made a change to my EX dashboard, but when I came back later the change wasn’t reflected. Why is this?
I made a change to my EX dashboard, but when I came back later the change wasn’t reflected. Why is this?
Additionally, sometimes the dashboard will stay cached a certain way in your browser. If the above option doesn’t work for you, clearing your browser’s cache and cookies or accessing the dashboard from another browser/computer will fix the issue.
What are EX Dashboards?
What are EX Dashboards?
That's great! Thank you for your feedback!
Thank you for your feedback!