
Grouping Data (Studio)
What's on this page
About Grouping Data in Studio
When building a dashboard in Studio, you can specify what data you want to include in the dashboard. You can limit the data in a report by grouping, sorting, or filtering your data.
There are a variety of groupings you can use for your data. This page covers how to group your data by these different groupings.
Grouping Data in a Widget
Qtip: You cannot group data in metric or feedback widgets.
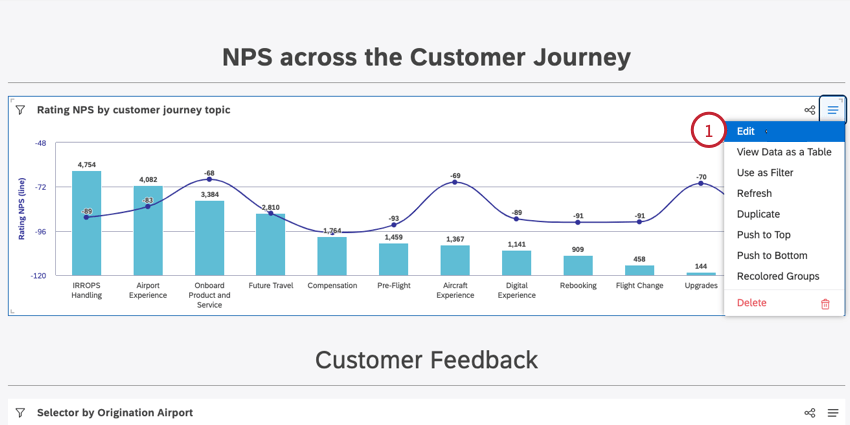
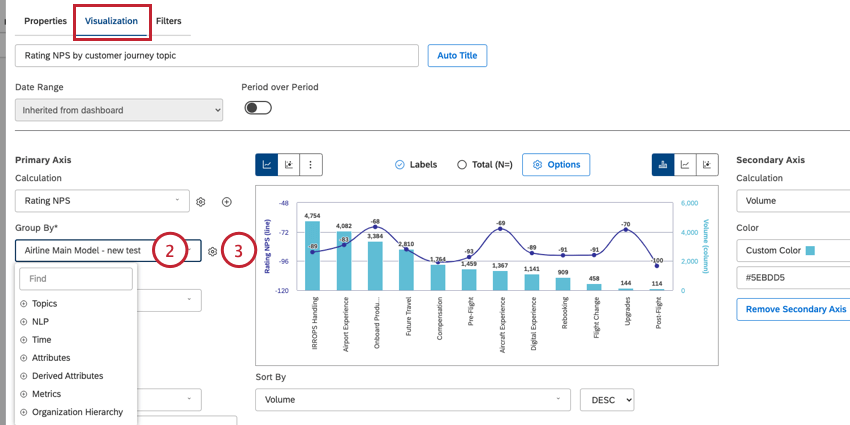
You can group data in supported widget types. To group the data in your widget:
Qtip: If using a table widget, then this option is called “Groupings” instead. If using a heatmap widget, then this option is called “Boxes” instead. If using a network widget, then this option is called “Nodes” instead.
Topics
Selecting Topics allows you to group data by the categories derived from customer feedback. This provides you an overview of what your customers are talking about.
After choosing your category model, open the grouping settings to select what topics are included in the widget. See Customizing Category Model Groupings for more information.
When grouping data by topics, you can choose to report on different levels in your category model. For a high-level overview of what your customers are talking about, group data by Level 1 topics. To monitor more specific themes in customer feedback, group data by Level 2 topics or lower (depending on your model). For the most granular report on all levels, group data using the Leaf option, which lets you focus on topic leaves, or categories that do not have sub-categories.
NLP
Selecting NLP allows you to group data by criteria that is automatically created by XM Discover’s Natural Language Processing engine. These criteria are created from unstructured feedback that is processed by XM Discover. There are multiple sub-groupings available for you to choose from:
Words
The Words NLP groupings allow you to group data by words or specific types of words mentioned in customer feedback. The following groupings are available:
- All Words: Group data by regular words. This will give you an idea of the most common terms customers are using when talking about your product or service.
- CB Brand: Group data by brand mentions.
- CB Company: Group data by company mentions.
- CB Email Address: Group data by email addresses mentioned in feedback.
- CB Emoticon: Group data by emojis and emoticons used in feedback.
- CB Event: Group data around standard holidays (like New Year or Halloween), life events (like wedding or graduation), and common cultural events (like the Super Bowl) mentioned in feedback.
- CB Industry: Group data by related industry.
- CB Person: Group data by names of people mentioned in feedback.
- CB Phone Number: Group data by phone numbers mentioned in feedback.
- CB Product: Group data by product mentions.
- CB Profanity: Group data by profane words from a predetermined set.
Associated Words
The Associated Words grouping allows you to group data by pairs of words that are mentioned in connection with each other in customer feedback. This allows you to see the most common topics and themes in customer feedback regardless of topic categorization.
Associated words are presented in the following format: word 1 → word 2.
Example: If a customer’s feedback was “The store was dirty” and you group by associated words, then you will see “store → dirty” in your widget.
Hashtags
The Hashtags grouping allows you to group data by hashtags phrases (words or phrases prefixed with a # symbol). Hashtags are usually used in social media posts to help identify and categorize the subject matter of the post.
Enrichment
The Enrichment groupings allow you to group data by the types of content included in customer feedback. The following groupings are available:
- CB Chapters: Group data by conversational chapters that represent semantically related segments of the conversation (such as Opening, Need, Verification, Solution Step, and Closing).
- CB Content Subtype: Further group non-contentful data by its subtypes (such as ads, coupons, article links, or “undefined” type). Note that for contentful records, subtype is always contentful as well.
- CB Content Type: Group data by it being contentful or non-contentful as automatically identified by XM Discover.
- CB Detected Features: Group data by types of NLP features detected (for example, data containing industry or brand mentions).
- CB Emotion: Group data by emotion types detected by the NLP engine (such as Anger, Confusion, Disappointment, Embarrassment, Fear, Frustration, Jealousy, Joy, Love, Sadness, Surprise, Thankfulness, Trust, or Other).
- CB Medical Condition: Group data by medical conditions mentioned in text (for example, “covid” or “meningitis”).
- CB Medical Procedure: Group data by medical procedures mentioned in text (for example, “mammogram” or “back surgery”).
- CB Participant Empathy Score: Group conversational data by whether representatives displayed empathy in their interactions with clients or not. 0 means the representative didn’t show empathy while 1 means the representative showed empathy.
- CB Reason: Group data by reasons for a particular conversation event (for example, reason for contact or reason for empathy).
- CB Rx: Group data by drug names mentioned in text (for example, “acetaminophen” or “tylenol”).
- CB Sentence Type: Group data by the type of sentence or intent (for example, “cry for help” or “suggestion”).
Language
The Language groupings allow you to group data by the language the feedback was left in. The following groupings are available:
- CB Auto-detected language: Group data by languages detected automatically (if language auto-detection is enabled for a project).
- CB Processed language: Group data by languages in which feedback was actually processed. Languages not supported by XM Discover language detection are marked as “other.”
Conversation
The Conversation groupings allow you group data by various conversational enrichments. Note that these groupings are only available for conversational data (calls and chats processed using Qualtrics conversational format). The following groupings are available:
- CB % Silence: Group data by the percentage of silence in a call.
- CB Conversation Duration: Group data by the duration of a conversation in milliseconds. For calls, this is the amount of time between the start of the first sentence and the end of the last sentence. Leading and trailing silence is not counted. For chats, this is the amount of time between the first sentence and the last sentence.
- CB Kind of Participant: Group data by the kind of participant. Possible values include:
- Chat_bot is a chatbot.
- IVR is an Interactive Voice Response bot.
- Human is a person.
- CB Participant Type: Group data by the type of participant. Possible values include:
- agent is a company representative or a chatbot.
- client is a customer.
- type_unknown is a participant not identified as an agent or client.
- CB Sentence Duration: Group data by the duration of a sentence in a call in milliseconds.
- CB Sentence Start Time: Group data by the timestamp of the start of the sentence. For calls, this is the time in milliseconds since the audible start of the first word in the first sentence. For chats, this is the time in milliseconds since the first message is sent. Qtip: The first chat message start time will always be 0 ms for this attribute.

- CB Total Dead Air: Group data by the total dead air in a call in milliseconds. In calls, dead air is a long pause between the speakers.
- CB Total Hesitation: Group data by the total (agent’s and client’s) hesitation in a call in milliseconds. In calls, hesitation is a long pause by one speaker.
- CB Total Overtalk: Group data by the accumulated length of overlapping sentences in a call in milliseconds. In calls, overtalk is any time when 2 or more speakers are talking simultaneously and their sentences’ timestamps overlap.
- CB Total Silence: Group data by the accumulated length of all silences greater than or equal to 2 seconds between sentences for all participants in a call in milliseconds.
Time
Selecting Time allows you to group data by time periods. You can use time attribute groupings to create a trend report, allowing you to view how your calculations and metrics change over time.
Attributes
Selecting Attributes allows you to group data by the values of a selected structured attribute. A structured attribute is any numeric or string field present in a record that is not the actual textual feedback. Structured attributes generally contain discrete data with a high degree of organization (such as a person’s age or the name of the product they use). The attributes available for grouping depend on the source of feedback and usually vary from dataset to dataset.
Example: I can group by the Attribute “Agent” to see groupings of interactions by the different agents who handled the interaction.
Metrics
Selecting Metrics allows you to group data by discrete values or bands of certain standard calculations and derived metrics. In other words, you can organize data by one metric and measure it by a different metric. The following groupings are available:
- Sentiment (3 Bands): Group data by 3 sentiment bands (Negative, Neutral, Positive). See Grouping by Sentiment for more information.
- Sentiment (5 Bands): Group data by 5 sentiment bands (Strongly Negative, Negative, Neutral, Positive, Strongly Positive). See Grouping by Sentiment for more information.
- Effort (3 Bands): Group data by 3 effort bands (Hard, Neutral, Easy). When grouping by Effort, null values are included by default.
- Effort (5 Bands): Group data by 5 effort bands (Very Hard, Hard, Neutral, Easy, Very Easy). When grouping by Effort, null values are included by default.
- Emotional Intensity: Group data by 3 emotional intensity bands (Low, Medium, High).
- CB Document Word Count: Group data by the number of words in a document.
- CB Loyalty Tenure: Group data by the length of customer loyalty (in years).
- CB Sentence Quartile: Group data by the quarter of the verbatim a sentence falls into (1, 2, 3, or 4). This can help you understand what topics are being discussed at which points in the conversation.
- CB Sentence Word Count: Group data by the number of words in a sentence.
Additionally, you can define your own top box, bottom box, and satisfaction metrics which you can group data by. This allows you to determine whether feedback comes from a promoter, detractor, or neutral customer. The following groupings are available:
- Top Box: Group data by top box bands (promoters and other).
- Bottom Box: Group data by bottom box bands (detractors and other).
- Satisfaction: Group data by satisfaction bands (detractors, neutrals, promoters).
Drivers
Qtip: You can only use drivers in scatter plot widgets.
Selecting Drivers allows you to group data by the drivers you create in your account. You can use these drivers to find attributes and topics that lead to a certain outcome.
Organization Hierarchy
Selecting Organization Hierarchy allows you to group data by the different levels in the selected organization hierarchy.
Grouping Cost
When running reports with multiple groupings, you may receive the following error message:
“Oops! We apply an estimated cost to each grouping, and the sum of costs cannot exceed the guardrail budget of [10.5]. (High-cardinality groupings cost more.) Remove or choose different groupings based on the costs listed below to ensure the widget has a total cost within the budget: [list of groupings and their costs] Current total cost: [total of all costs]”
The cost of each grouping depends on the number of unique values in the group (this measure is called cardinality). By default, most widgets return top 10 items by volume. If there are 100 items in total, then this calculation is typically very fast. If there are 1,000,000 items, then it takes longer to calculate which of them are the top 10. In general, having more unique items results in a more costly calculation in terms of performance. This cost can multiply quickly for widgets that return multiple levels of data, and can result in the above error message appearing.
If you receive the above error when using groupings in a report, you must remove one or more of the listed groupings so that their total cost does not exceed the budget. The error message will display the estimated costs for each grouping to help you decide which grouping to remove.
That's great! Thank you for your feedback!
Thank you for your feedback!