
Calculations (Studio)
What's on this page
About Calculations
You can report on a number of calculations in your data, such as volume, sentiment, assorted metrics and attributes, and more. These calculations can be used in many ways, including:
- Determine the size of bars and line graphs.
- Display values in tables.
- Sort the order that groups appear in a widget.
- Filter widgets.
Qtip: In most widgets, calculations are available in the Calculation dropdown. However, there are exceptions, such as include heatmap widget, where calculations are selected under Box Size instead.

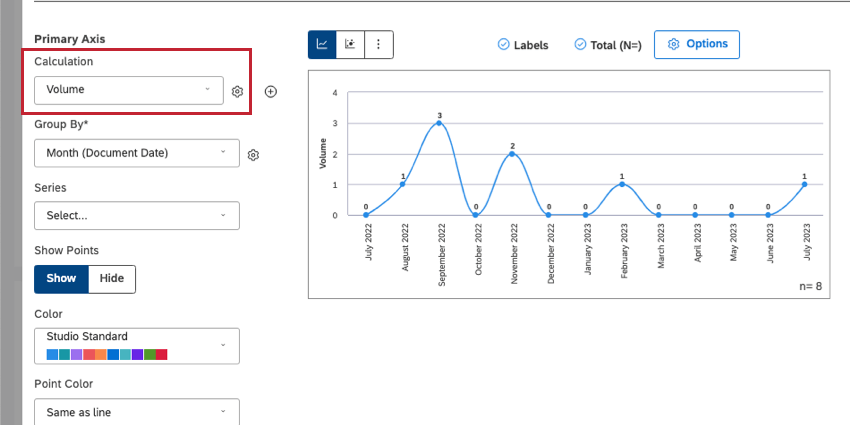
Volume
Volume is the number of documents for a particular data grouping. In XM Discover, a document (also called a record) is any individual piece of feedback submitted by a customer. A document can be a restaurant review, a transcript of a call center interaction, a filled-out survey, or a Facebook post, depending on your dataset.
Grouping Data by Sentence vs. Document
It’s important to remember that volume reflects the number of documents, even when we are grouping data by individual sentences instead. Examples of sentence-level groupings include sentiment and the presence of specific topics.
A document is counted toward a sentence-level grouping if that document contains at least 1 sentence that matches that grouping. If a record contains several sentences related to the same grouping, that record is counted only once toward that grouping. If a record contains sentences related to several different groupings, that record is counted once toward each of these groupings.
Example: We’re displaying the volume of feedback that contains the Customer Service topic. There is only 1 document of feedback, and it mentions customer service in 10 different sentences. Because there is only 1 document of feedback, the Customer Service topic volume would be 1.
Qtip: For discrepancies in volume on a widget displaying sentiment, see Grouping Widget Data by Sentiment.
Sentiment
Sentiment measures the average sentiment of all sentences related to a particular data grouping.
Sentences where no sentiment is expressed are set to zero ( 0 ) and are counted toward average sentiment calculations.
Qtip: When the size of an element in a report is determined by sentiment, effort, or satisfaction metrics, the absolute value is used. For example, words with sentiment of 2 and -2 will be equal in size in a cloud widget.
For more details, see Sentiment.
Effort
Effort measures the average score of effort-bearing sentences related to a particular data grouping.
Sentences where no effort is expressed are assigned a NULL value and are not counted towards average score calculations.
Qtip: When the size of an element in a report is determined by sentiment, effort, or satisfaction metrics, the absolute value is used. For example, words with sentiment of 2 and -2 will be equal in size in a cloud widget.
See Effort for more details.
Emotional Intensity
Emotional Intensity measures the strength of emotions expressed in a statement.
Sentences where no emotional intensity is expressed are assigned a NULL value and are not counted toward the average score calculations.
See Emotional Intensity for details.
Impact
Impact measures the power of a driver in predicting a chosen outcome. The impact score is only available when data is grouped by drivers.
See About the Impact Rank for details.
Percent Total and Percent Parent
% Total measures the contribution of a grouping’s volume to the widget’s total volume. The widget’s total volume is the total number of records that match the widget’s conditions and filters.
% Total = (Number of records for a grouping) / (Total number of records for a widget) * 100
% Parent measures the contribution of a grouping’s volume to its parent grouping’s volume.
% Parent = (Number of records for a grouping) / (Number of records for the parent grouping) * 100
Qtip: If a selected grouping does not have a parent, the widget’s total volume is used as a denominator, in which case % Parent matches % Total.
See Percent Parent and Percent Total for details.
Metrics
You can analyze data groupings using a variety of metrics that Studio can derive from textual feedback or existing attributes. You can either customize your own metrics, or choose from a list of pre existing metrics that Discover provides.
Metrics You Can Customize
See linked pages for more details on each.
- Top Box: The percentage of respondents who gave the most favorable response in a survey.
- Bottom Box: The percentage of respondents who gave the least favorable response in a survey.
- Satisfaction: The difference between top box and bottom box values, which serves as a measurement for customers’ satisfaction.
- Filtered Metric: Perform a calculation on a selected subset of data.
- Custom Math: Mix and match different metrics and attributes using various aggregations and mathematical expressions.
Premade Metrics
These premade metrics can be set to sum or average. See steps on switching between the 2 options.
| Metric name | Sum | Average | Other |
|---|---|---|---|
| CB Document Word Count | The total number of words from all documents related to a particular data grouping. | The average number of words per document for all records related to a particular data grouping. | N/A |
| CB Sentence Quartile | Not recommended. | The average quartile of a verbatim that all sentences related to a particular data grouping fall into. | N/A |
| CB Sentence Word Count | The total number of words from all sentences related to a particular data grouping. | The average number of words per sentence for all sentences related to a particular data grouping. | N/A |
| Loyalty Tenure | N/A | N/A | Measures the length of customer loyalty in years. |
Scorecard Metrics
If you’ve set up intelligent scoring, you will see a pair of filtered metrics for each rubric you’ve created:
- % Passing – [Rubric Name]: The percentage of documents that received a passing score for this rubric.
- % Failing – [Rubric Name]: The percentage of documents that received a failing score for this rubric.
Calculations for Attributes and Premade Metrics
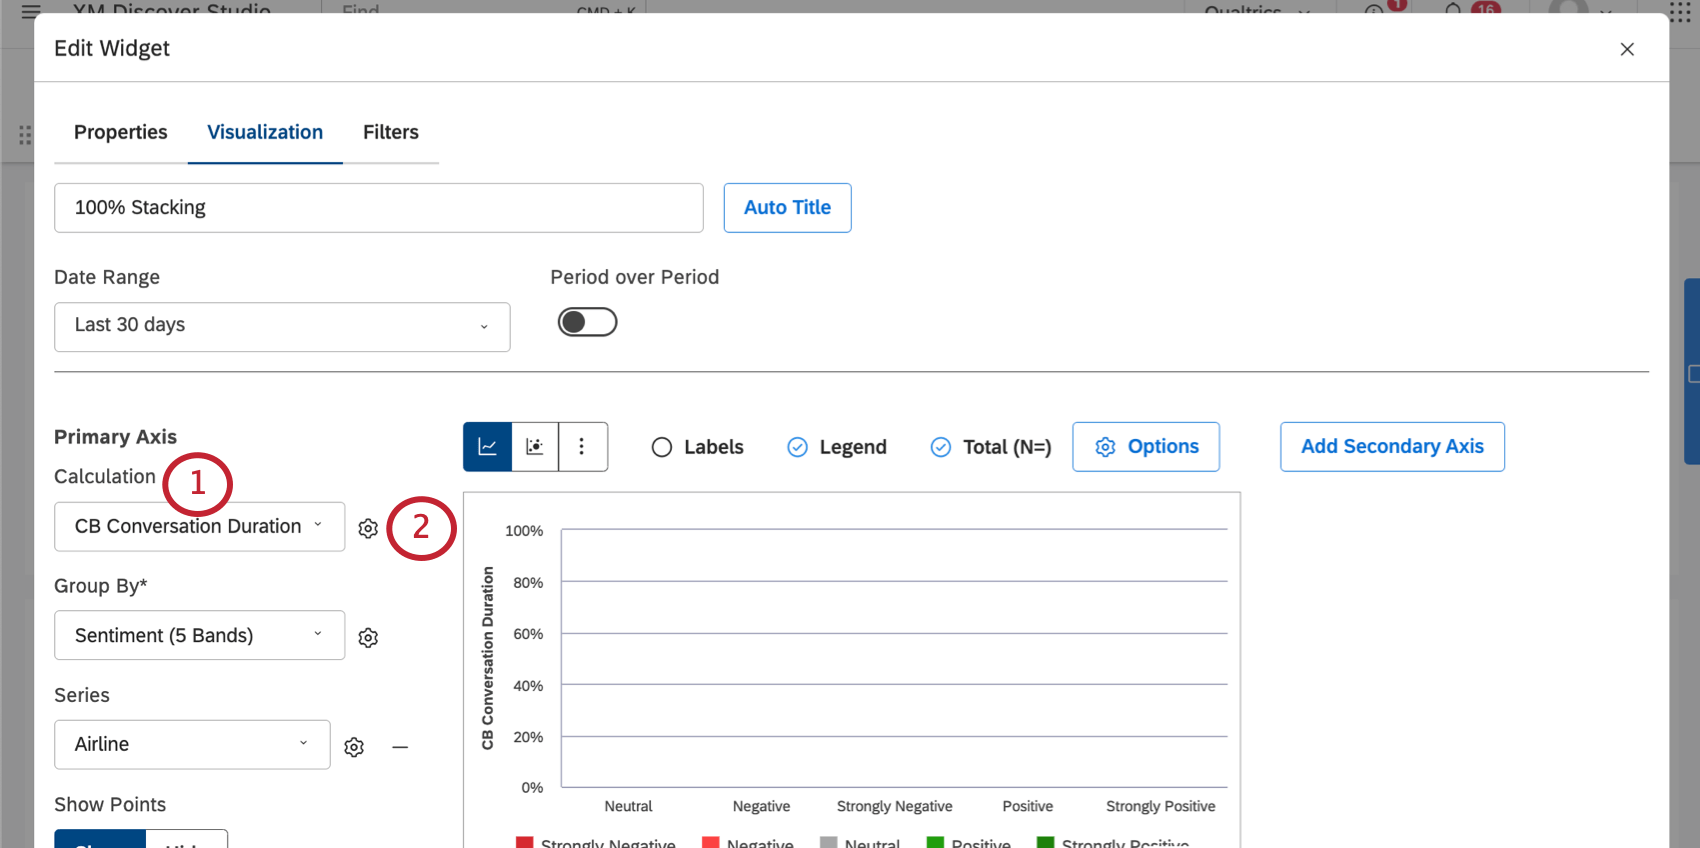
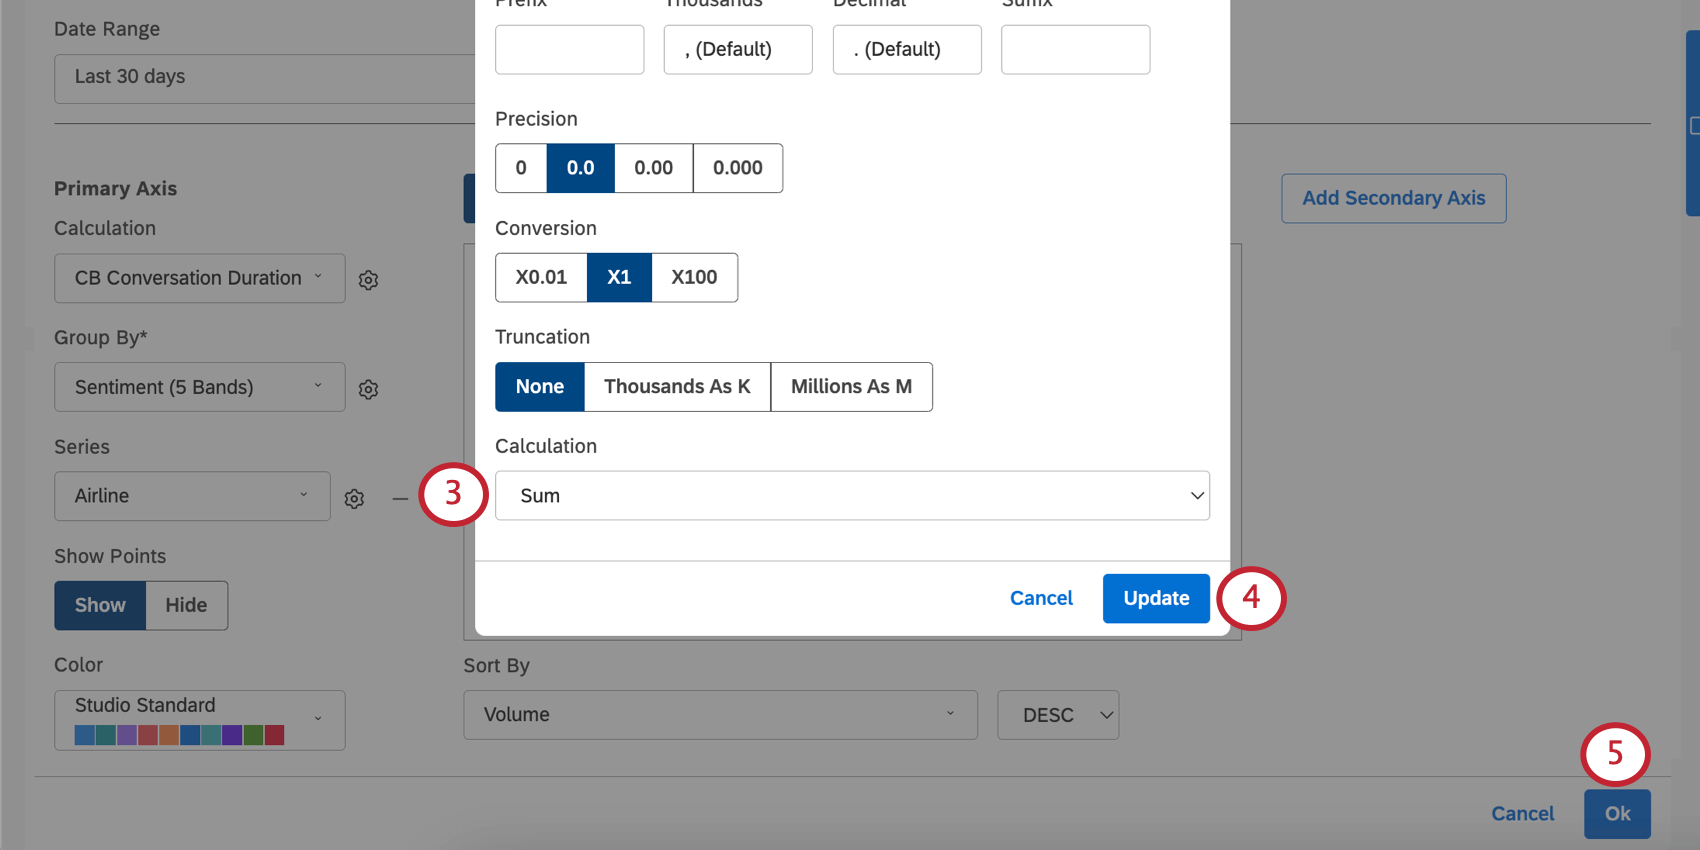
You can choose a numeric attribute as your calculation. By default, this attribute will be set to act as an average.
However, you can switch this to sum instead by doing the following:
Calculation Settings
When you click the gear next to Calculations, there are additional settings you can adjust.
See Widget Calculation Settings for details.
Derived Comparison Calculations
Certain metrics you display in the metric widget may come with additional calculation options.
Add Δ Change
Qtip: This is available for all calculations.
Use this to show the difference between the main and comparison values. The following formula is used:
Δ Change = Main value – Comparison value Add % Change
Qtip: This is available for all calculations except sentiment, satisfaction metrics, and effort.
Use this to show the percentage change between the main and comparison values. The following formula is used:
% Change = ((Main value) – (Comparison value)) / (Comparison value) * 100 Add p-value
Qtip: This is available for numeric attributes aggregated by average with period over period comparison.
Use this to show the probability value.
Qtip: XM Discover calculates statistical significance using the 2-tailed unequal-variances independent 2-sample t-test with an alpha value of 0.05 to determine if 2 means have a statistically significant difference.
Add Statistical Significance as Symbol
Qtip: This is available for numeric attributes aggregated by average with period over period comparison.
Instead of the actual probability value, show its range using these symbols:
- ns (p > 0.05, not significant)
- * (p ≤ 0.05, significant [using a common 0.05 threshold])
- ** (p ≤ 0.01, significant to a higher standard)
- *** (p ≤ 0.001, significant to an even higher standard)
For more information on the metric widget, see Metric Widget.
Count Distinct
“Count distinct” is a calculation you can use to tally the number of unique values for a chosen attribute. This calculation can be used with all attribute types (such as date, numeric, and text).
Example: You have an attribute that stores “Airline name.” If you’re studying data from 12 distinct airlines, count distinct would be equal to 12.
In addition to widget calculations, count distinct is also available in custom math metrics.
Qtip: Count distinct produces approximated values, and is best for smaller datasets and attributes with a finite number of values. We do not recommend using count distinct with high-cardinality attributes and projects with large sums of data.
Qtip: Count distinct is not enabled by default. If you’re interested in this feature, reach out to your Discover account team. If you don’t have your representative’s contact information, you can contact the Discover Support Team instead.
That's great! Thank you for your feedback!
Thank you for your feedback!