
Adding Reference Lines to Widgets (Studio)
Suite
Customer Experience
Product
Qualtrics
What's on this page
About Adding Reference Lines to Widgets
Whether you’re adding a key date or a benchmark for metric performance, you can add reference lines that enhance your widgets’ meaning. In order to do this:
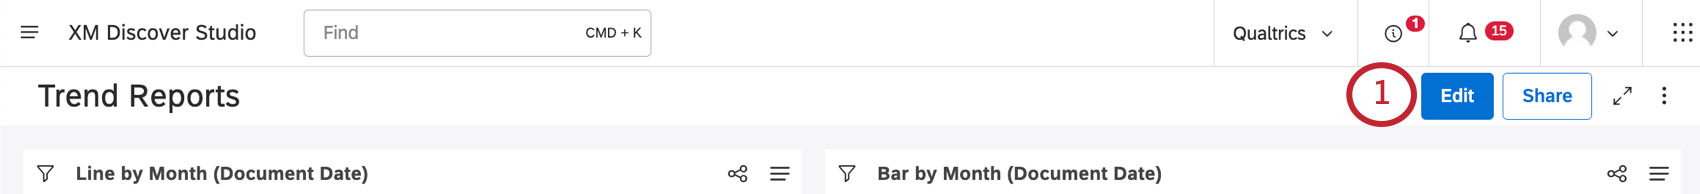
Expand the menu in the top-right corner of a widget.
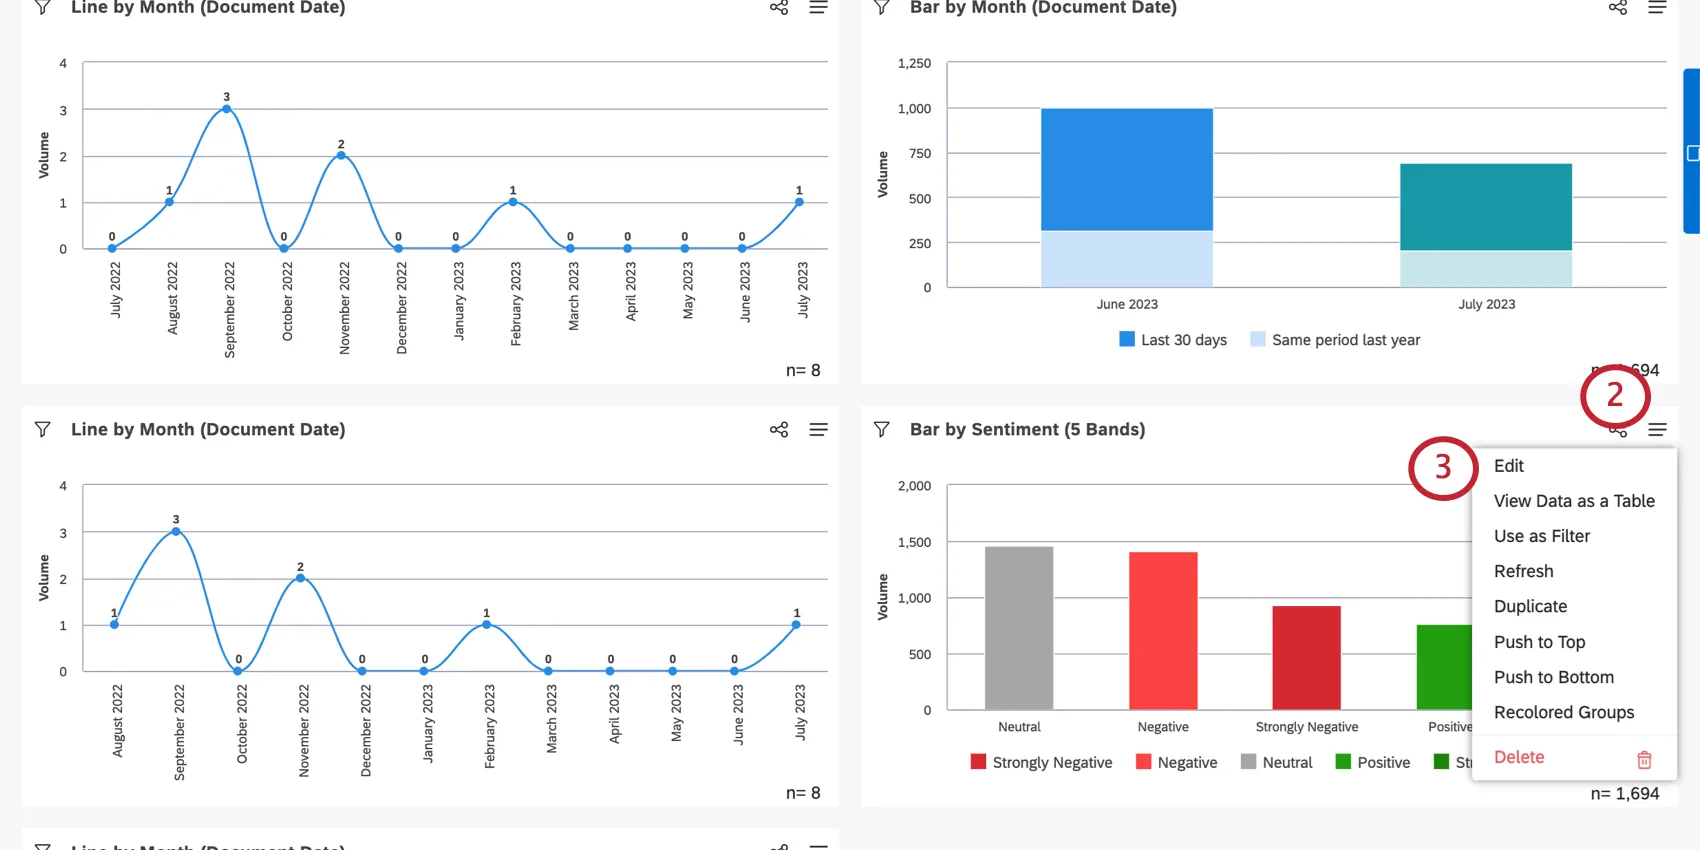

Click Edit.
Go to the Visualization tab.
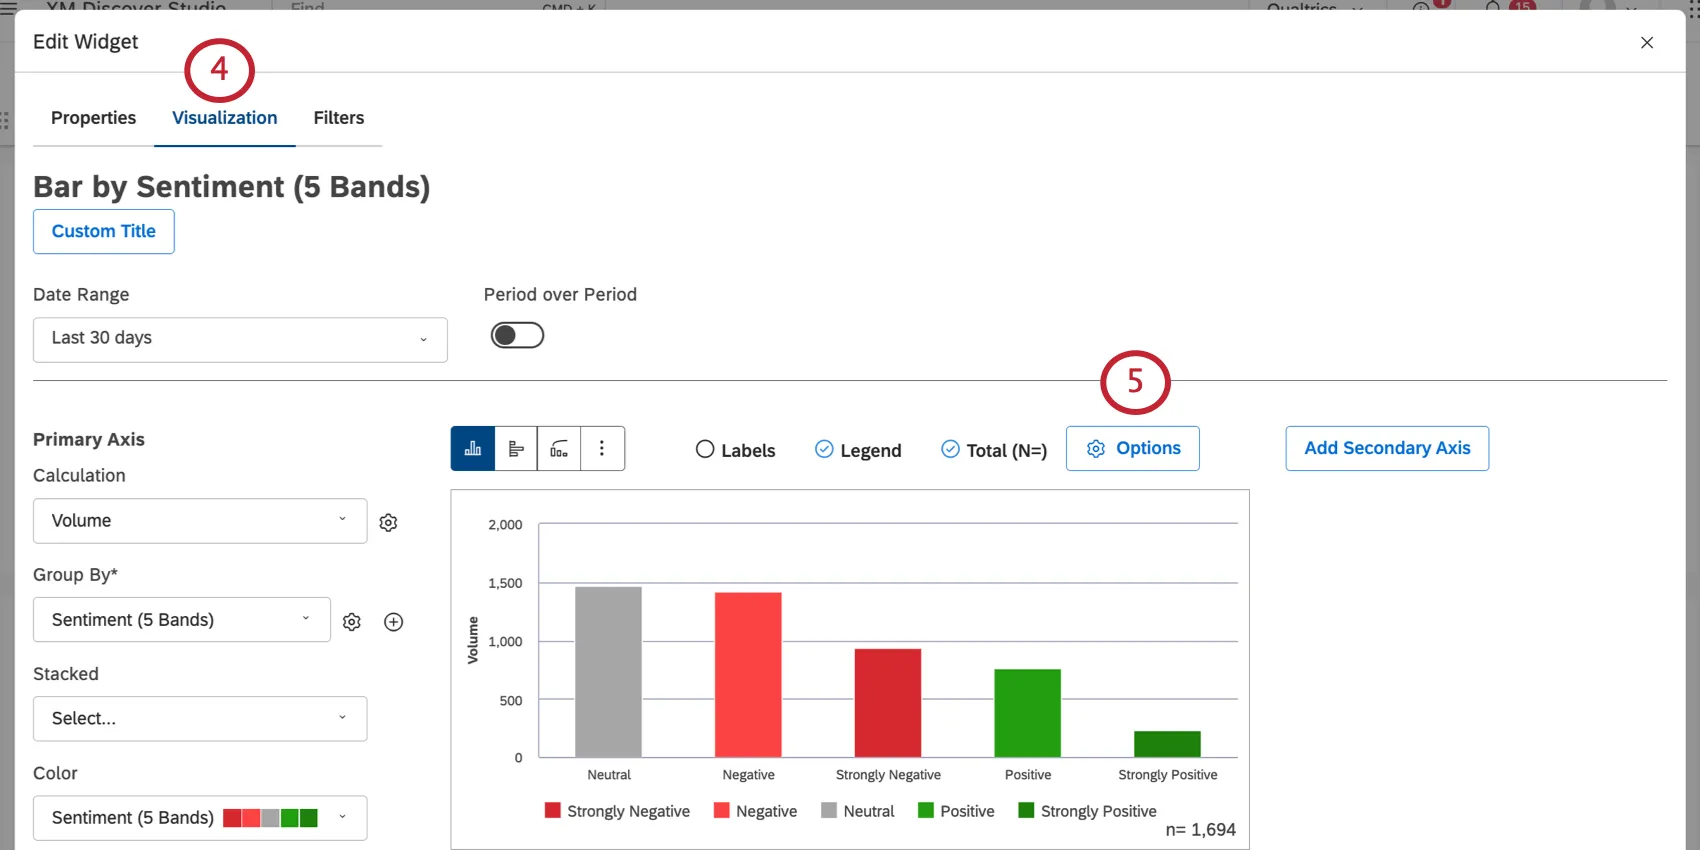
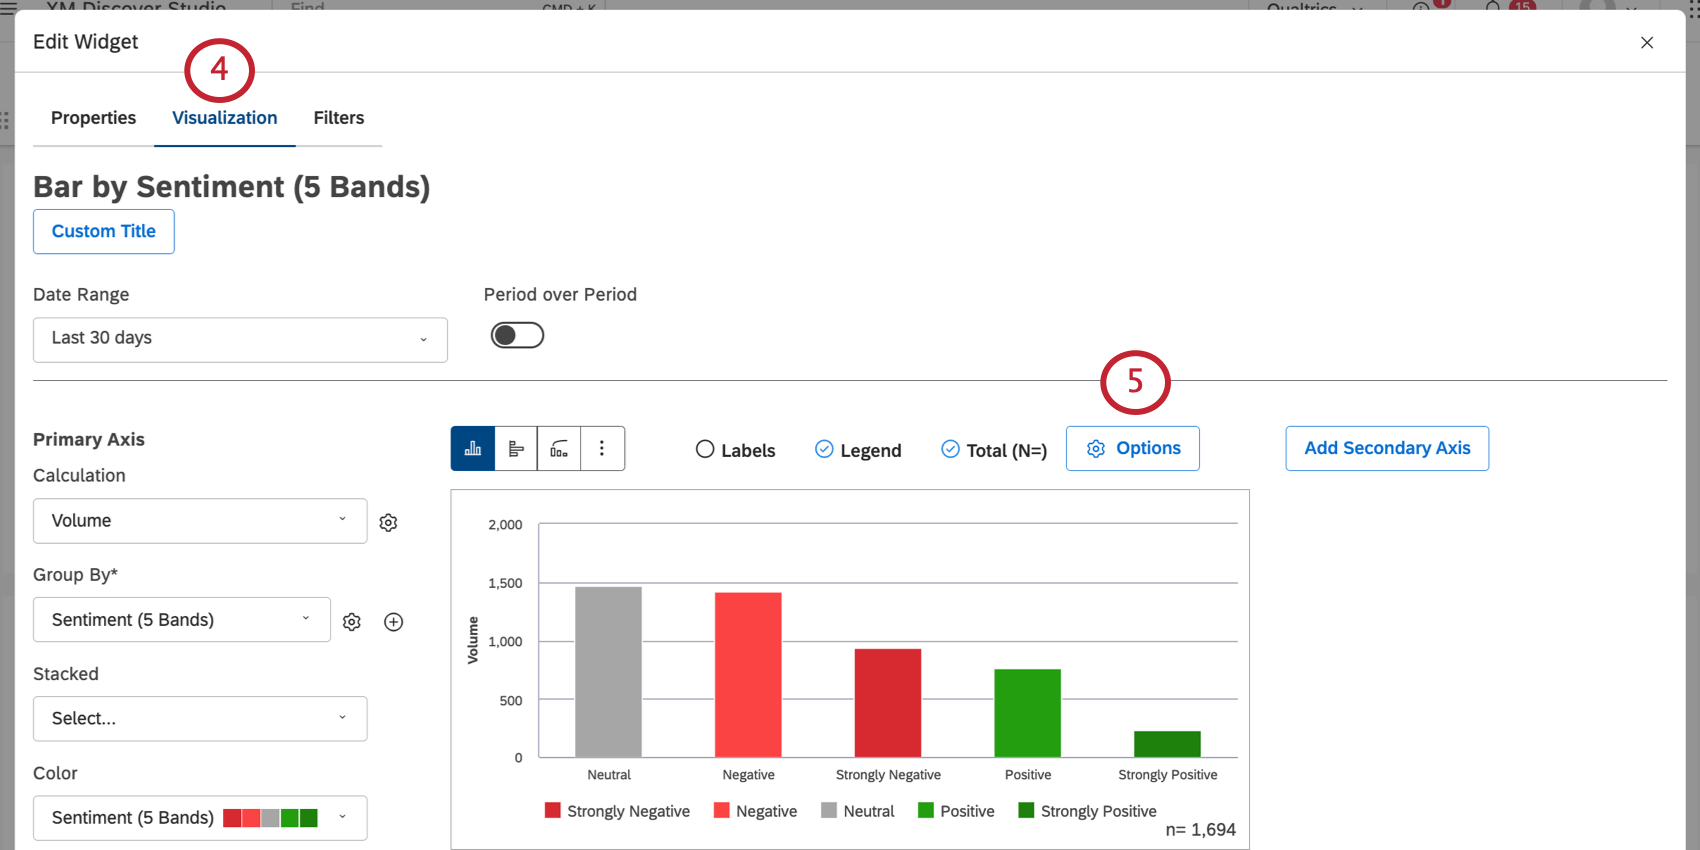
Click the Options button.
Qtip: You can add up to 5 reference lines per widget.
Qtip: Once you create reference lines, you can return to the options menu to edit them.
Metric Reference Lines
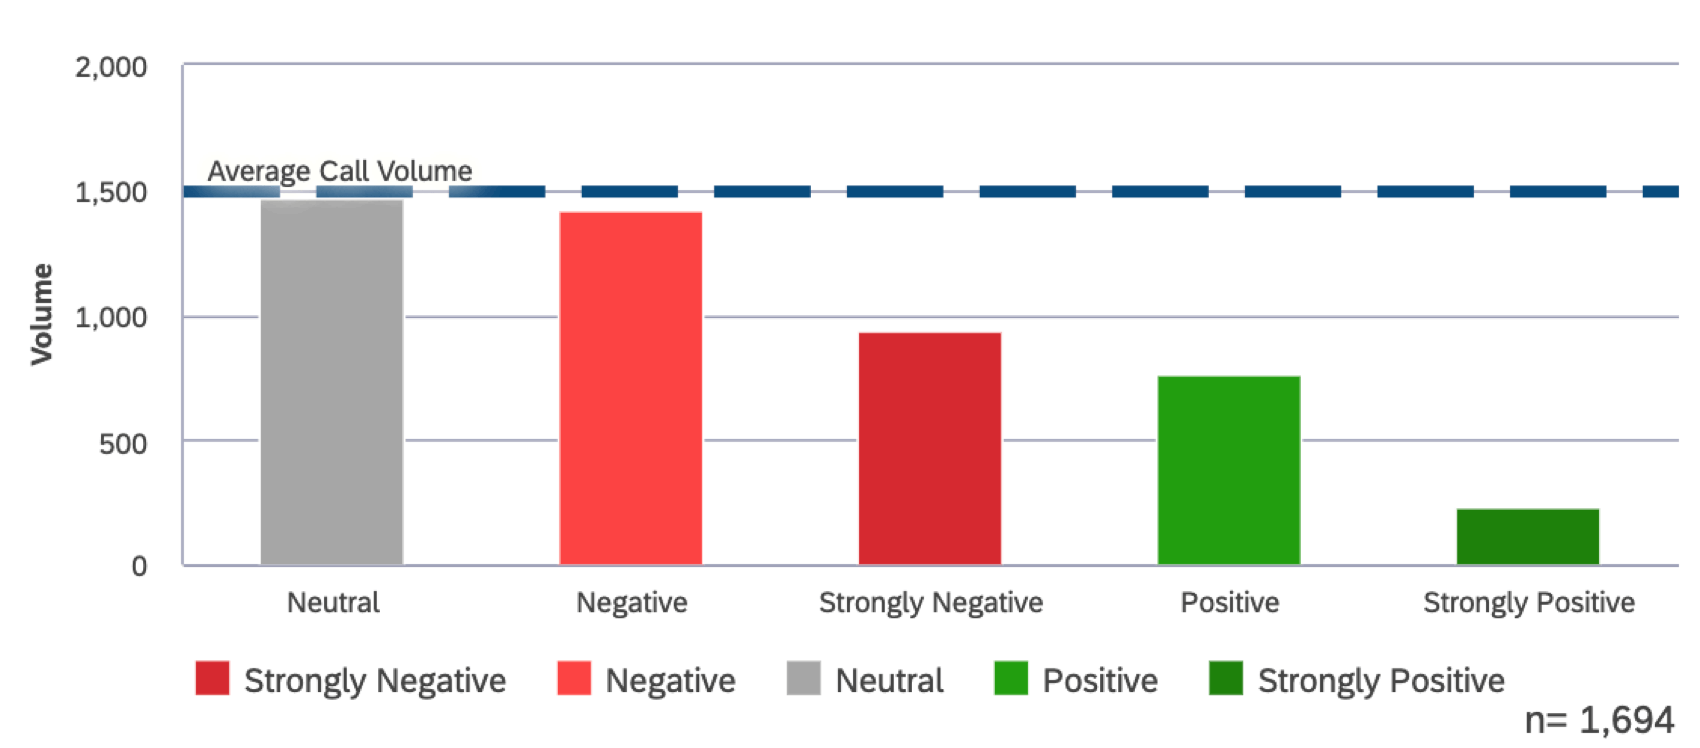
You can add metric reference lines to present goals, baselines, benchmarks, or other static values in your reports.

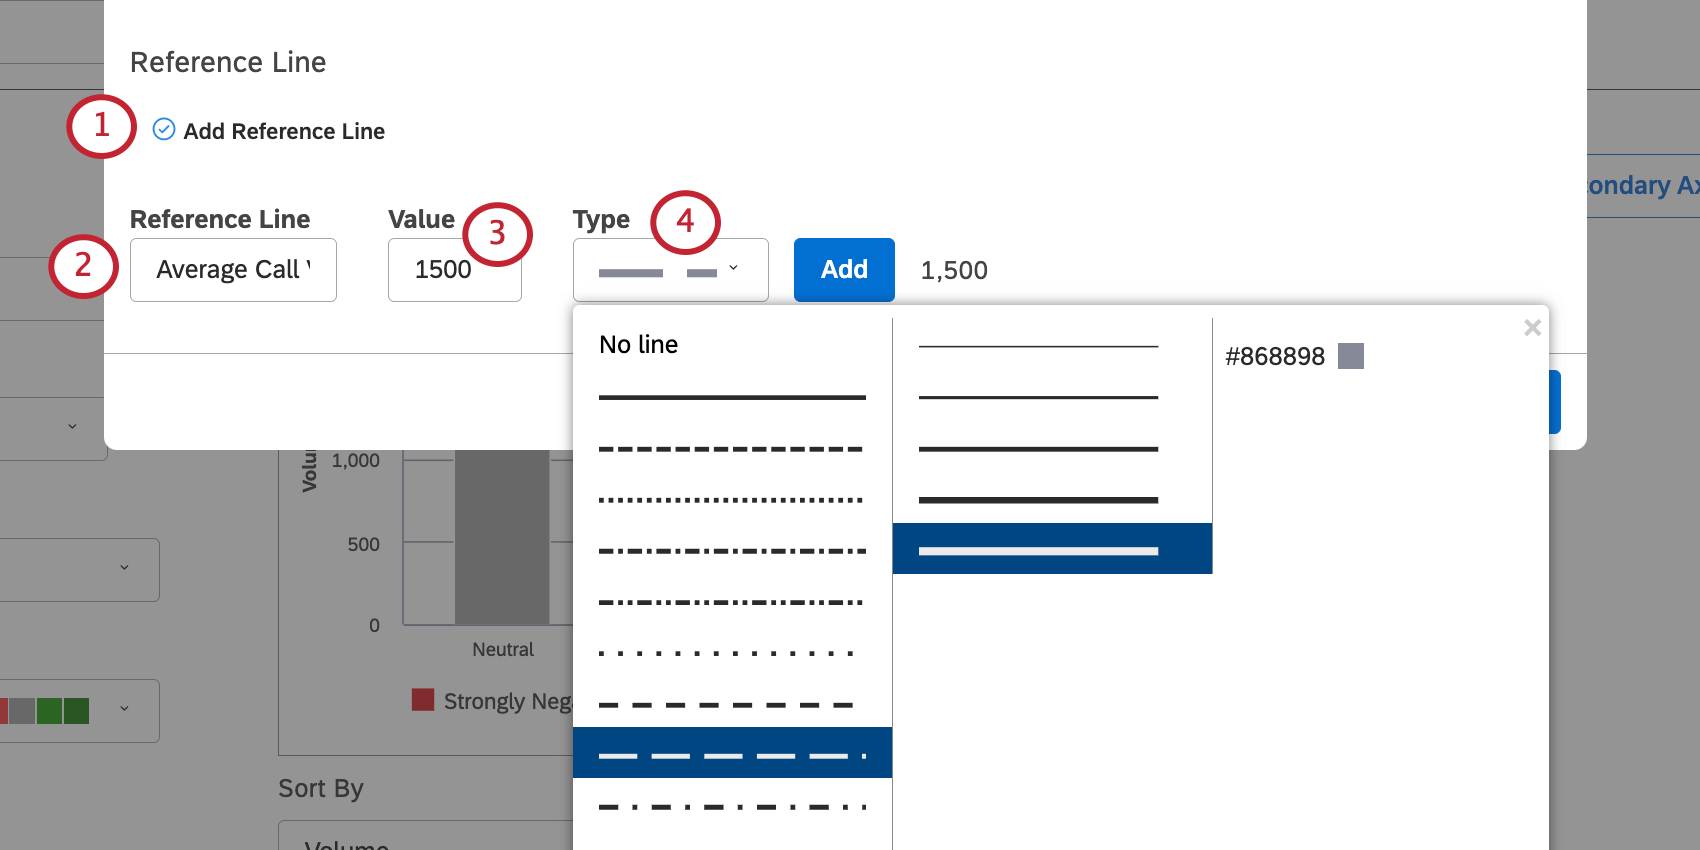
Name your reference line. This name will appear on the widget.
Enter a value for your reference line. This is the place on the y-axis the line will appear.
Qtip: If you are using a horizontal widget, the line will appear on the x-axis instead.
Select a type of reference line. You can choose between solid and dotted lines, how many pixels it weighs, and the color of the line.
Click Add.
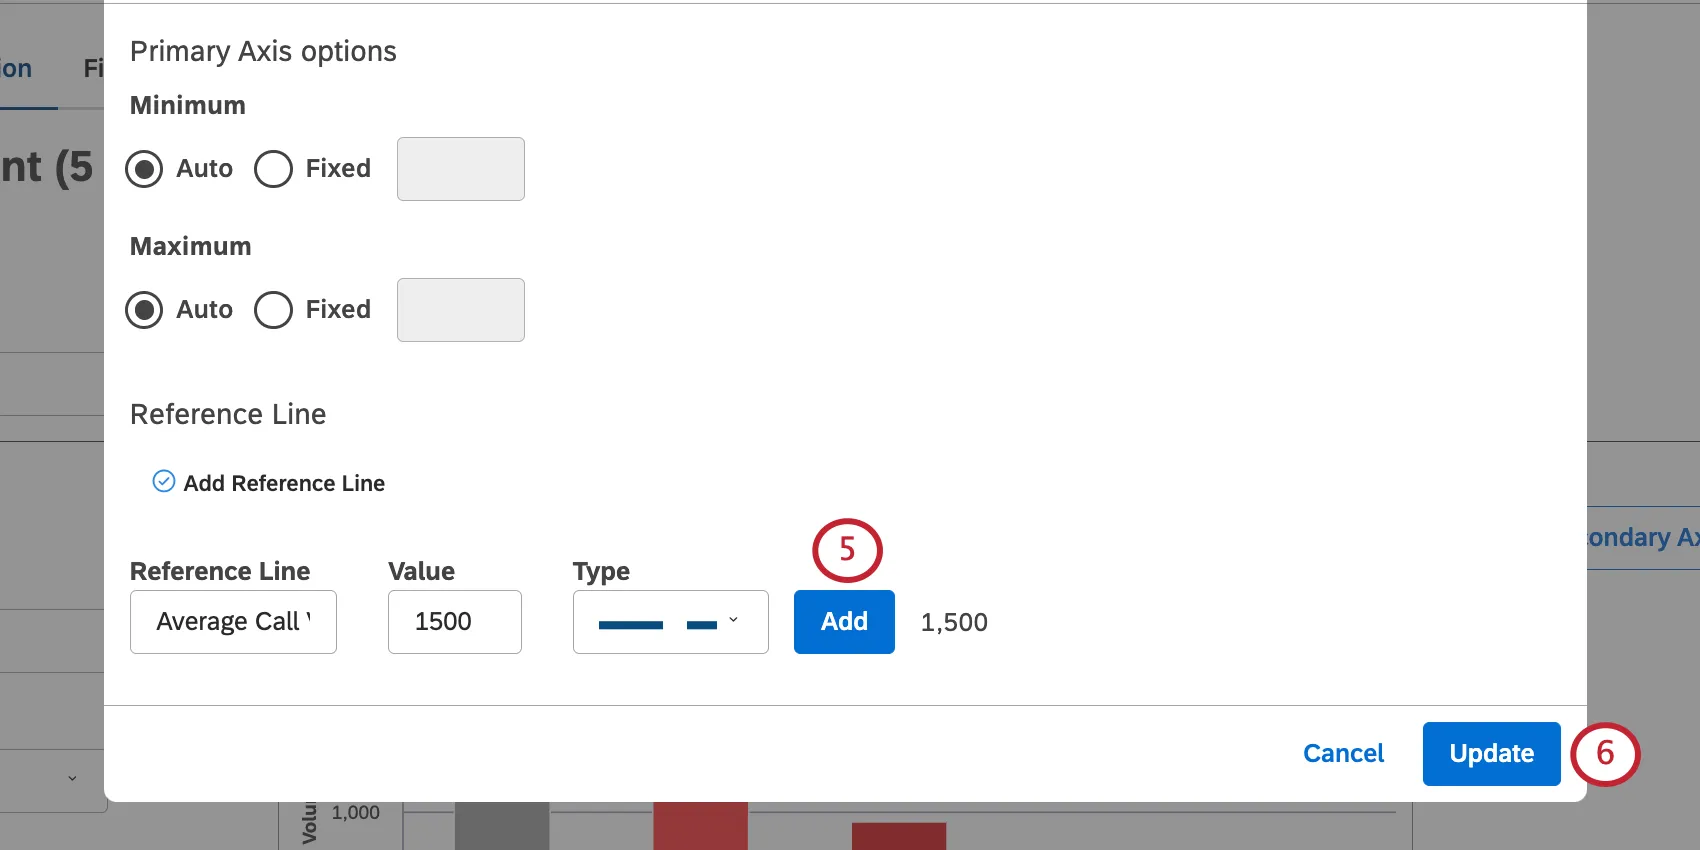
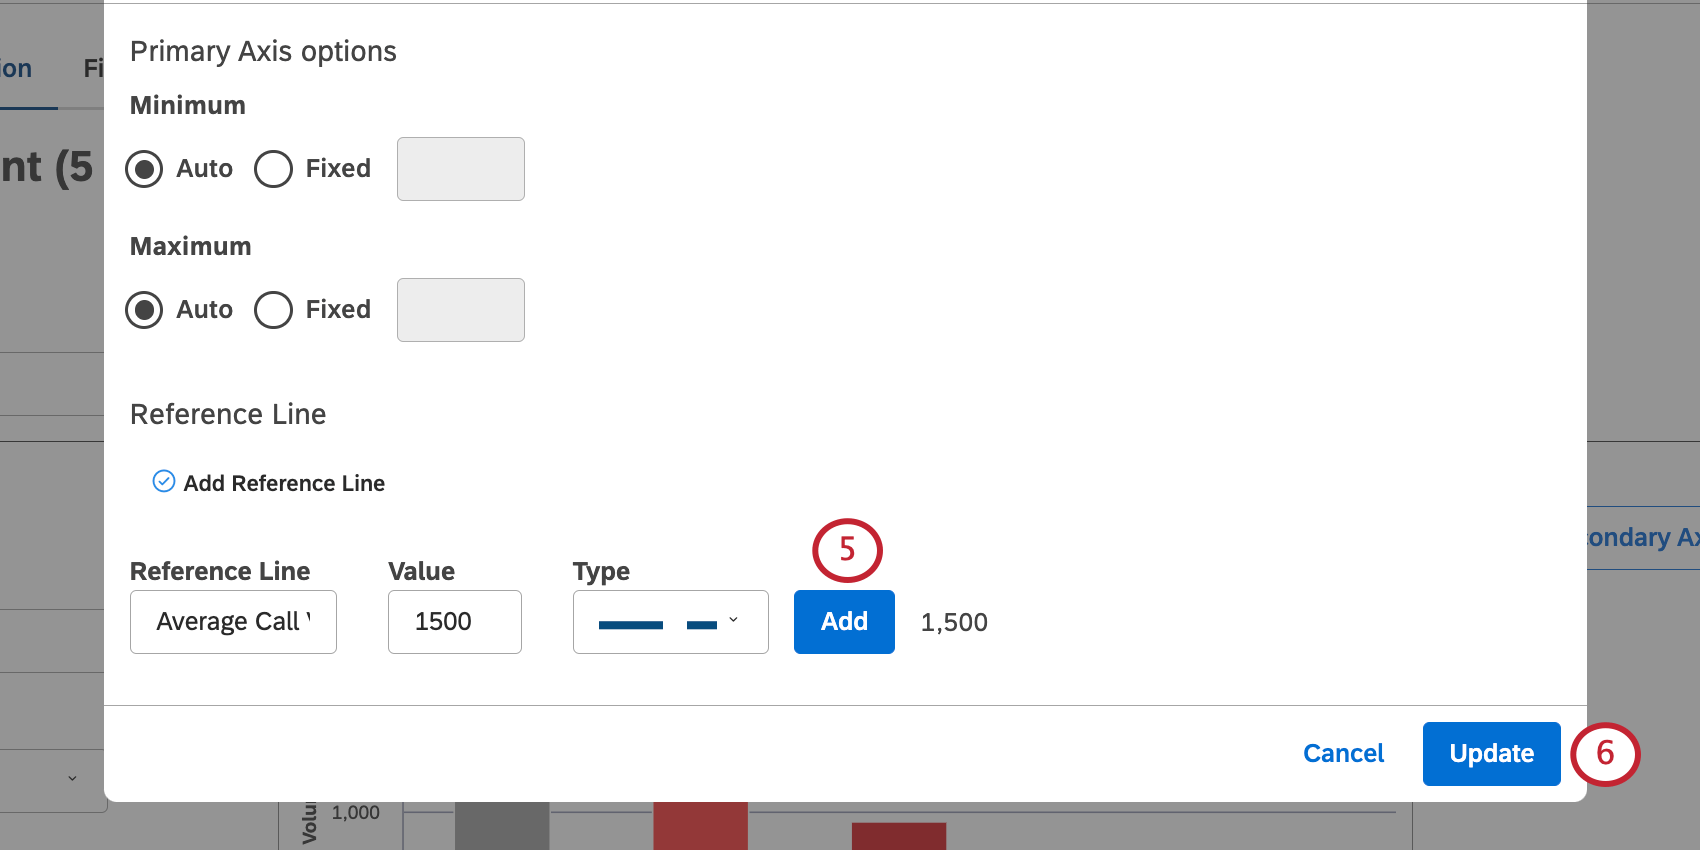
When you’re finished adding lines, click Update.
Event Reference Lines
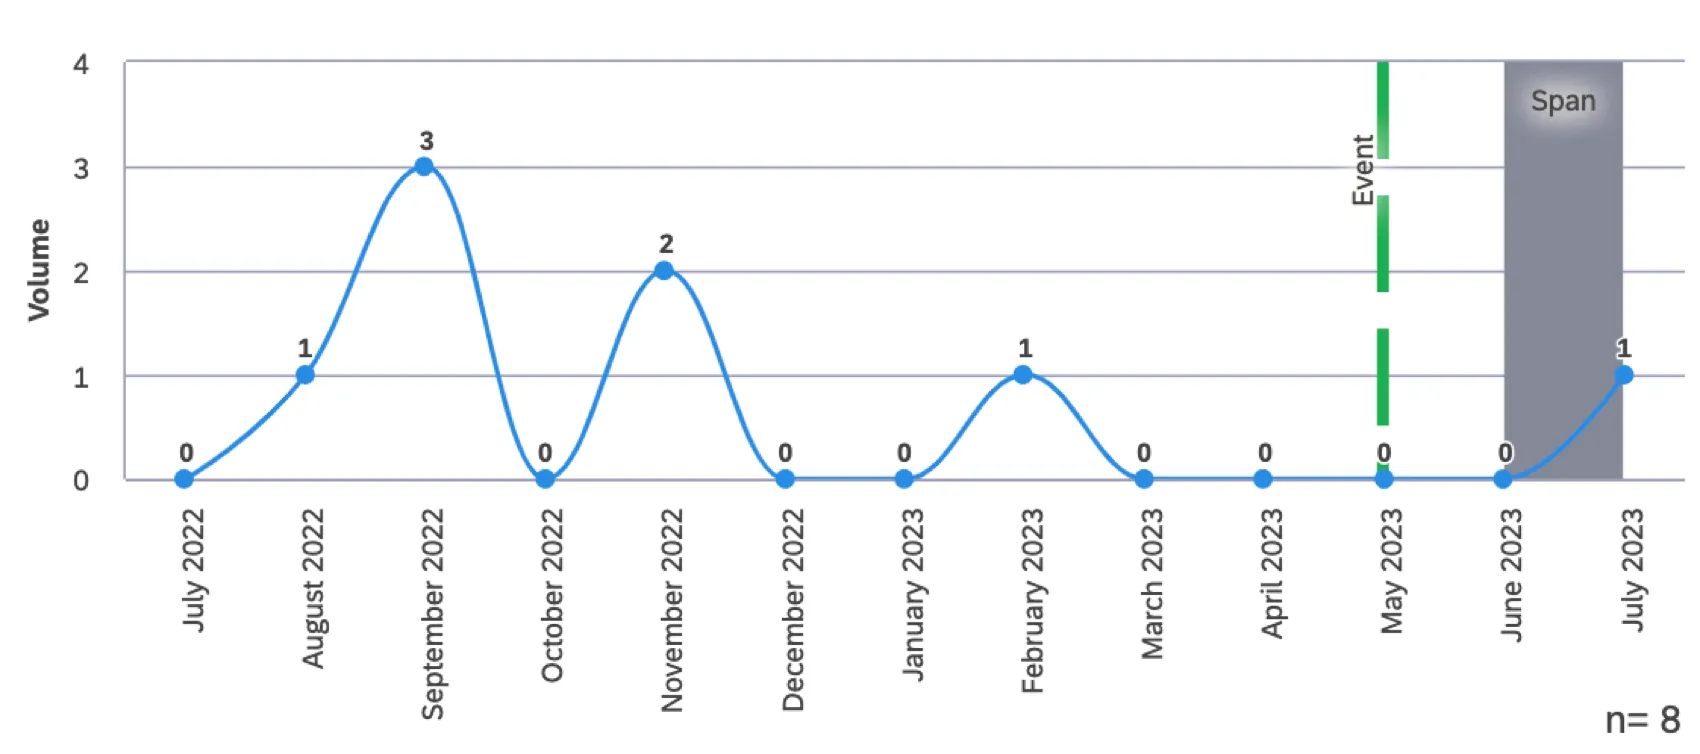
You can add reference lines that represent notable events and time spans in your trend reports.
Attention: Event reference lines can only be added to bar and line widgets grouped by date (i.e., trend reports).
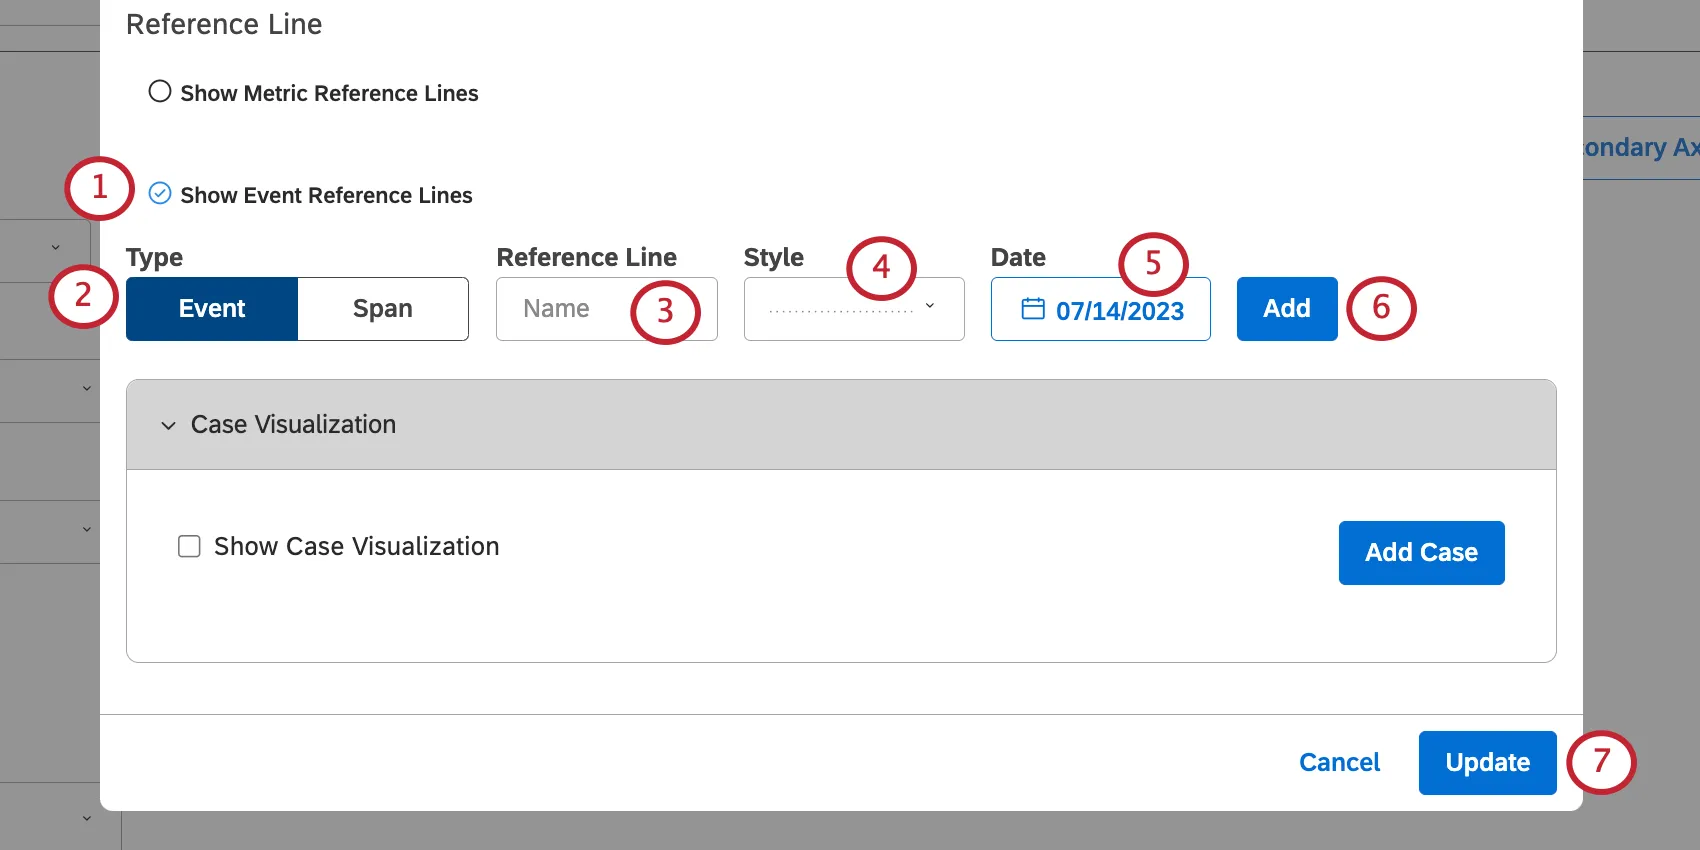
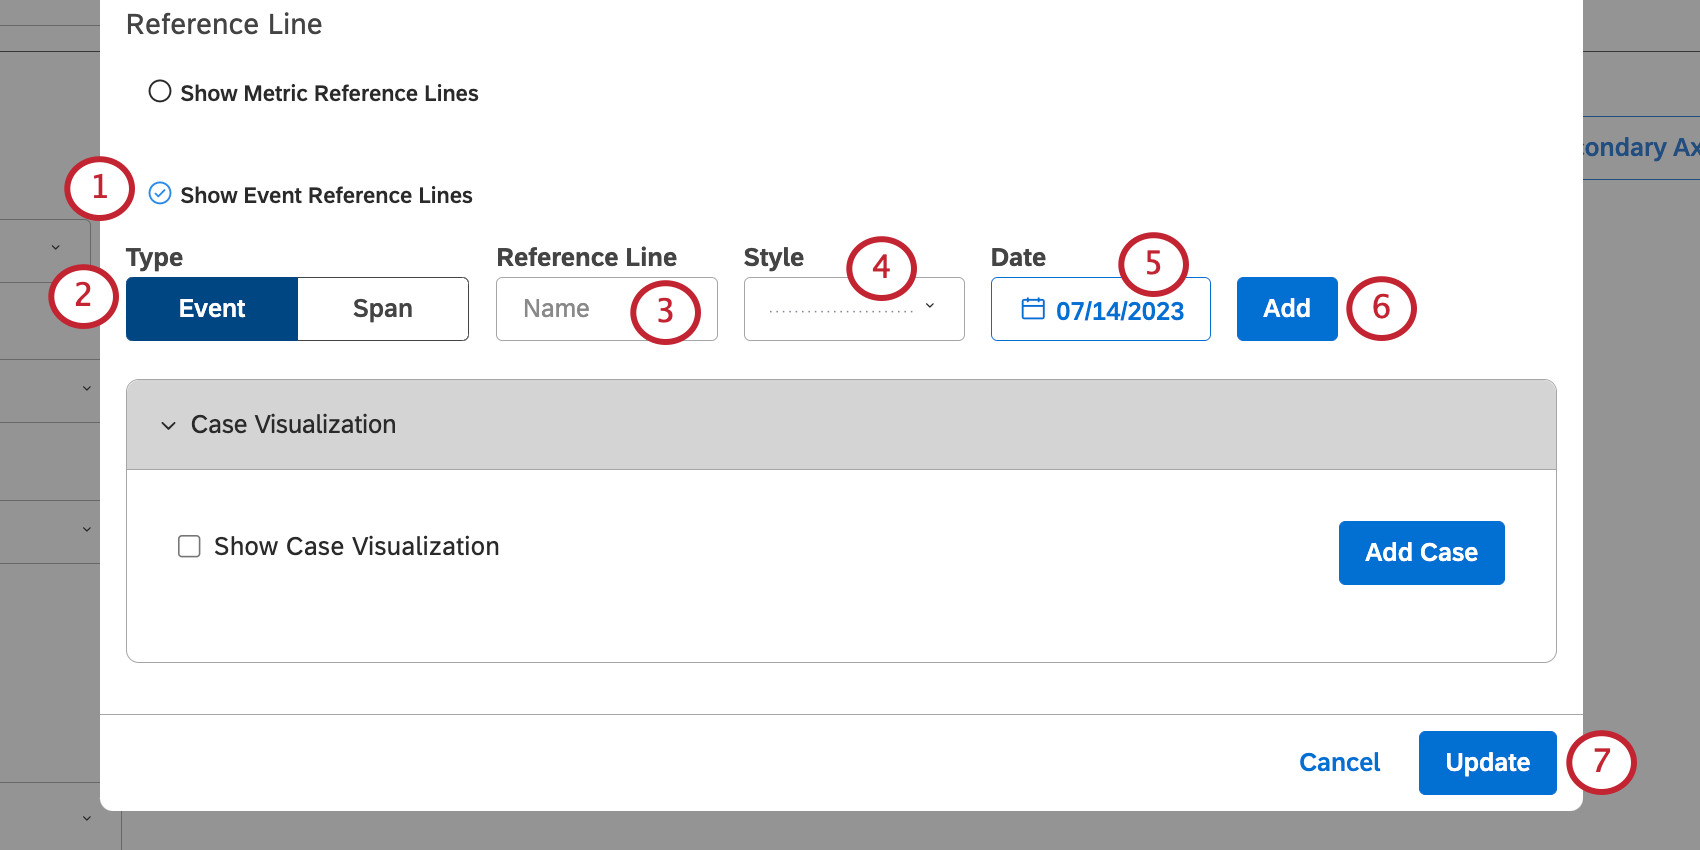
Select Show Event Reference Lines.
Select the type of line:
- Event: Represent a single date with a single vertical line placed on the x-axis.
- Span: Represent a date range with a vertical block of solid color across the x-axis. Qtip: These instructions assume you are using a line widget or a vertical bar chart. If your bar chart is horizontal or if you’ve adjusted your line widget’s axis, the axes will be reversed.

Name your reference line.
Choose a style for your reference line.
- If you selected Event, you can choose between solid and dotted lines, how many pixels it weighs, and the color of the line.
- If you selected Span, you can only change the color.
Define the date or date range for your line.>
Click Add.
When you’re finished adding lines, click Update.
Editing a Reference Line
Open your widget and click Options.
Click the edit icon.

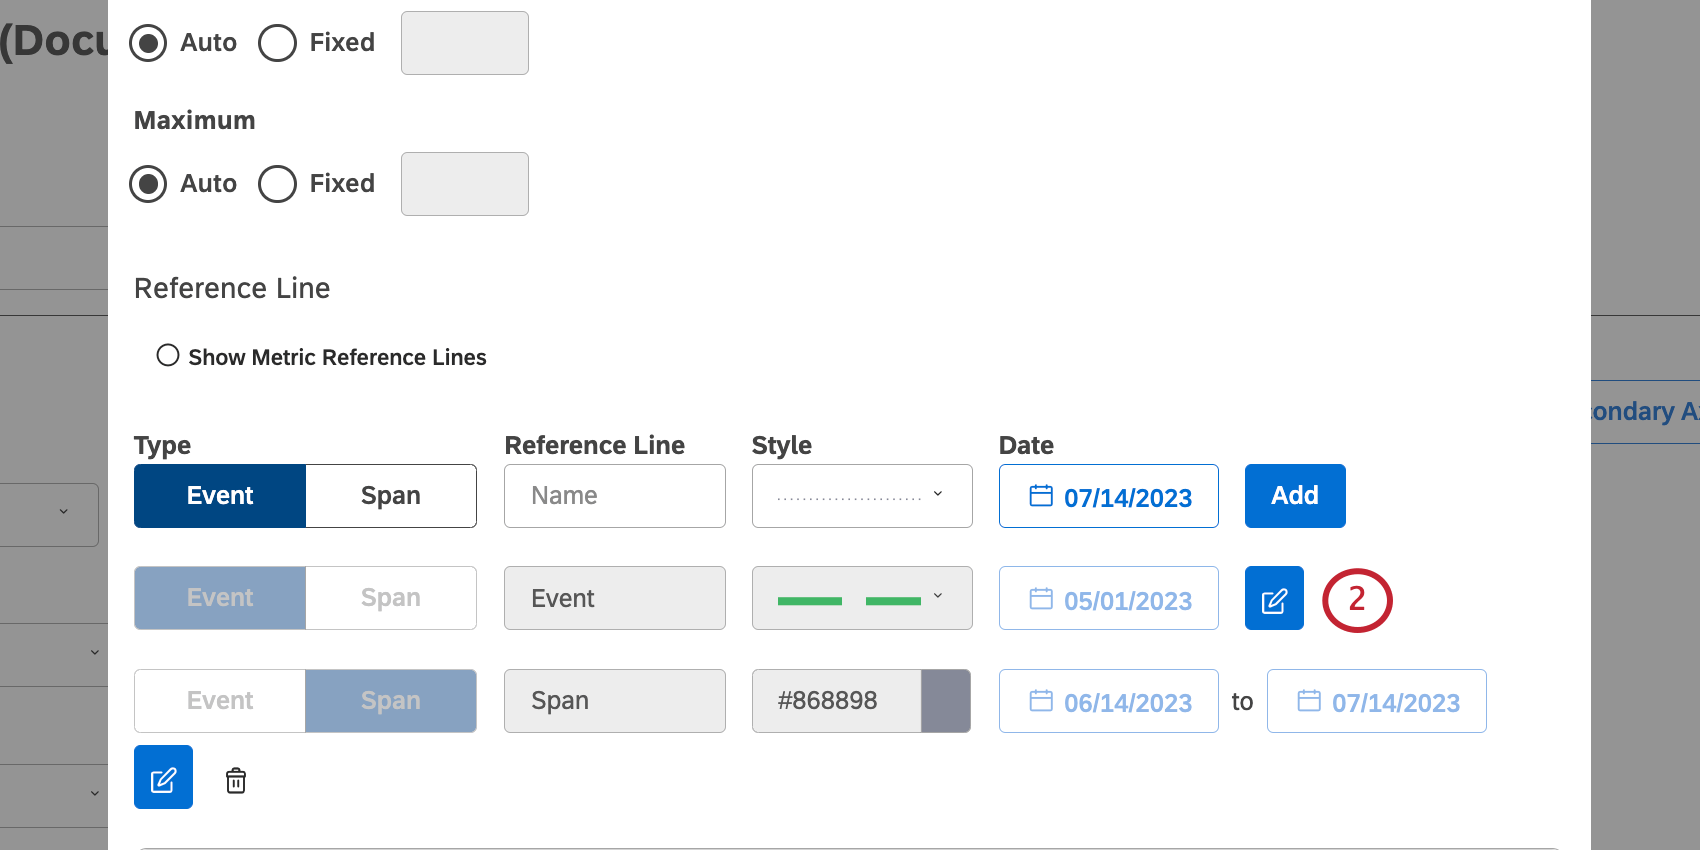
Make changes.

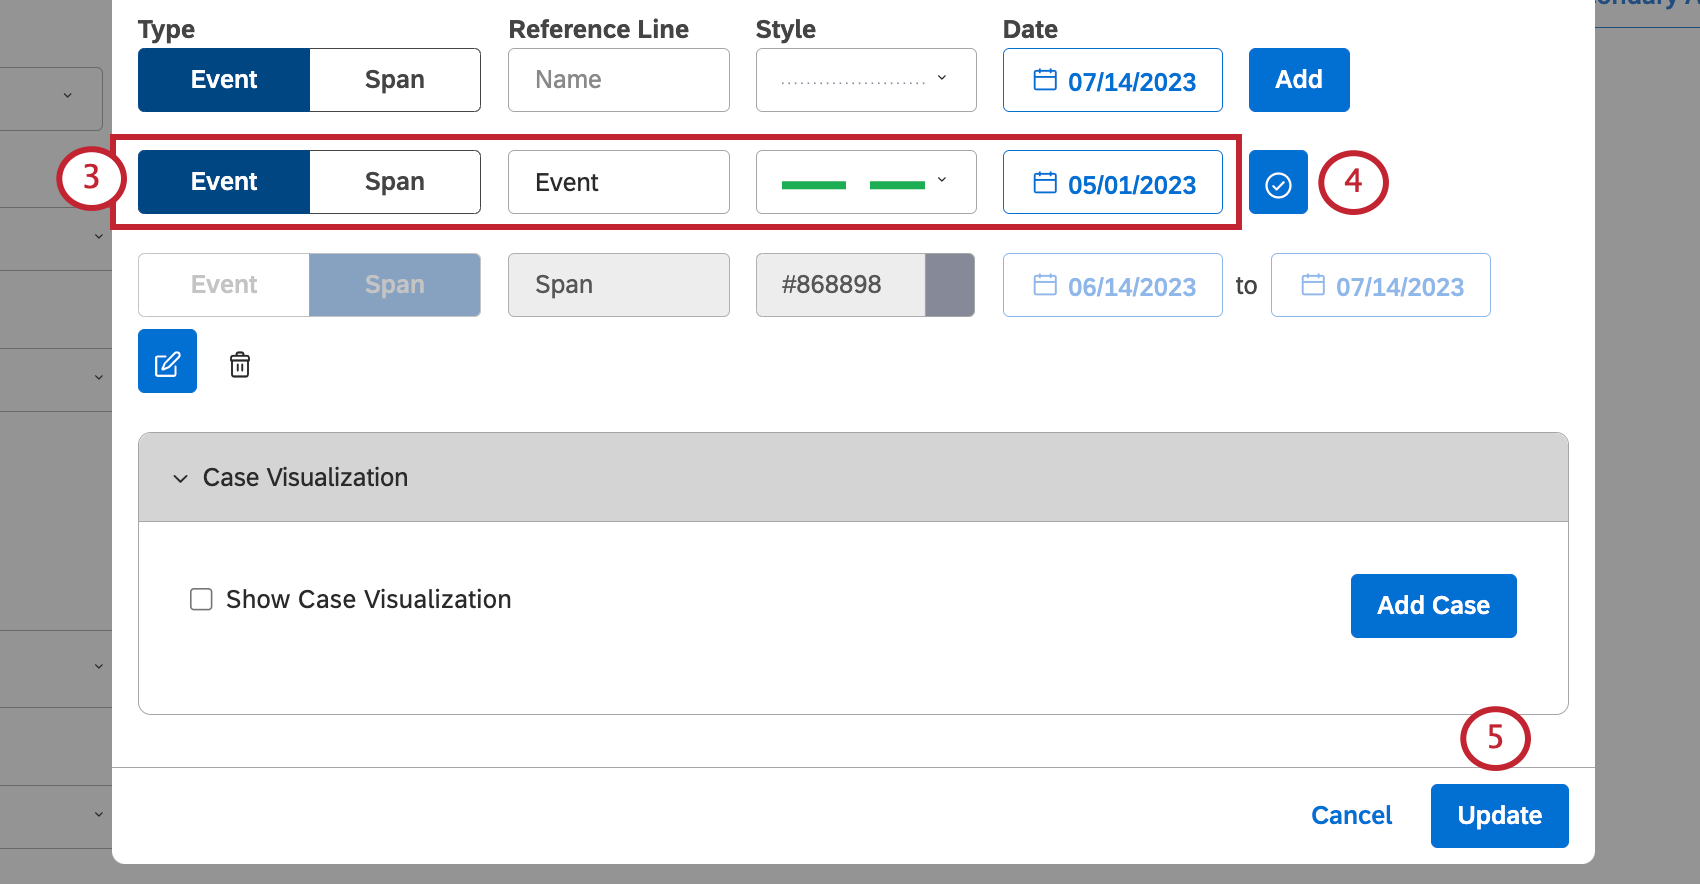
Click the edit icon again.
Click Update.
That's great! Thank you for your feedback!
Thank you for your feedback!