
Digital Opportunities Widget
What's on this page
About the Digital Opportunities Widget
Attention: This widget will only work with datasets created within the data modeler, not the data mapper.
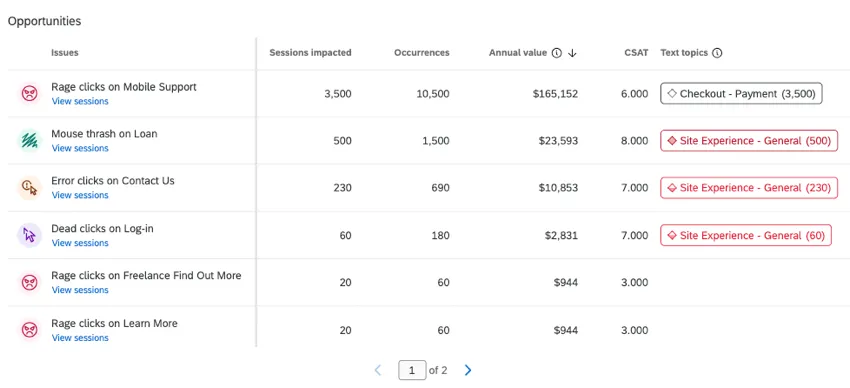
The digital opportunities widget lets you visualize data from Digital Experience Analytics in a CX dashboard. With this widget you can display session replay friction points and their location in a table. You can also display the number of impacted sessions, estimate lost revenue, and combine experiential data like survey responses or text analyses. To use this widget you must first enable session capture in a Website / App Insights project.
Data in this widget is filtered by page tags.
Attention: To use this widget, you must add at least 1 page tag within session replay settings. To view annual value, you must add at least 1 custom event that is marked as a conversion.
Data Mapping
For instructions on using Digital Experience Analytics data in your dashboard, see Viewing Data in a Dashboard.
Display Options
This section covers the different types of data that can be shown in your widget. Turn these options on or off to determine if they are displayed in your widget.
- Occurrences for each issue: The number of times an issue has occurred across all users.
- Dead clicks: A click on a web button or hyperlink that should have produced an action and does nothing.
- Error clicks: Clicking an element that results in an uncaught Javascript error within 50 milliseconds of click or 500 milliseconds of a finger tap.
- Mouse thrashes: At least 3 sudden rapid movements of the pointer when it reaches a speed of 2 pixels per millisecond.
- Rage clicks: At least 4 consecutive clicks that are less than 200 pixels and 300 milliseconds apart.
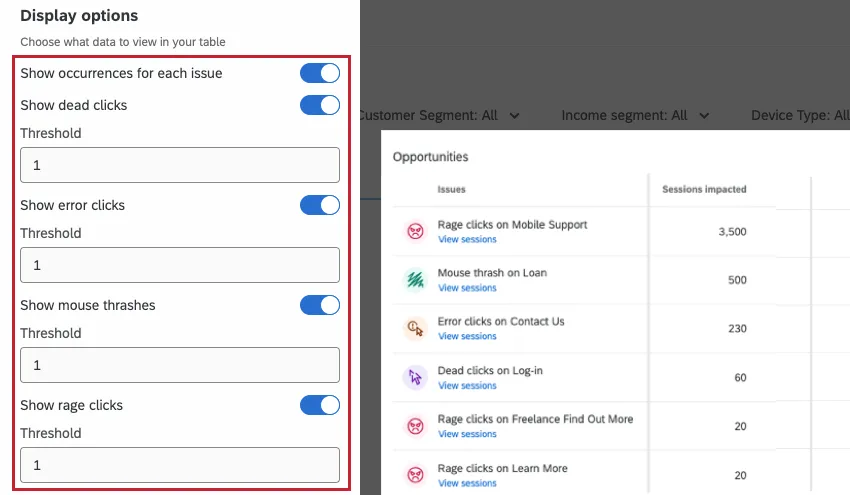
You can also set a threshold for each data type by entering a value greater than 0. This determines the minimum number of times an issue has to have occurred across all sessions to be displayed in the widget. If a data type does not meet the minimum threshold, it will not be displayed.
Annual Value
Annual value is an estimation of how much money your organization could make by fixing the issues displayed in your widget. To set up annual value for your website, follow these steps:
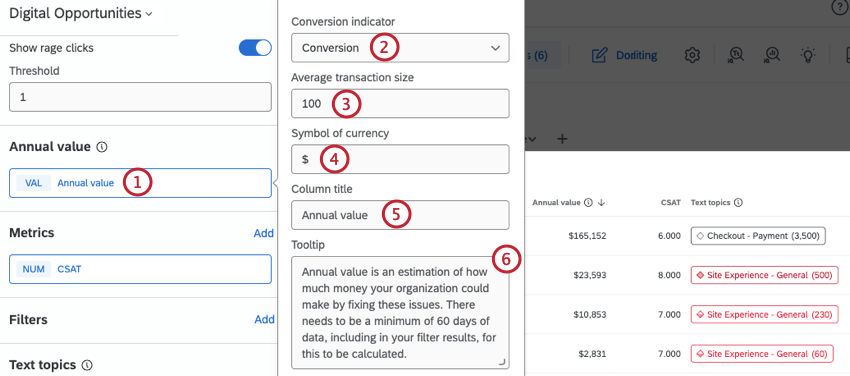
Attention: There needs to be a minimum of 60 days of data for annual value to be calculated. This includes within your filtered results if you have a filter applied.
Calculating Annual Value
Annual value is calculated using the following metrics:
- Conversion rate change: The difference between the conversion rate where the threshold of the frustration event is greater than the user provided value and the base conversion rate after. This number is a percentage.
- Frustrated sessions: The total number of sessions with frustrations over the defined period of time.
- Average transaction value: The average transaction value (e.g., cart size) for sessions that experience frustration.
- Analysis length: The number of days that the analysis was run.
To calculate annual value, these metrics are used in the following equation:
((conversion rate change) * (frustrated sessions) * (average transaction value) * 365)/(analysis length)
Qtip: The calculated value is multiplied by 365 to find an annual value.
Example: On my website, my normal conversion rate is 1.42% and this drops to 0.35% for frustration events. In a 90 day period, the number of sessions with frustrations for my site was 2,000 and the average cart size for frustration experiences was $125. Using the above equation to calculate annual value, I find:
((0.0142 – 0.0035) * 2,000 * $125 * 365) / 90 = $10,849
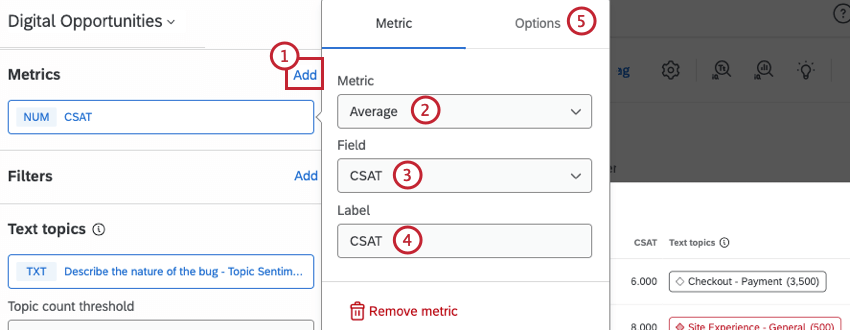
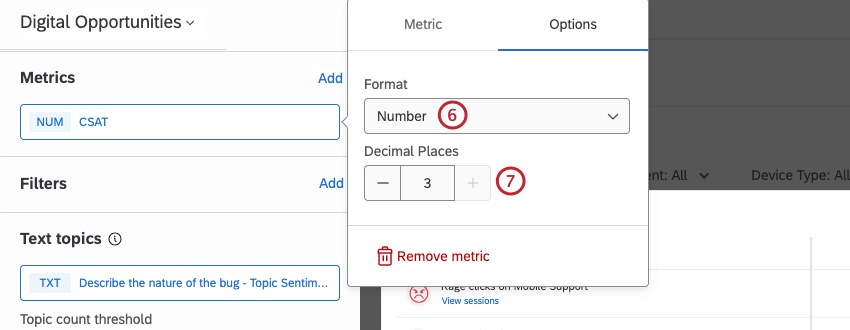
Metrics
In addition to session replay data, you can add other dashboard metrics as columns in your widget.
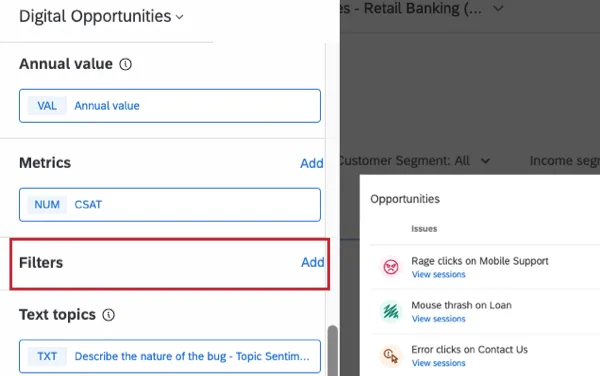
Filters
Filters allow you to display a subset of dashboard data within your widget. For instructions on adding widget filters, see Adding Widget Filters.
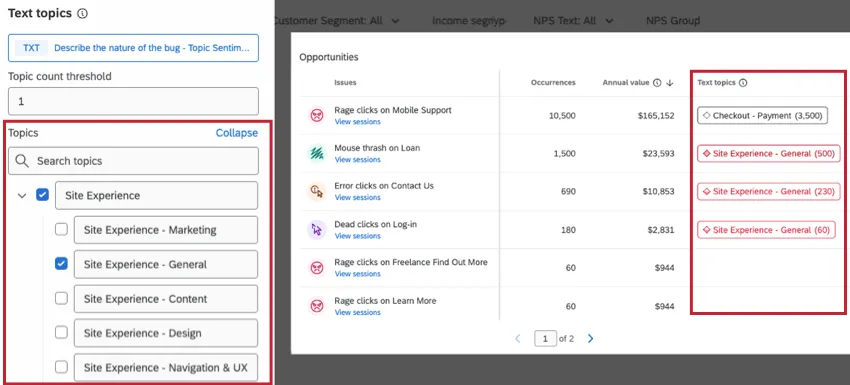
Text Topics
Attention: If you import topics or change the query of a topic in Text iQ, it may take up to an hour for your widget to display these changes.
Text topics are themes found in your customer feedback using Text iQ. Once you have created topics in Text iQ, you can select these topics to be included in your widget. The topic name and overall sentiment will be displayed as a column in the widget.
Use the checkboxes next to each topic name to select the topics you want to include. Click the arrow next to a topic to expand or condense any nested hierarchical topics.
Viewing User Sessions
Once your widget has been configured, you or a dashboard viewer can click View sessions to view a playlist of recorded sessions for each issue. This will open the playlist in a new tab.
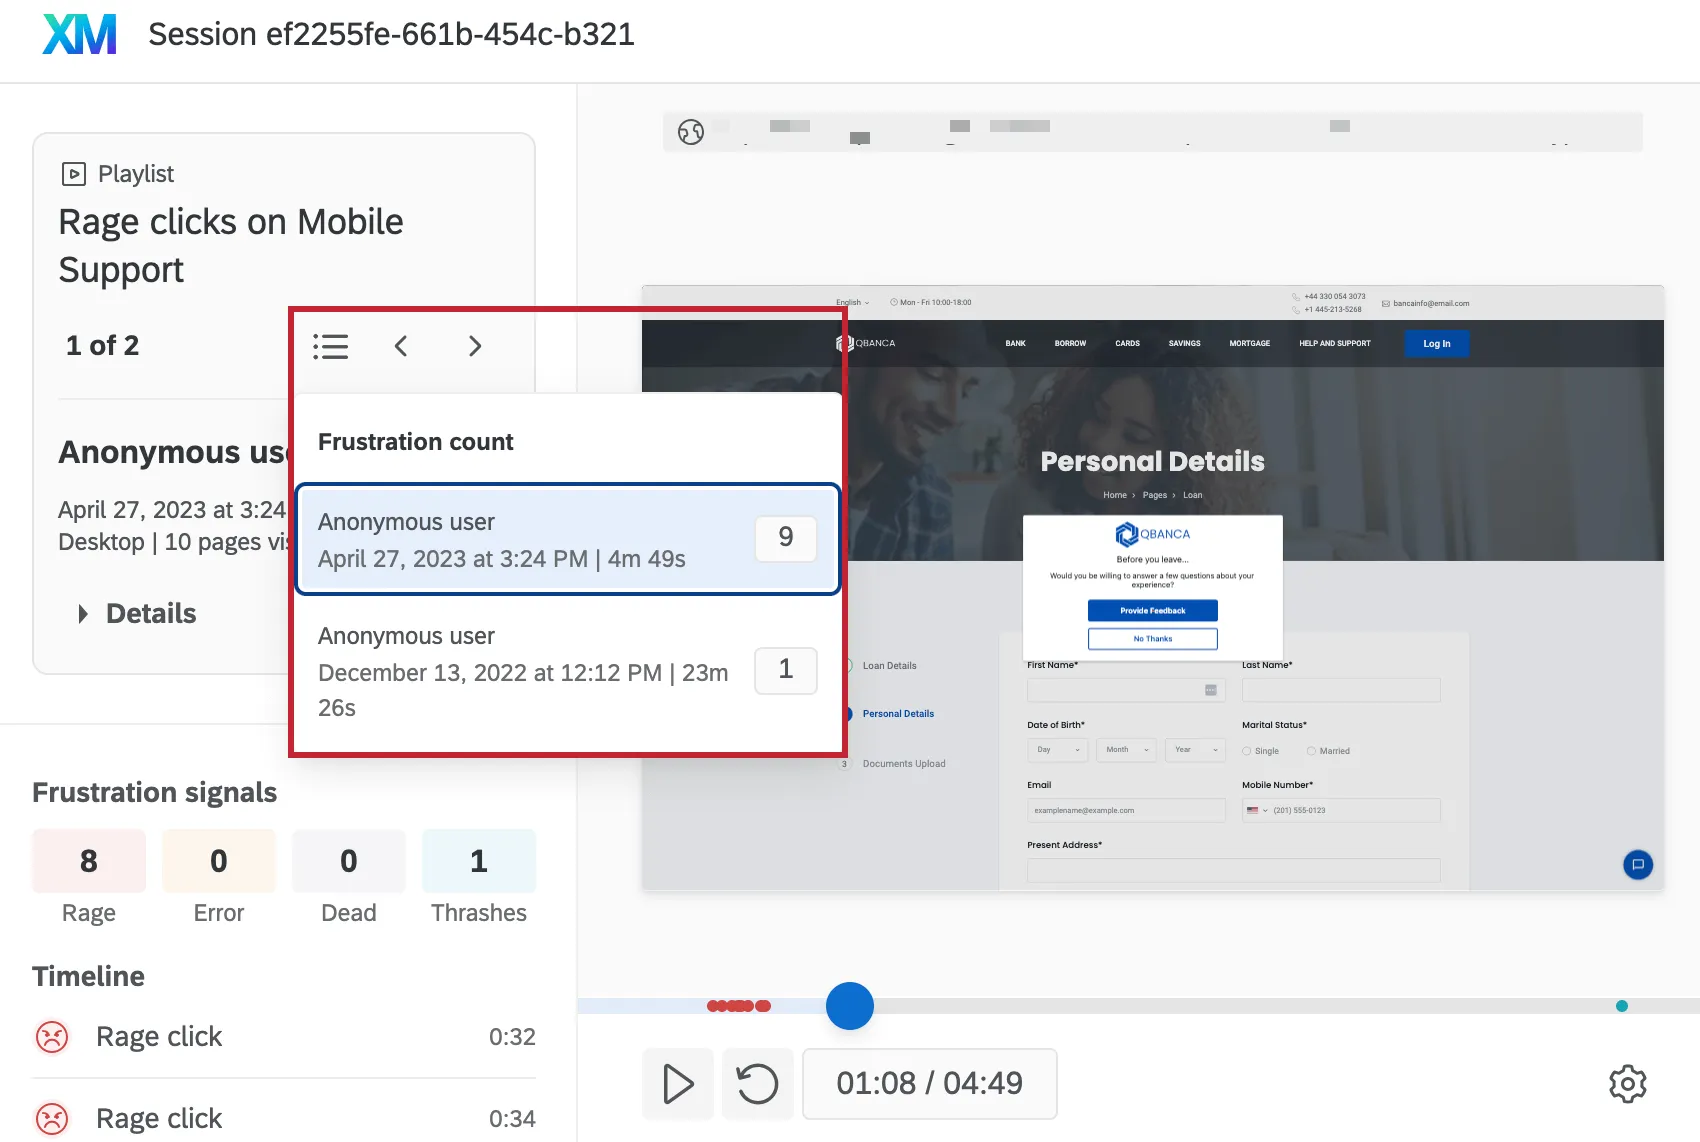
The information provided here is the same as viewing individual user sessions within the Sessions list. There is also a playlist button to view all sessions within the playlist, and you can click the arrows to navigate between session recordings.
FAQs
I have multiple datasets on my dashboard. Can I use this feature with all of my widgets?
I have multiple datasets on my dashboard. Can I use this feature with all of my widgets?
- Changing which dataset your widget shows: Not all widgets can have their referenced dataset switched. Some can only use the default dataset. For a compatible list, see this section.
- Showing multiple datasets in the same widget: Not all widgets can show multiple datasets’ results at the same time. For a compatible list, see this section.
That's great! Thank you for your feedback!
Thank you for your feedback!