
Stats iQ in Dashboards
What's on this page
Attention: Stats iQ is not available to all customers with CX Dashboards or Pulse programs. If you don’t have access to this feature and are interested, please contact Account Services.
About Stats iQ in Dashboards
Stats iQ is a powerful statistical analysis tool. With this tool, you can easily conduct analyses such as regressions, cluster analysis, and more.
Stats iQ can be used inside your dashboard to analyze data from all the sources loaded into your project mapper. It is meant to be a separate analysis tool from the dashboard itself, and as a result the analysis isn’t able to be displayed on the dashboard itself.
Qtip: The Stats iQ you access from the dashboard is not the same as one you access directly from a project. This is because using Stats iQ from a dashboard lets you analyze multiple sources for that dashboard; Stats iQ inside a survey cannot integrate different surveys’ data.
Qtip: Stats iQ an only be used in CX Dashboard projects, BX Dashboards, and Pulse programs.
Accessing Stats iQ
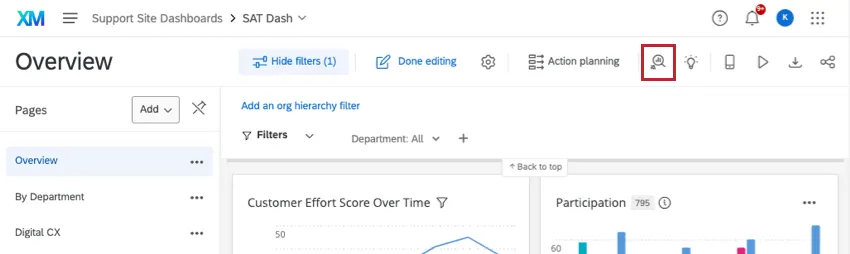
You can open Stats iQ in your dashboard by using the button in the upper-right of the screen.
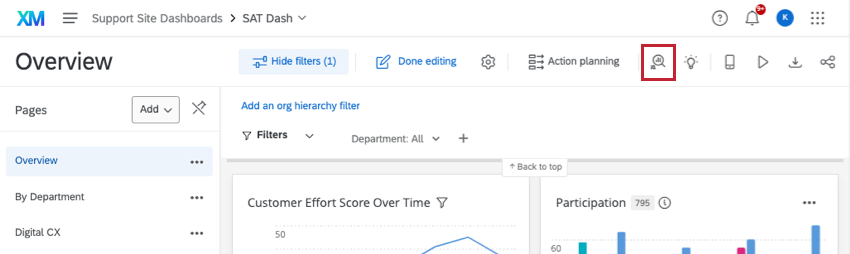
CX and BX Dashboards permissions
You need to have the following before you can have access to Stats iQ in the CX dashboard:
- Project administrator gives permission to access the dashboard with no data restrictions
- Project administrator gives permission to edit the dashboard
- Brand Administrator gives permission to use Stats iQ
Qtip: If you are a project administrator, you may see this button even if you don’t have Stats iQ permission. In that case, when you click the button, you will be taken to the message, “Only users of this dashboard who have Stats iQ enabled and have access to all data can use Stats iQ.” Contact your Brand Administrator if you think you are supposed to have access.
Pulse Dashboards permissions
First, you need to enable the Stats iQ permission in roles for the applicable participants.
Stats iQ is only available to the participant if the following is true:
- Restrict Data is disabled in the participant’s role.
- Can view sensitive fields and Can view comment fields are both enabled in the participant’s role.
- Enhanced Confidentiality is disabled for the dashboard.
Stats iQ Capabilities
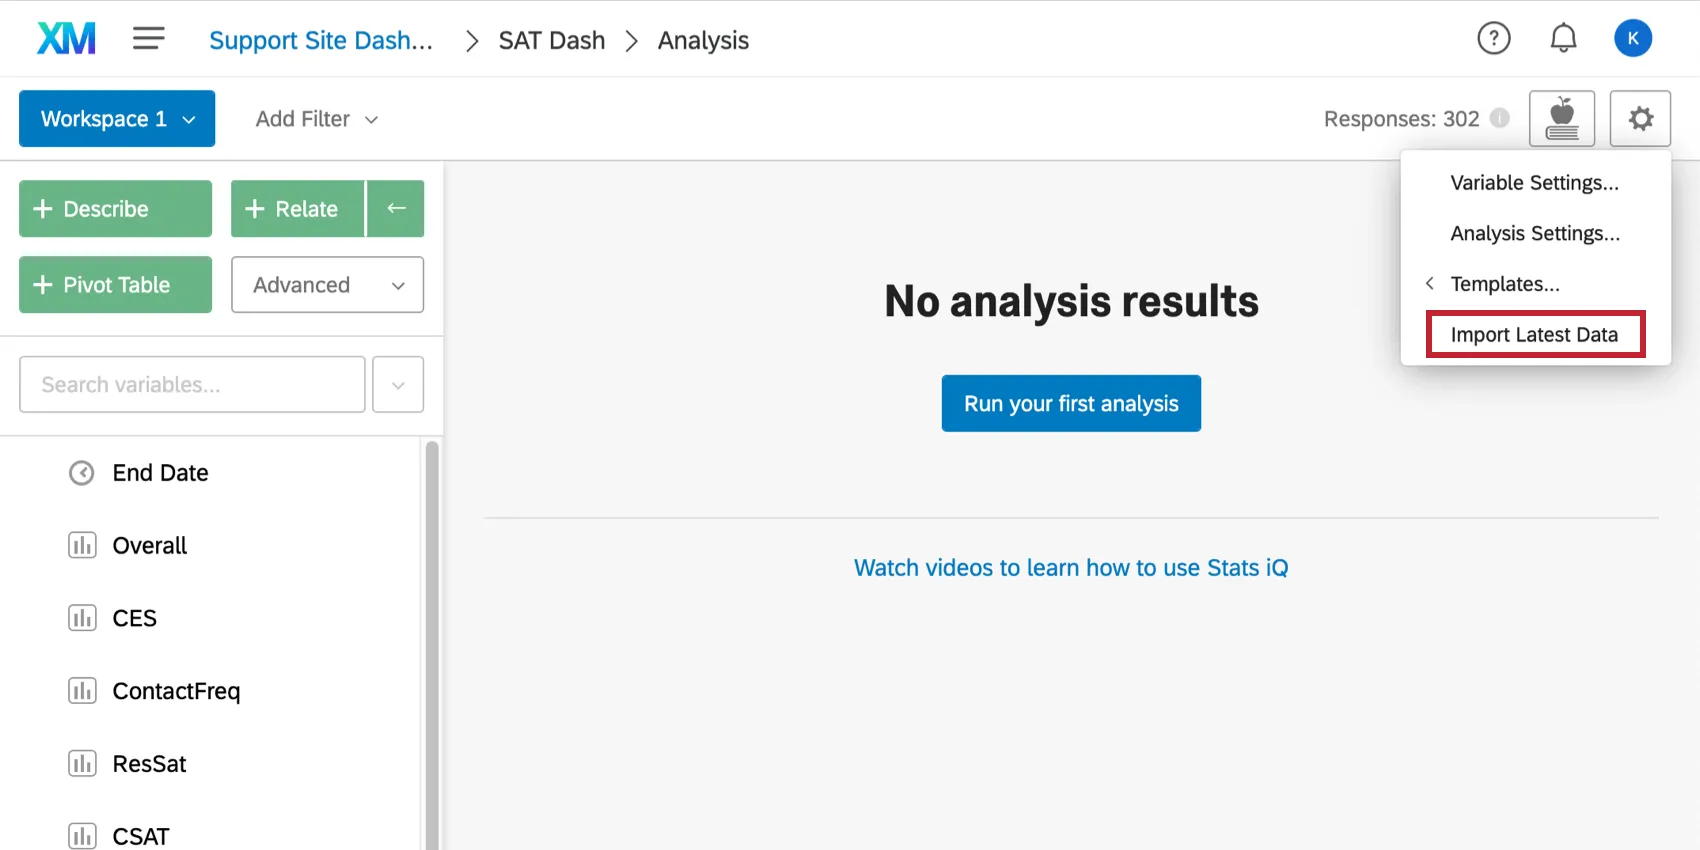
When you add sources to your dashboard, you will need to load them into Stats iQ. Click the Settings button and then select Import Latest Data.
Stats iQ has the same capabilities in a dashboards as it has in a survey project. The differences are that surveys and Imported Data projects are external to CX Dashboards and, while they can be used as sources in CX Dashboards, have separate Stats iQ.
See the menu to the left or the search at the top-right of the site to find Stats iQ pages. For beginners, check out our Stats iQ Basic Overview for a video and introductory material.
FAQs
What if I receive the message “No data is available”?
What if I receive the message “No data is available”?
Can I use Stats iQ in a Pulse dashboard?
Can I use Stats iQ in a Pulse dashboard?
Stats iQ is only available to the user if the following is true:
- Restrict Data is disabled in the user’s role.
- Can view sensitive fields and Can view comment fields are both enabled in the user’s role.
- Enhanced Anonymity is disabled for the dashboard.
That's great! Thank you for your feedback!
Thank you for your feedback!