
Record Table Widget
What's on this page
About the Record Table Widget
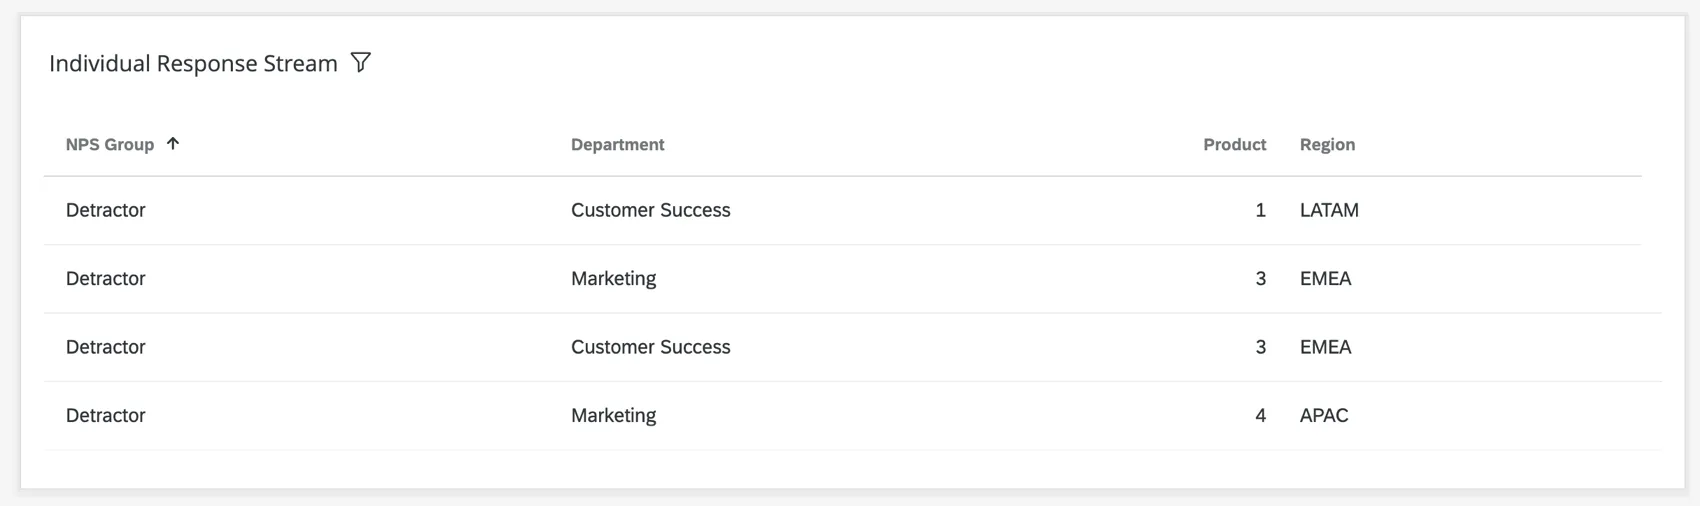
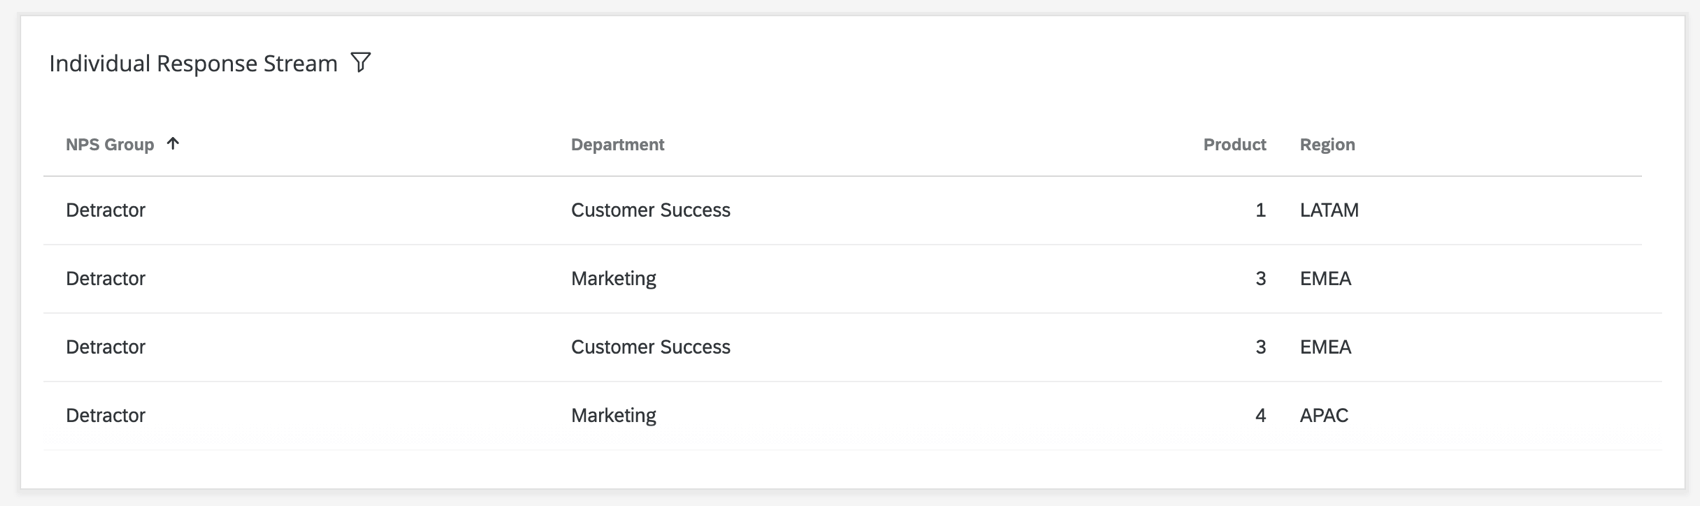
The record table widget displays data from survey responses. This widget can be used to quickly compare how individuals responded to different parts of the survey, including responses to text entry and other comments which are not as easy to display in other widgets.
Feature Availability
Record table widgets are only available in the following types of dashboards:
- CX Dashboards
- Results Dashboards
- 360 Dashboards
- BX Dashboards
- Employee Engagement
- Lifecycle
- Employee Journey Analytics Qtip: Record table widgets are only available within action planning pages in EX Dashboards.

Field Type Compatibility
The record table widget is compatible with the following field types:
- Numeric Value
- Number Set
- Date
- Text Value
- Text Set
- Multi-Answer Text Set
- Open Text
- Drill Down
Only fields with the above type will be available when selecting the columns for the record grid.
Widget Customization
For basic widget instructions and customization, visit the Building Widgets support page. Continue reading for record grid-specific customization.
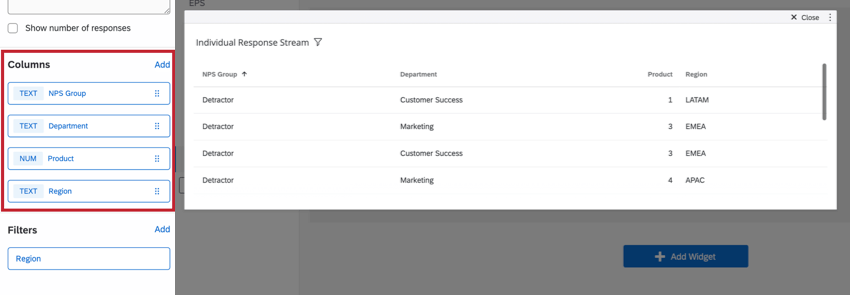
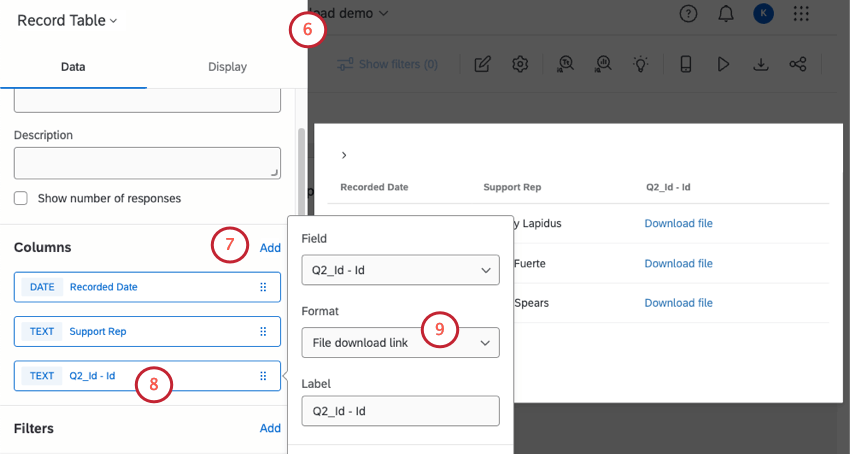
COLUMNS
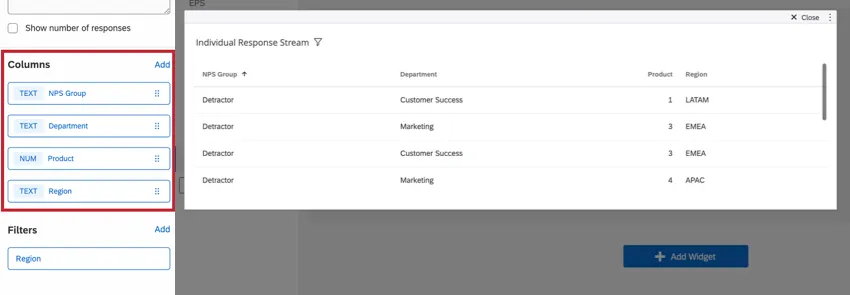
Add columns to your record grid widget to start displaying data. You can add as many columns as you want.
Qtip: In 360 dashboards with this widget, you cannot add columns containing the fields SubjectResponseID or ResponseID. This is to protect the integrity of subjects’ responses.
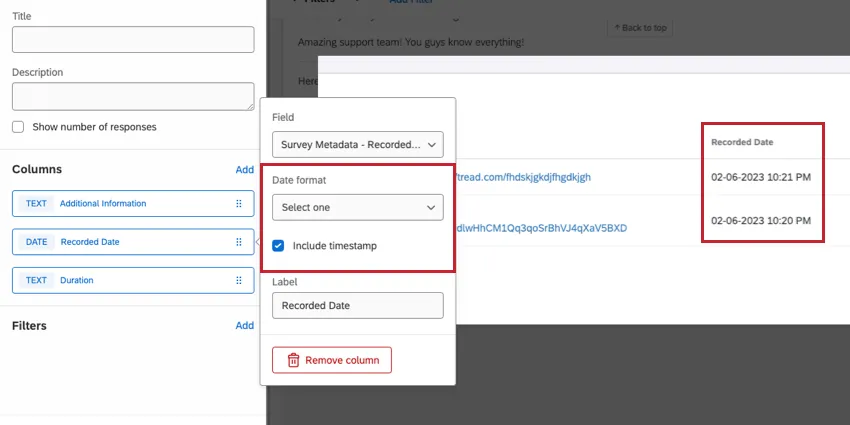
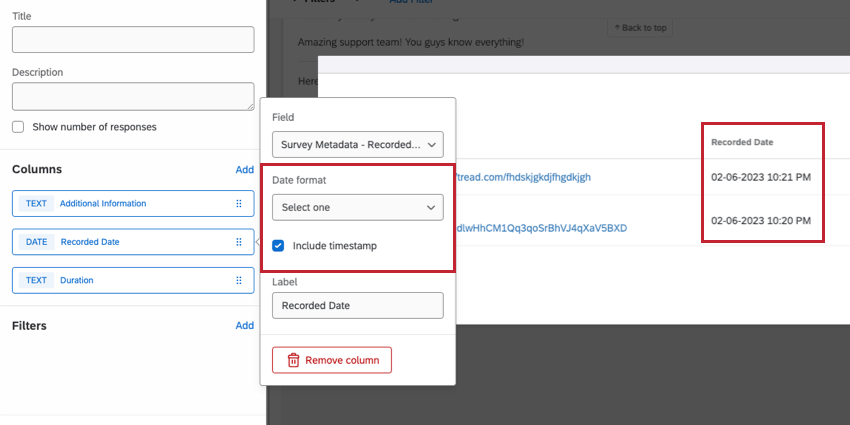
Column Format Types
When you click on a column, you can change its format. This lets you customize fields containing URLs and date fields.
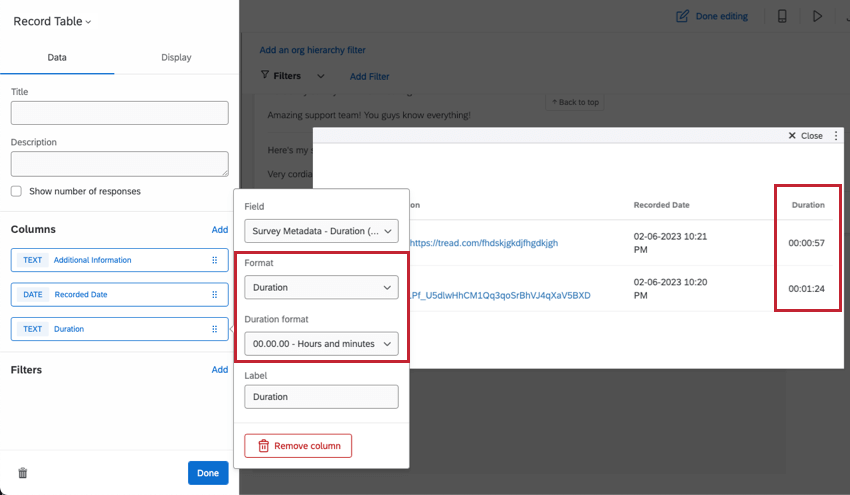
Qtip: Surveys automatically record duration, i.e., how long it took a respondent to finish a survey. You can also record duration from Website Feedback interactions.
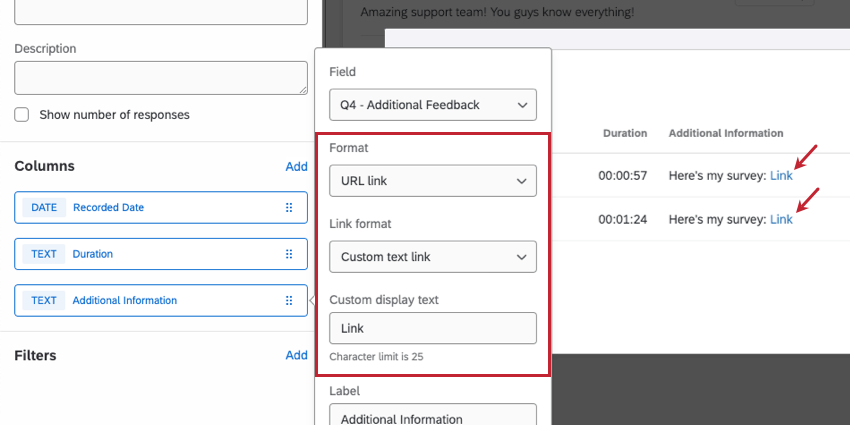
Qtip: The custom display text will only successfully override the URL if the URL contains http:// or https://.
Qtip: The URL doesn’t have to be the only information in the response. For example, the response could contain feedback in addition to the link.
Qtip: The character limit for custom display text is 25.
Formatting Dates
When you’ve added a date field to your widget, you can change the date format (e.g., day-month-year vs. month-day-year). You can also include a timestamp.
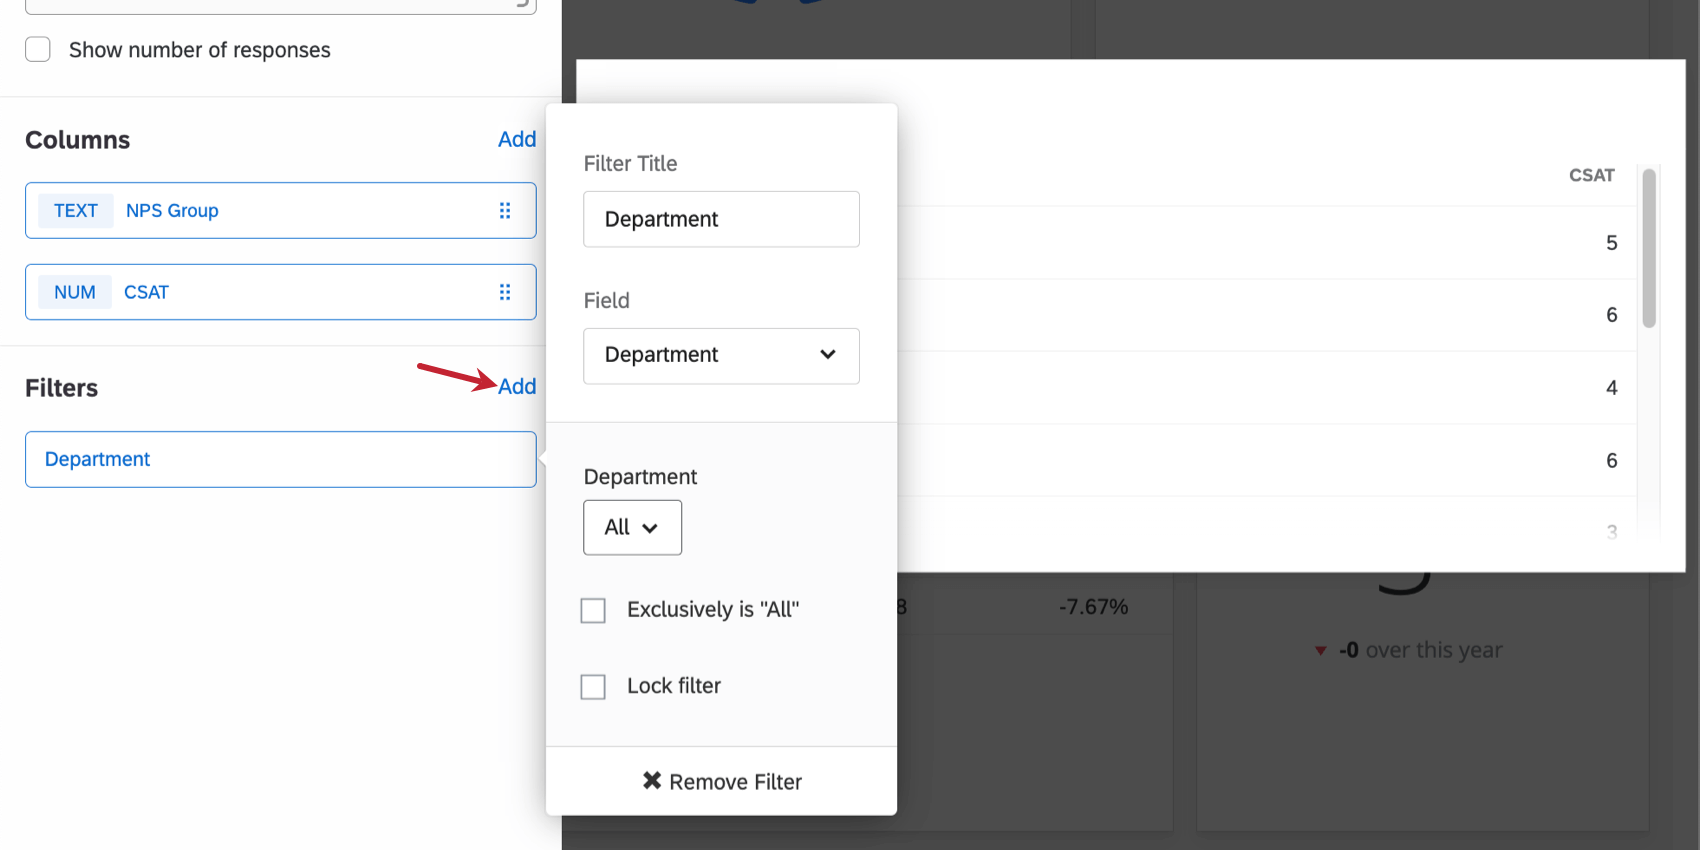
FILTERS
You can add a filter to your widget for a more granular look at the data in your chart. Click Add and then decide which metrics to include or exclude.
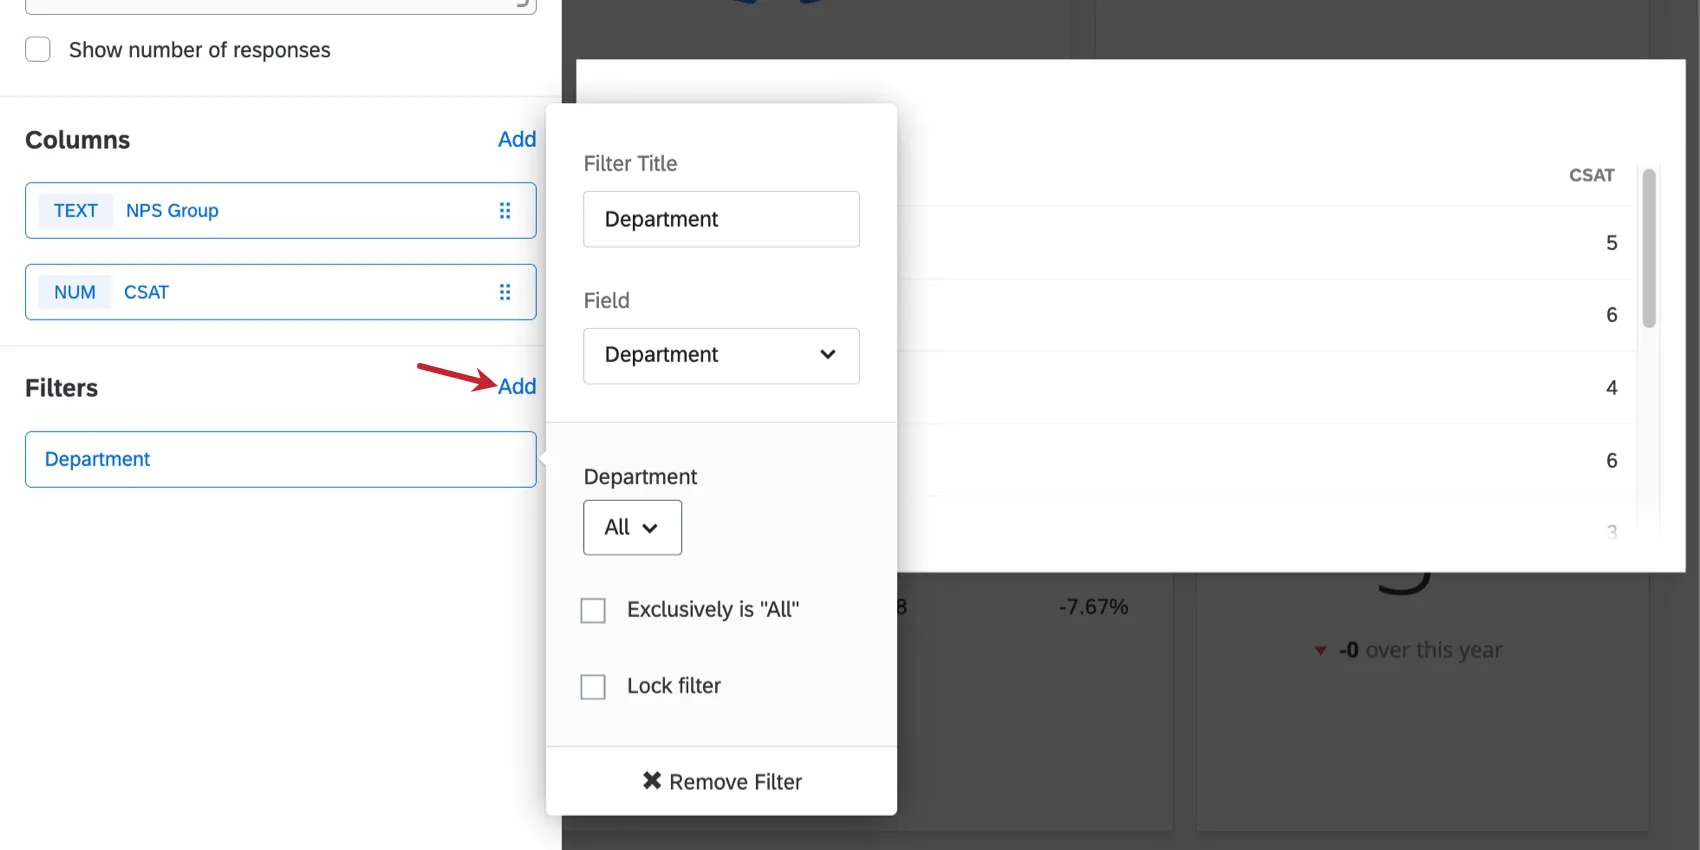
- Exclusively is: Limits filter to responses that have all of the selected field options. Without this enabled, the filter will limit responses to those that have any of the fields listed.
- Lock filter: Prevents dashboard users from modifying this filter.
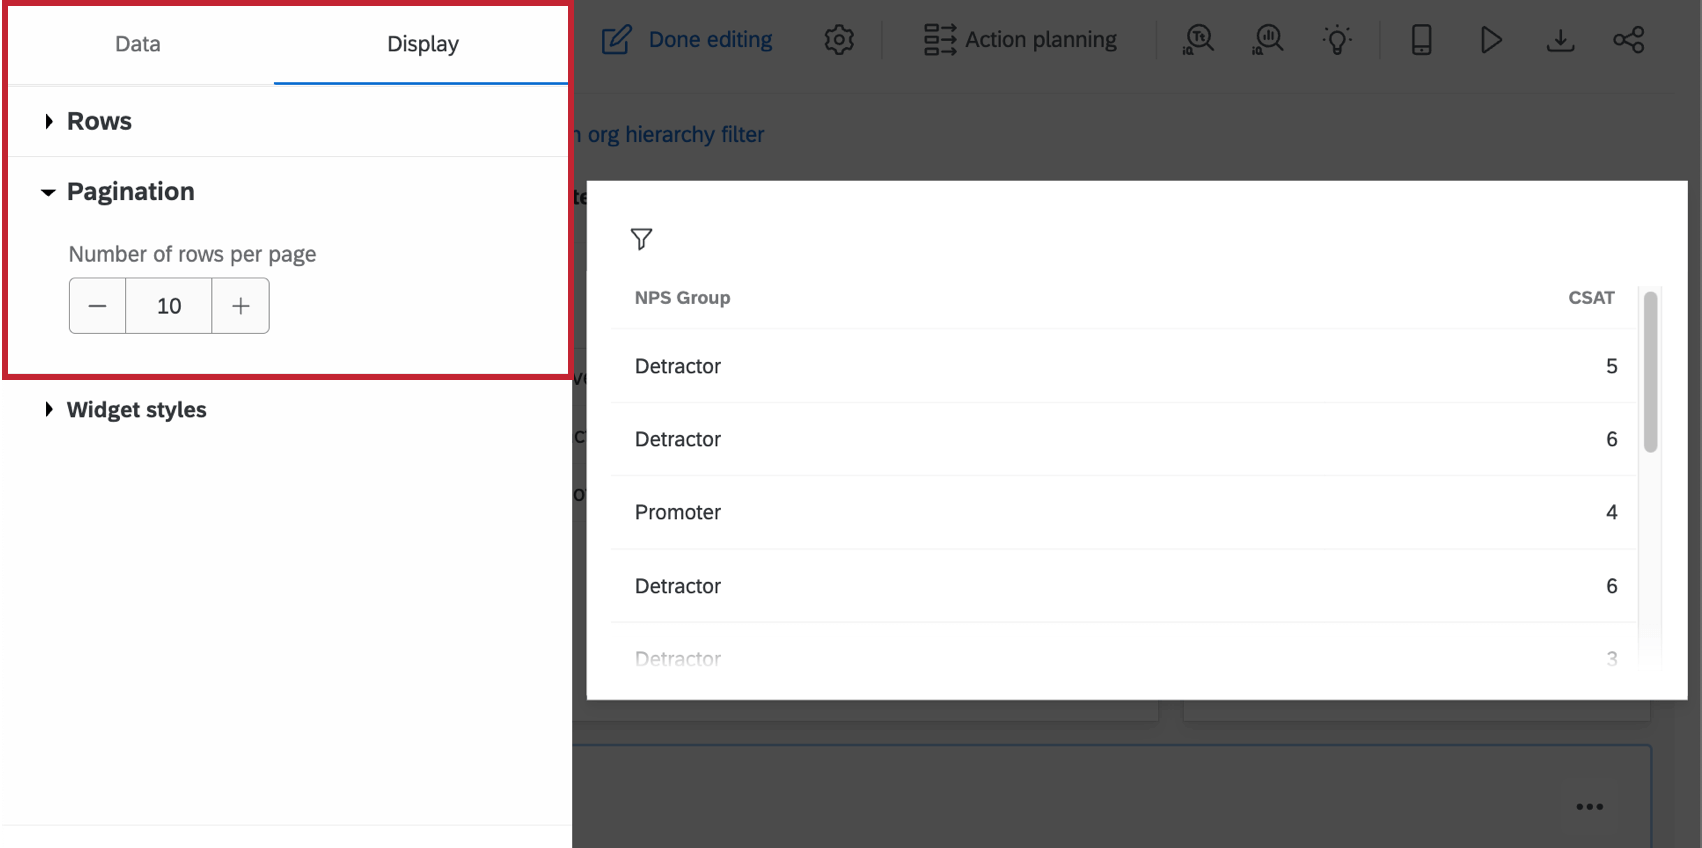
DISPLAY OPTIONS
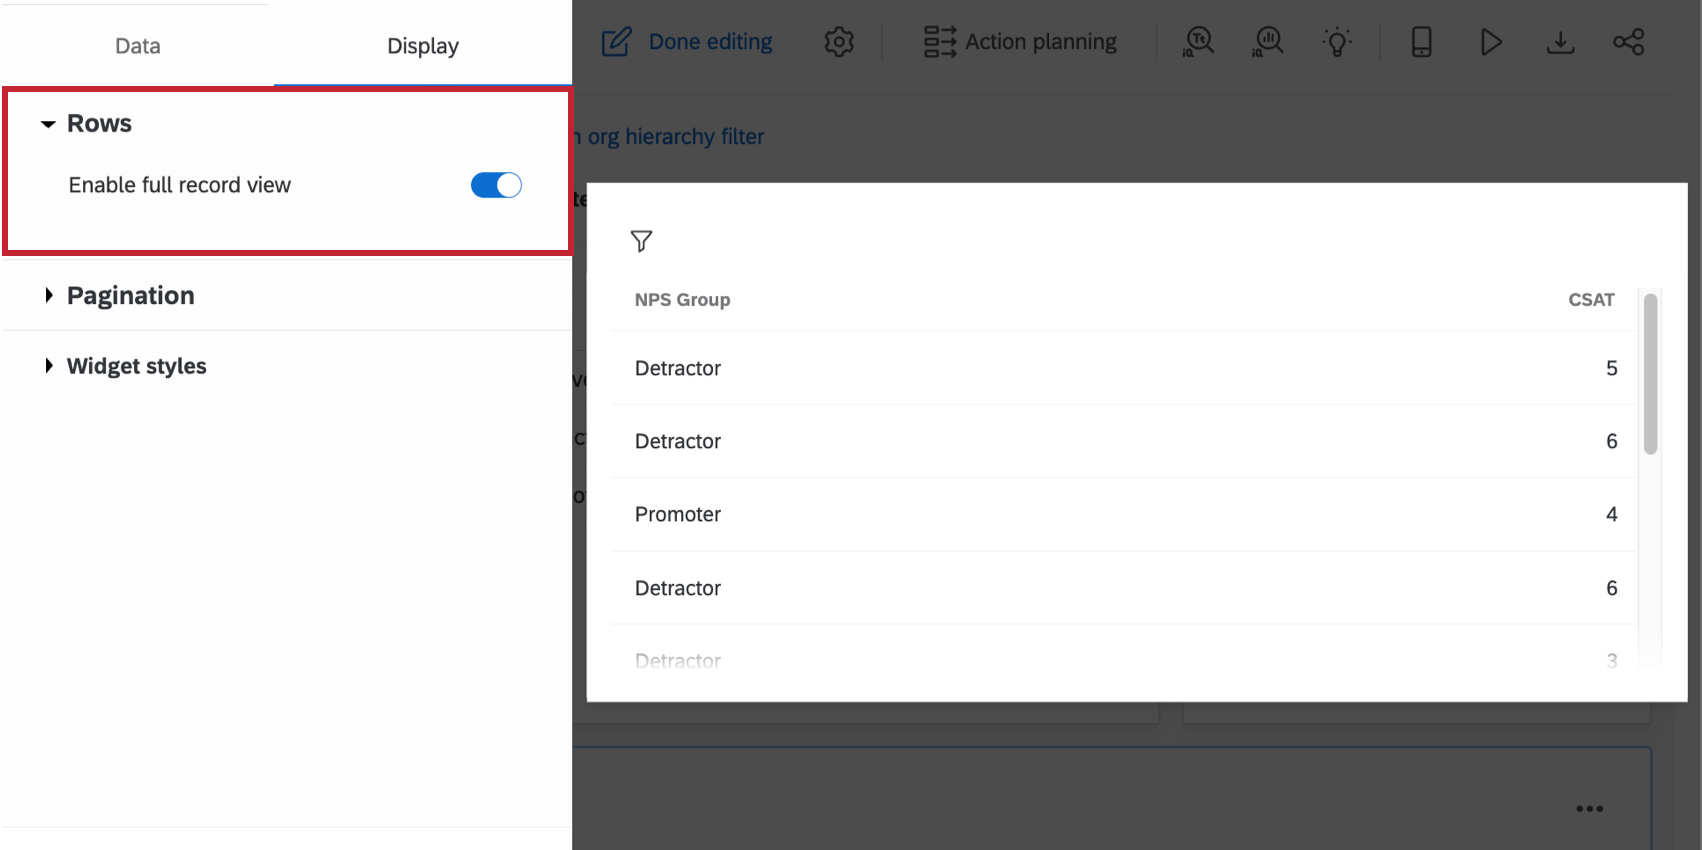
By selecting Display in the configuration panel, you can Enable Full Record View and customize the pagination.
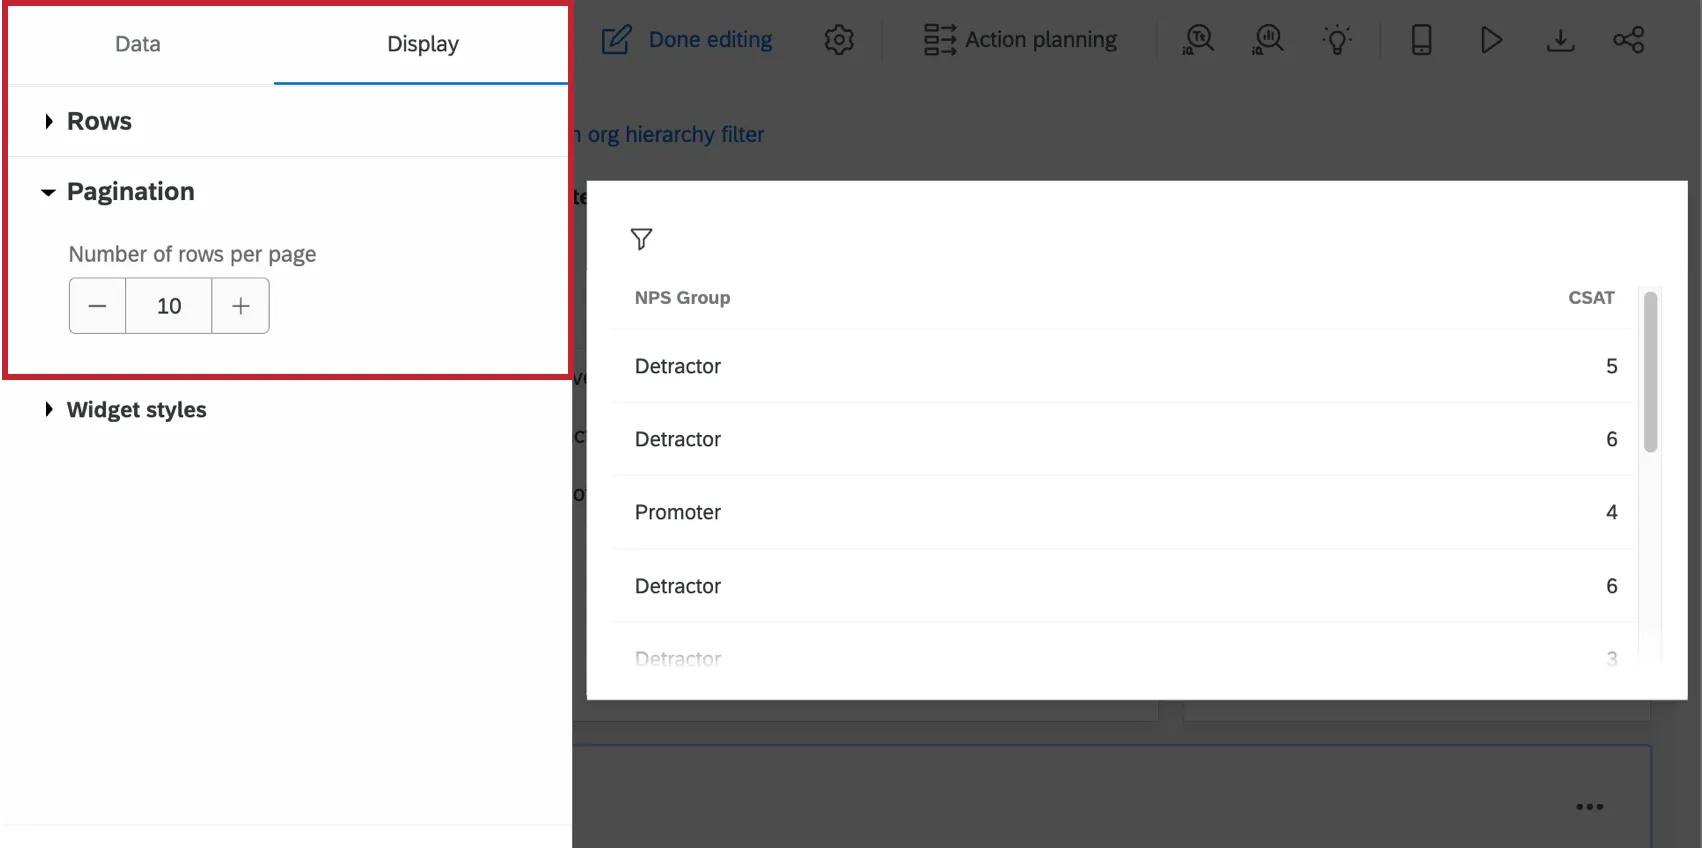
- Rows: Allows you to enable full record view. See Enabling Full Record View for more information.
- Pagination: Select the number of rows to display per page. By default, 10 responses will display. You can display up to 100 rows per page.
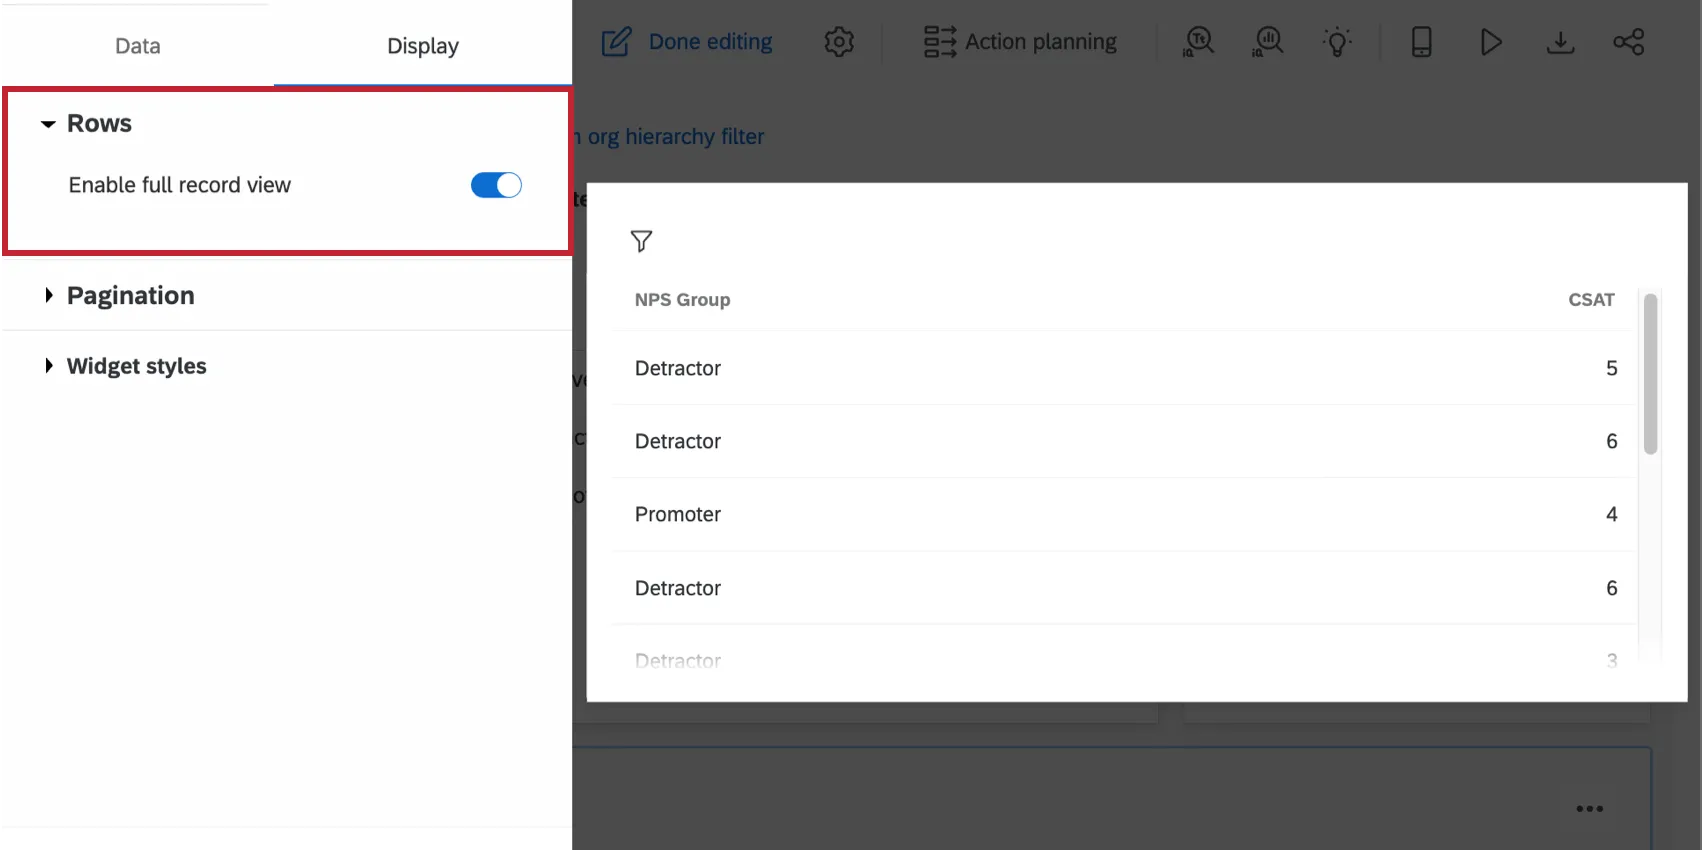
Enabling Full Record View
Qtip: In 360 dashboards with this widget, you cannot display the fields SubjectResponseID or ResponseID. This is to protect the integrity of subjects’ responses.
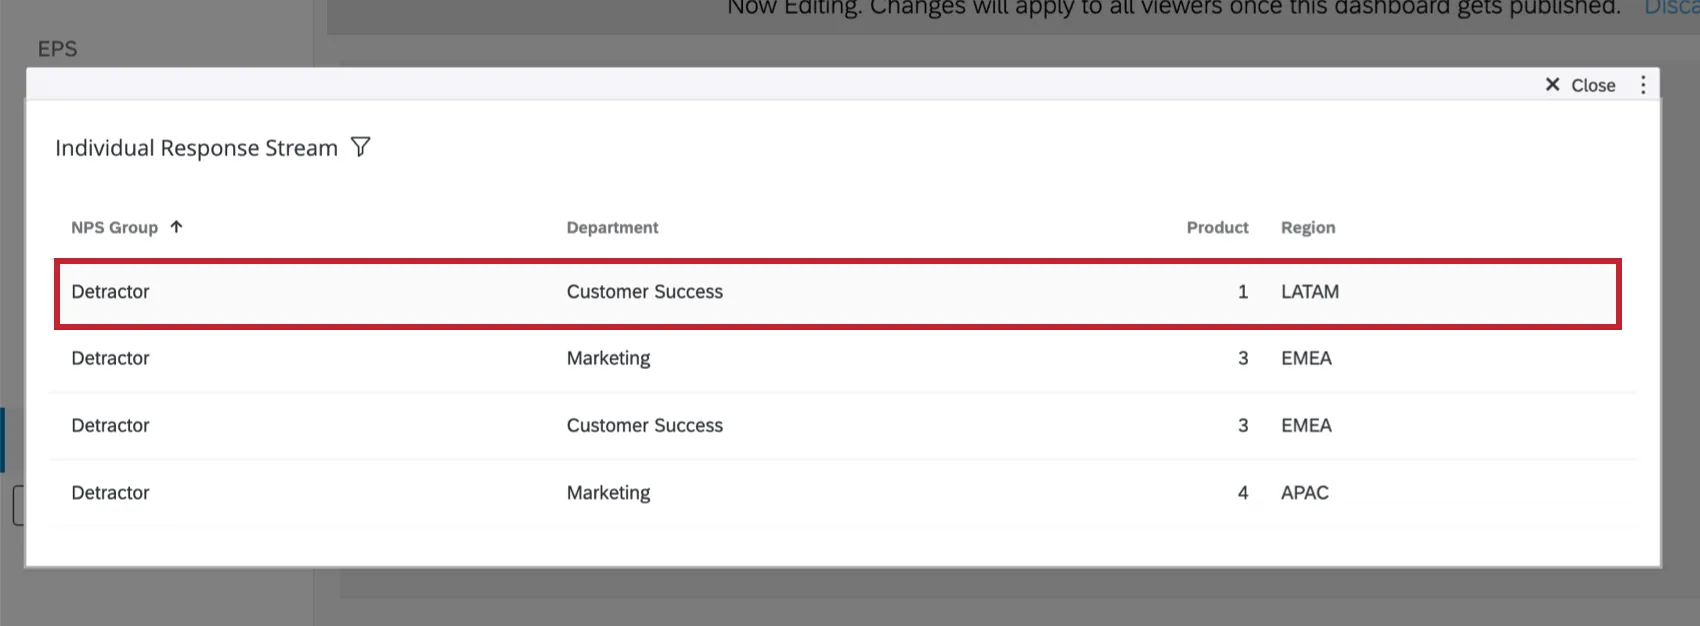
Enabling this option allows someone to view a detailed record of the response when clicking on a row in the record table. From this menu they can also view related tickets, action those tickets, and email the client directly. This integration prevents dashboard users from having to navigate between their tickets and the dashboard.
To enable this feature, navigate to the display settings and select Enable full record view.
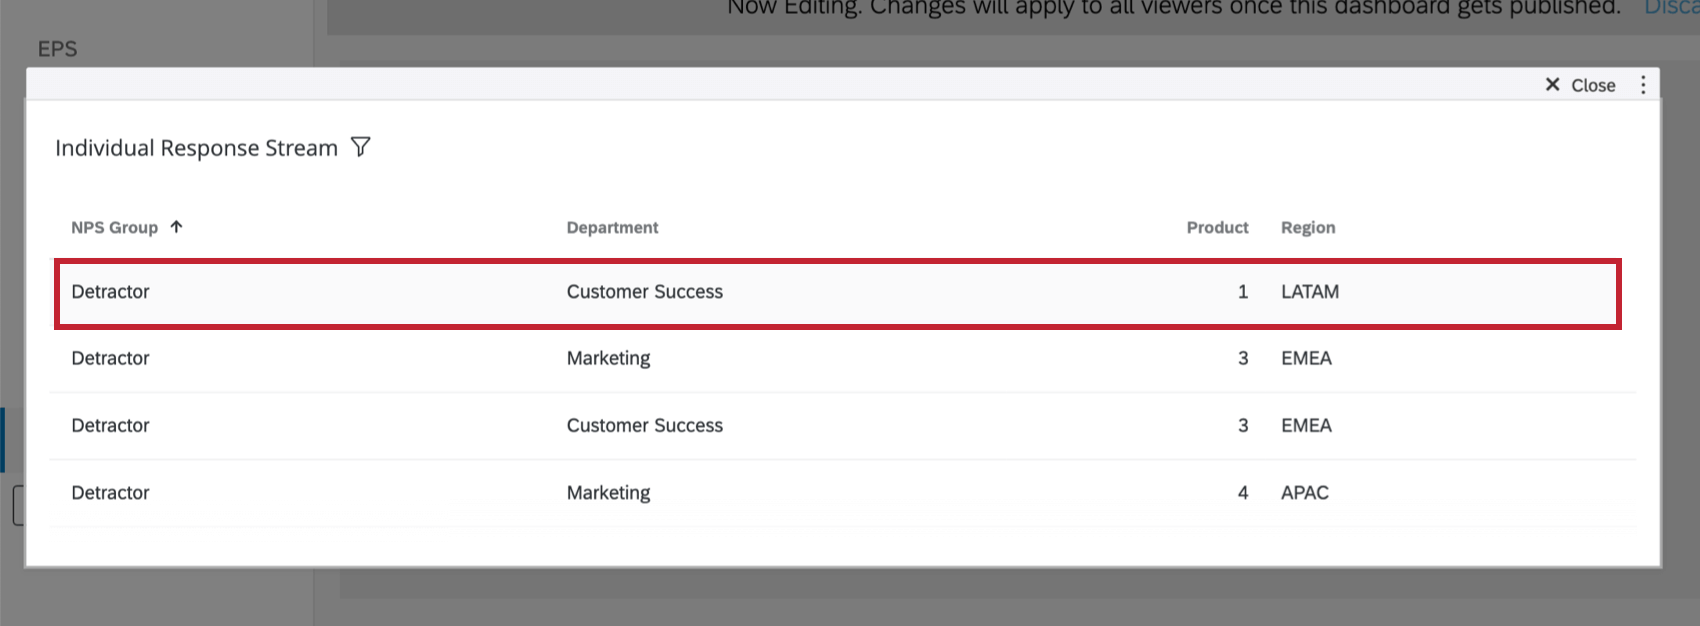
After this setting is enabled, click anywhere on a row of the widget to expand that row’s response record.
Qtip: Only dashboard administrators can edit the record.
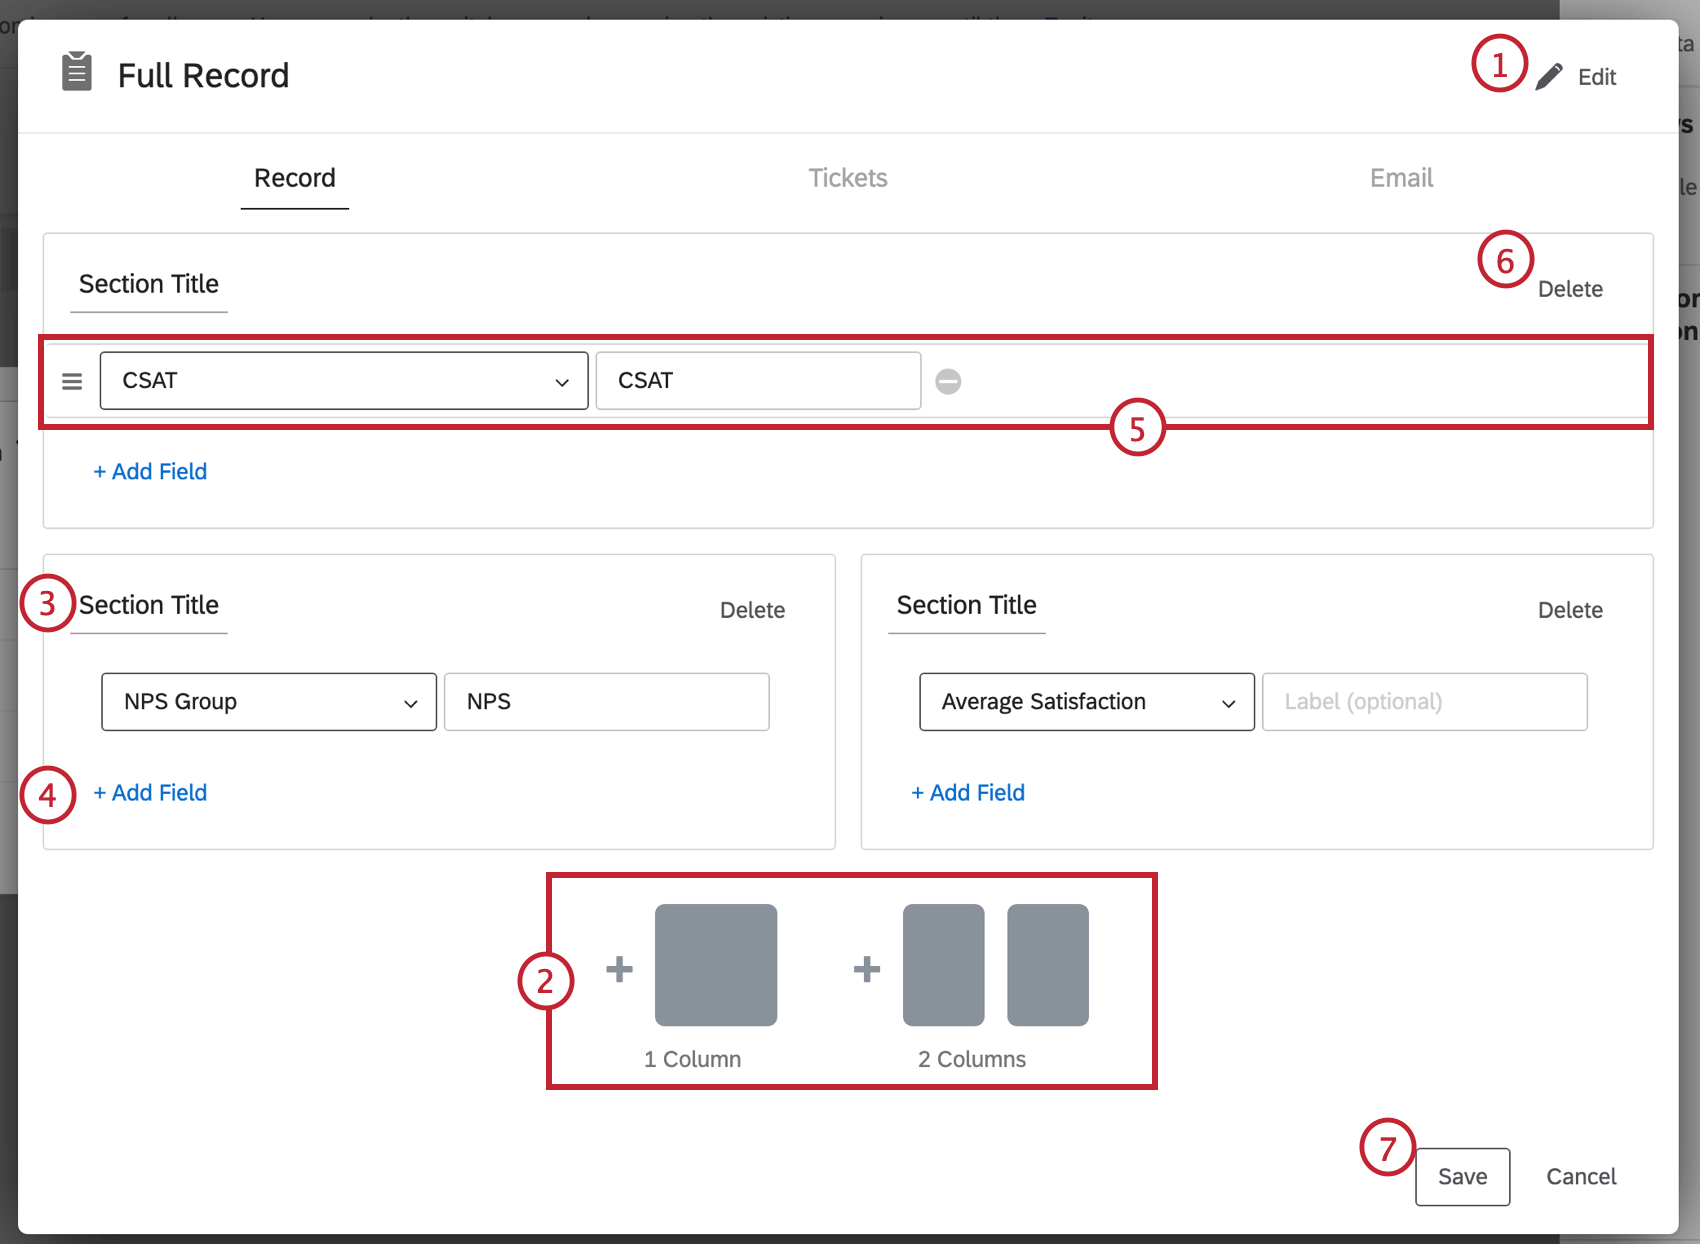
Qtip: Your widget must be in edit mode to be able to edit a response record.
Qtip: The fields available in records are pulled from the Dashboard Data. When selecting fields, you will see every field mapped in your dashboard, not just a list of specific survey fields. If you want to report on a particular field, make sure it is mapped to the dashboard.
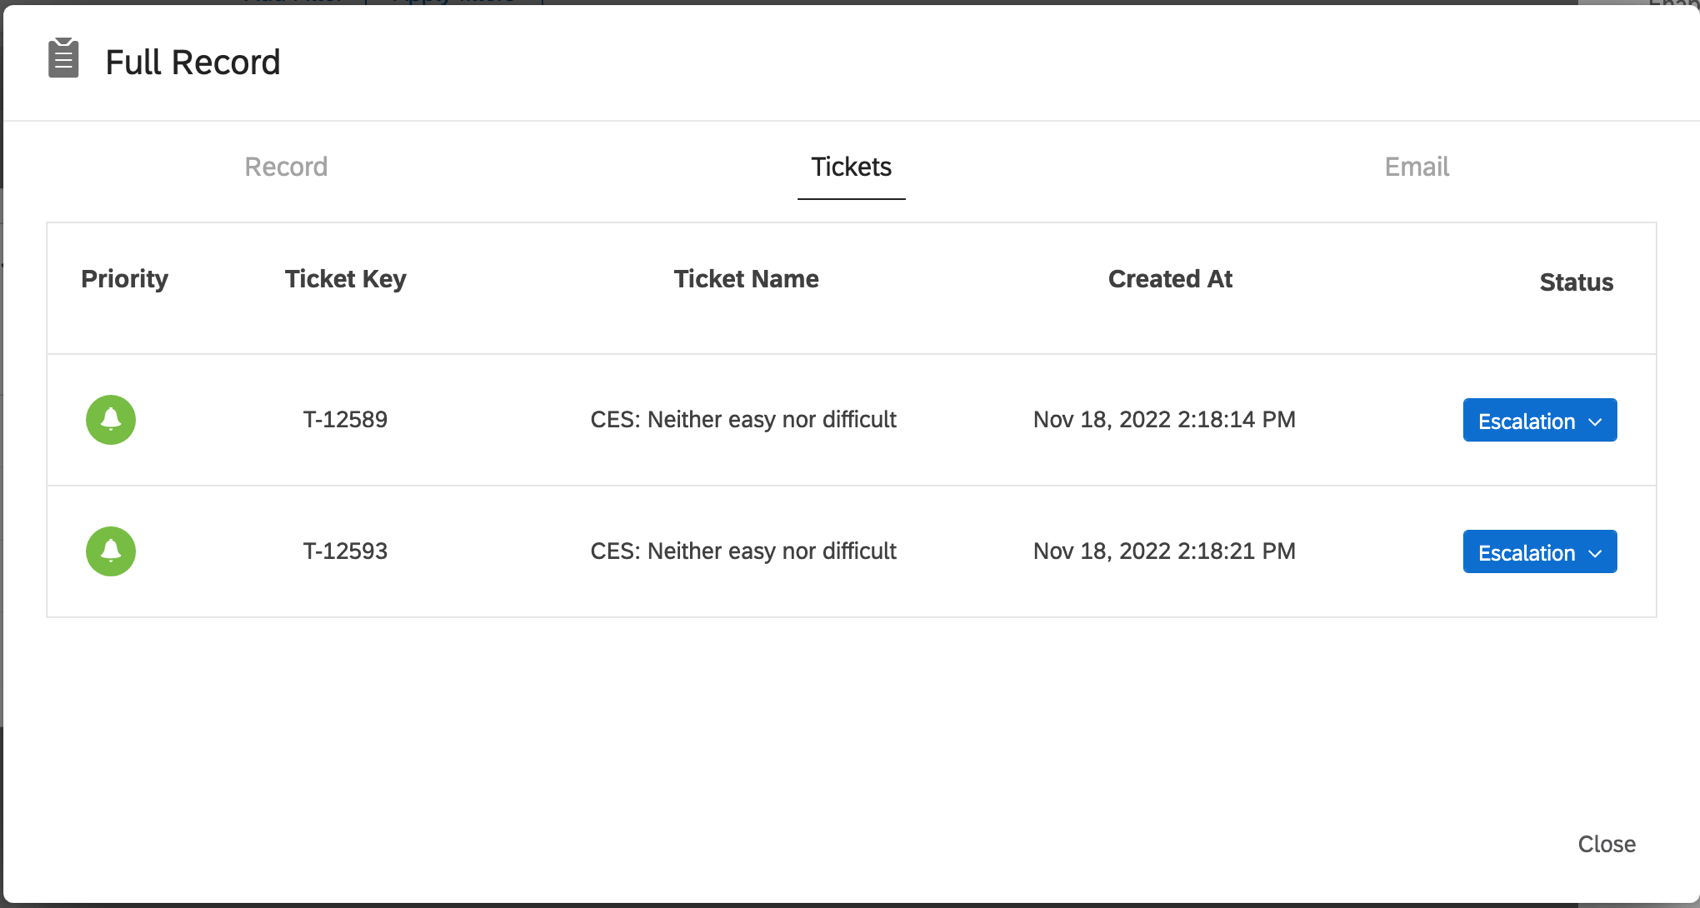
TICKETS TAB
In the Tickets tab, dashboard users can perform all the same functions they do on the tickets page. The only difference is that this tab is filtered to only show tickets assigned to the user that were generated by this survey response.

Functions Include:
- Expanding and Collapsing Tickets
- Changing the Ticket Status
- Assigning Tickets to Users or Teams
- Assigning Priority
- Root Cause
- Ticket Summaries
- Ticket Data
- Activity
- Deleting Tickets (Brand Admins only)
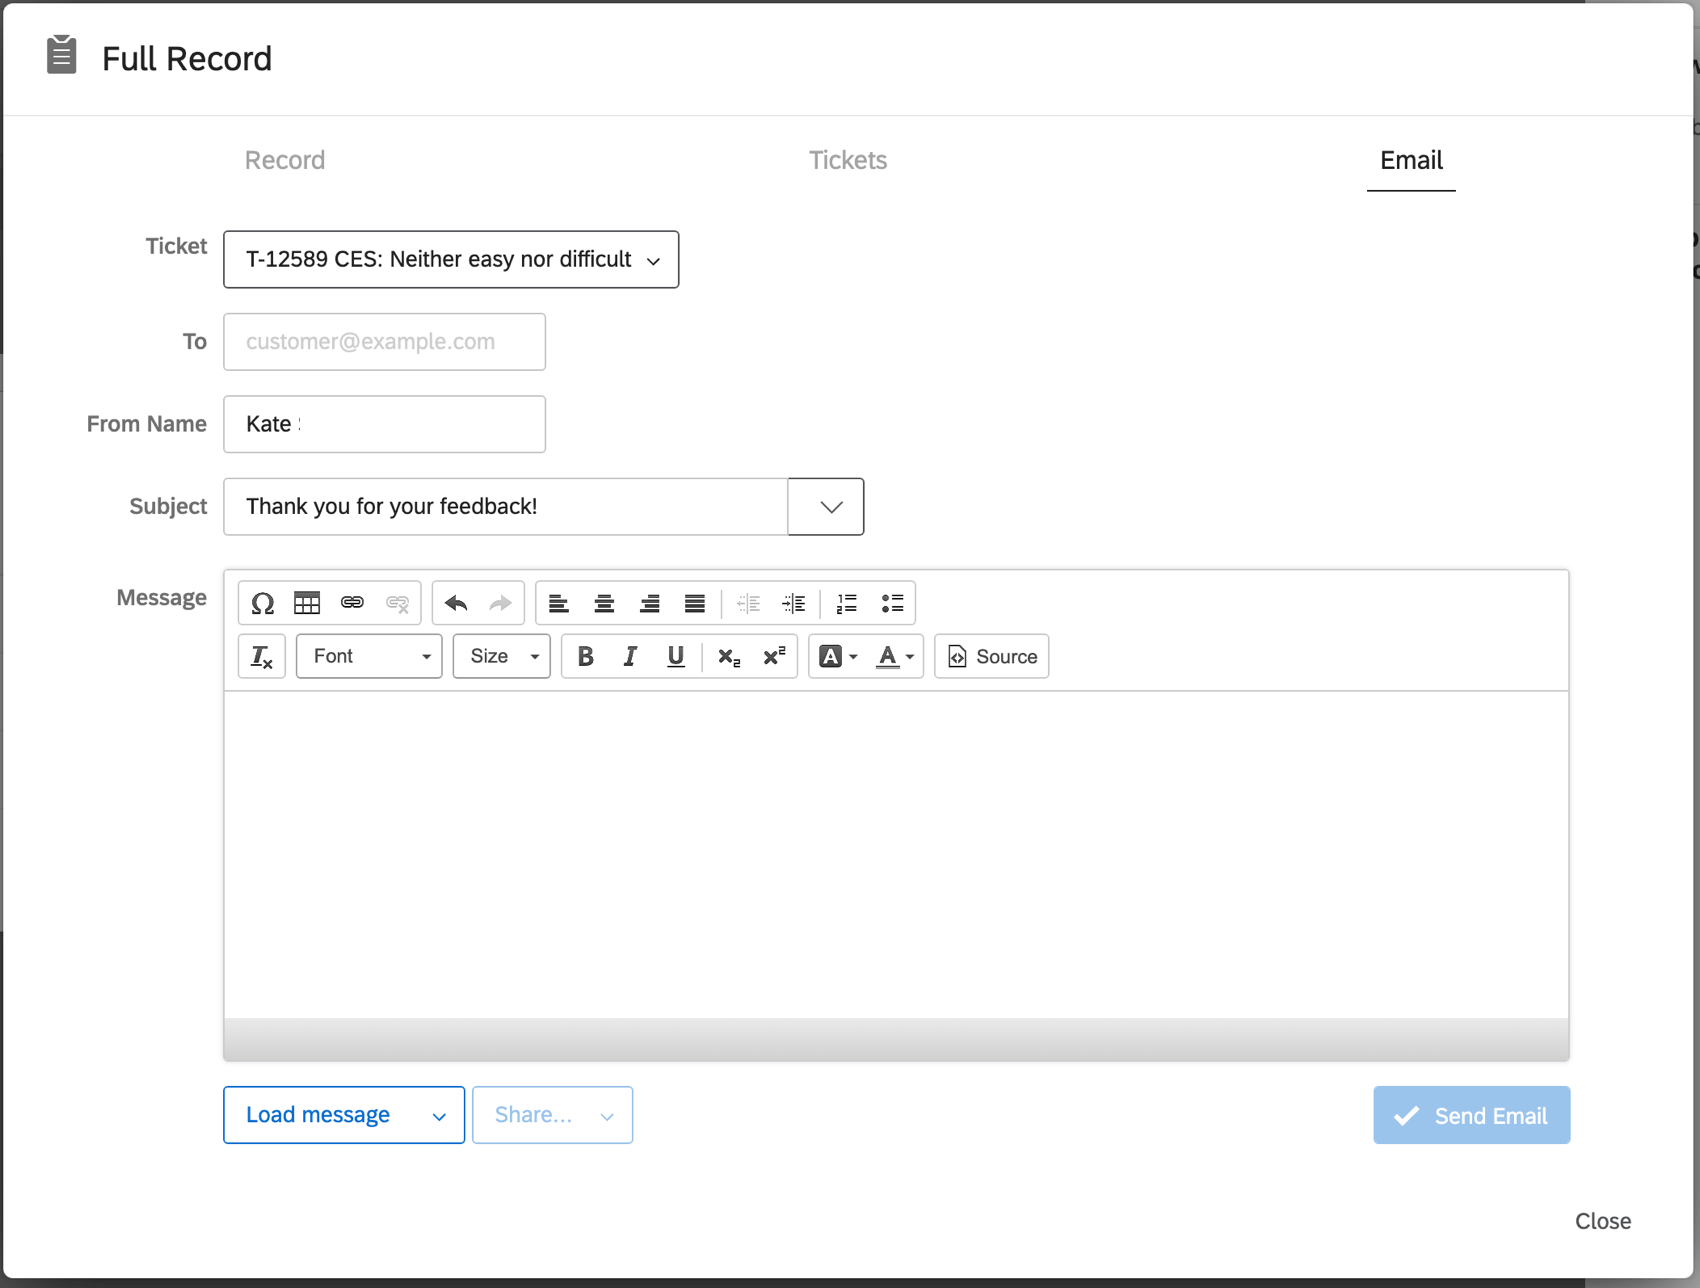
EMAIL TAB
In the emails tab, you can perform the same email functions you normally would on the ticket.
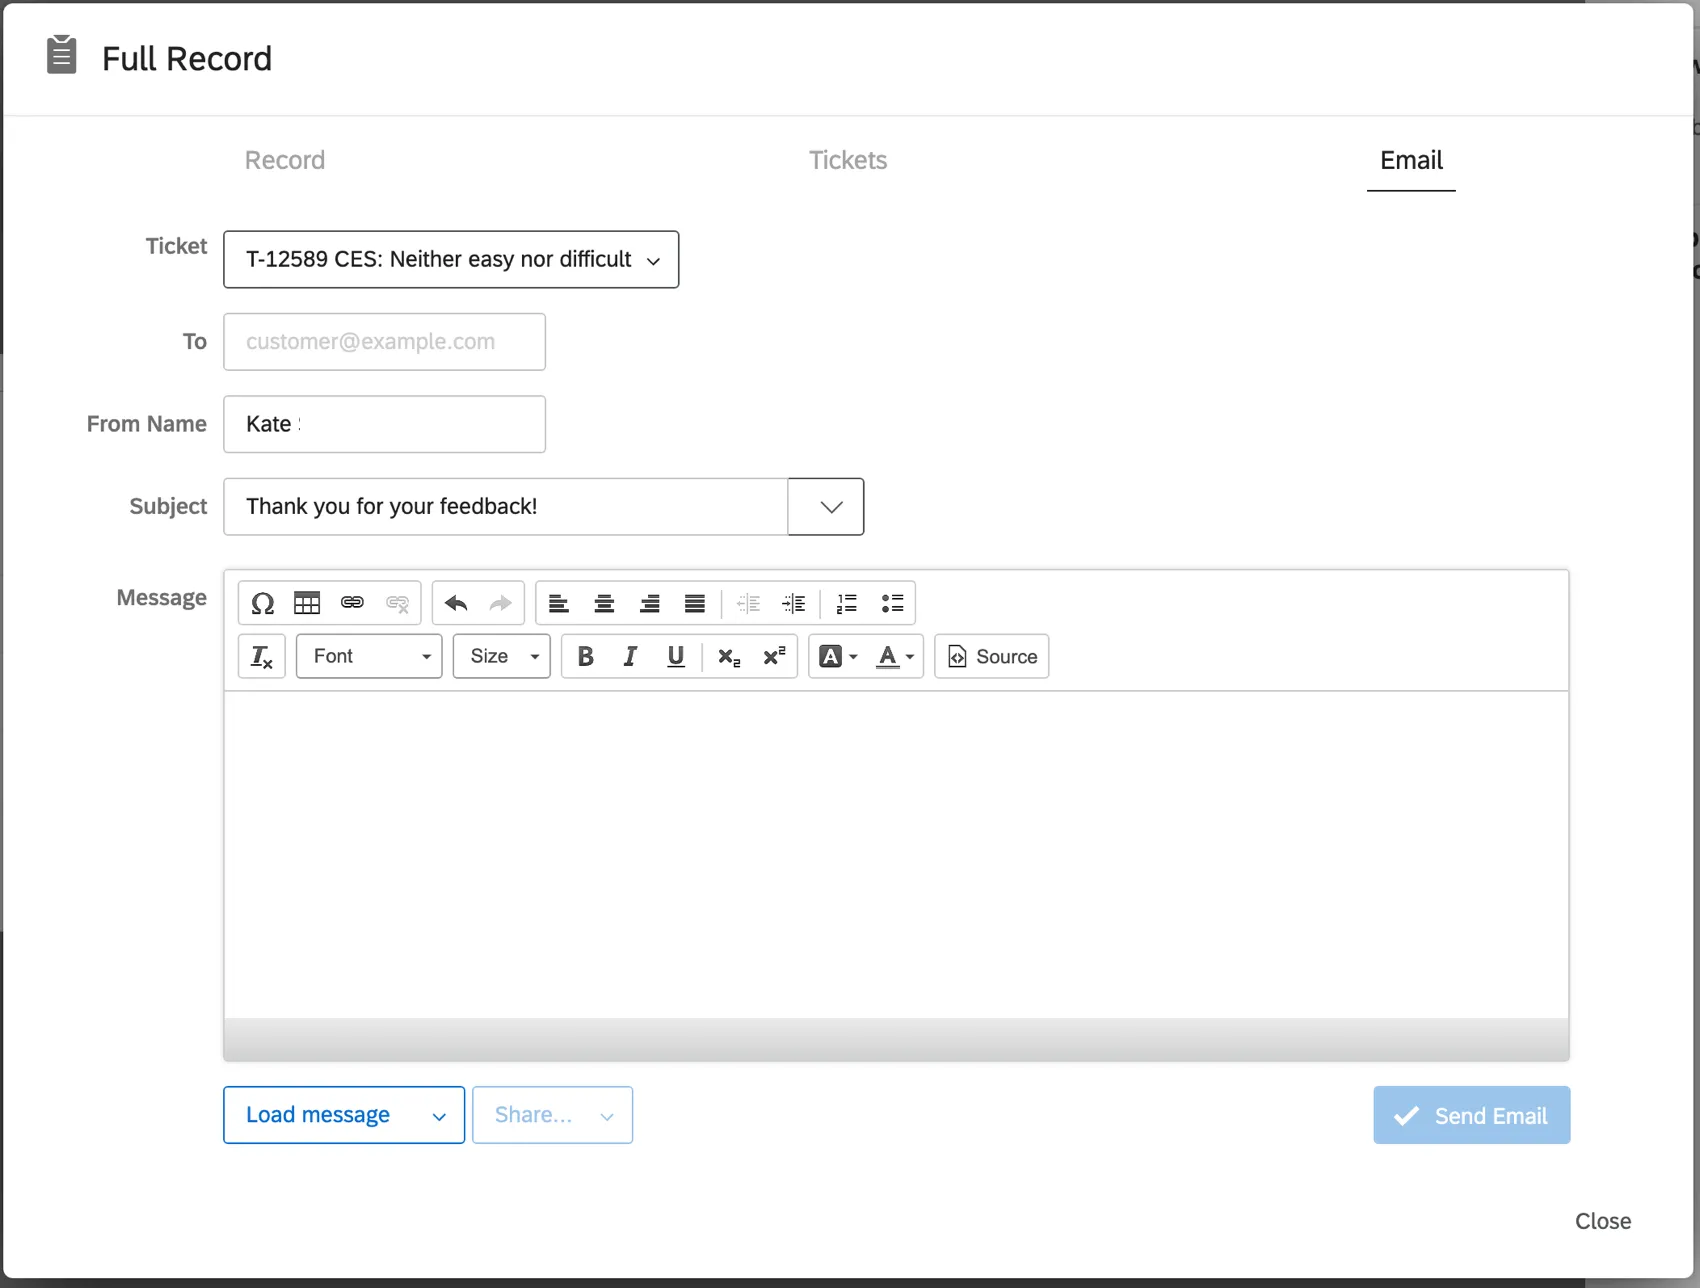
See Follow Up Emails on the ticket support page for more information.
Qtip: If your brand has a custom from address, then this email will be sent from that address. If your brand does not have a custom from address, then this email will be sent from noreply@qemailserver.com.
Exporting Data from a Record Table
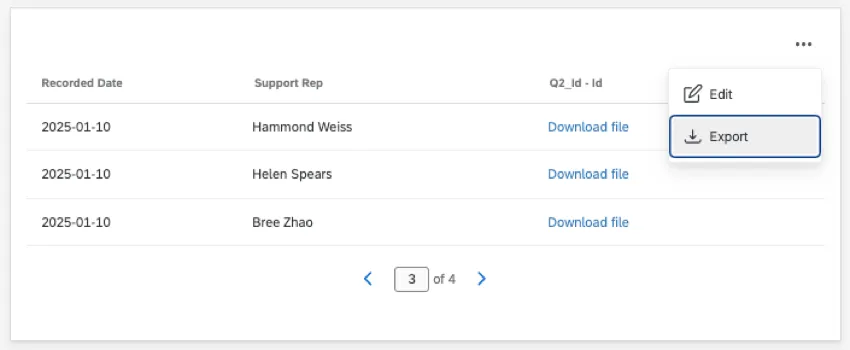
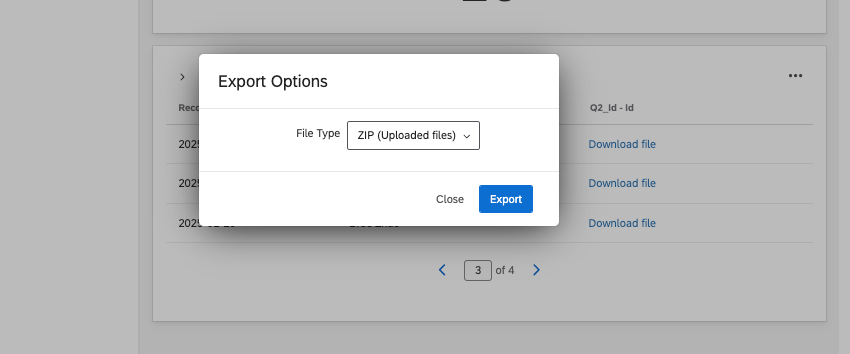
Data can be exported from record tables in a number of formats, including JPG, PDF, CSV, XLSX, TSV. Record tables also have a unique zipped file option that gives you access to files respondents have uploaded.
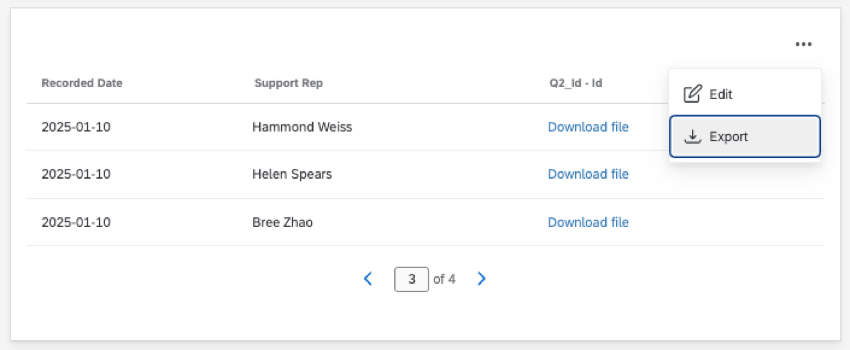
To export your widget, click the 3 dots, then select Export. You’ll then be prompted to choose a file type.
Exporting an image of a widget
When you export a record table to JPG or PDF, you’ll get a snapshot of the widget as it appears in the dashboard, with up to 5 records (rows). If your widget has multiple pages, it will pull records starting with the page of the widget you’re currently viewing.
Qtip: Select Include all widget content to export all data within the widget when exporting to PDF.
Attention: When exporting the record table to PDF, there’s a limit of 500 rows.
Exporting records in Excel-compatible formats
When you export to CSV, TSV, or XLSX, your raw data will be exported in a spreadsheet style, so each widget column is a sheet column, and each record is a row. You can choose whether to include all of your records when you export raw data, or a limited number.
See more on CSV, TSV, and XLSX export options.
Exporting files uploaded to responses
Qtip: You can only export a zip of uploaded files in Results Dashboards and CX Dashboards. You cannot export a zip of uploaded files in EX Dashboards because the question types aren’t compatible.
If you have a survey with a file upload question, screen capture, or signature, you can export all of the files your respondents uploaded in a zip file. This way you can save all uploaded files at once.

Displaying File Links in the Widget
Qtip: Keep in mind you can also quickly export a zipped folder of all uploaded files from the dashboard.
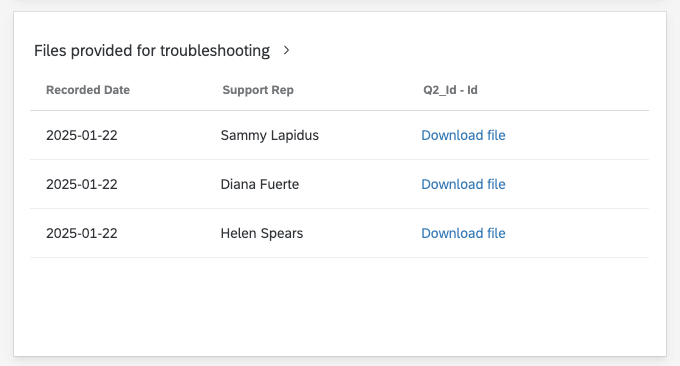
When you report on your survey data in your dashboard, there’s a chance you’ve asked respondents to upload a file. Files are generated for file upload, screen capture, and signature questions. If you’d like dashboard users to be able to download these files or even see previews of uploaded images, follow the steps below.
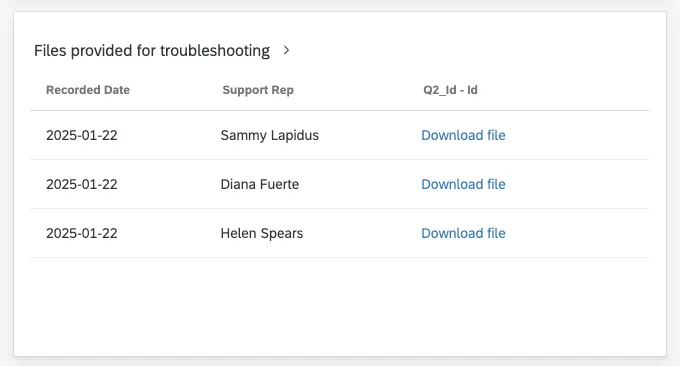
Qtip: These steps are useful if you want to share a list of file links with dashboard stakeholders. If you only need access to files for yourself, check out the pre-built widget in your survey’s results instead.
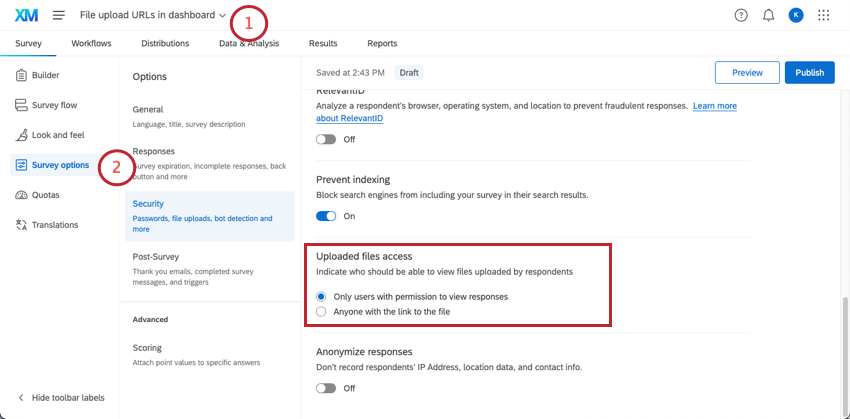
- For fewer restrictions and a quicker setup, set this to Anyone with the link to the file. However, as this settings says, anyone with the link to the file will be able to access the file.
- For more sensitive information that’s being shared with a smaller group, you can select Only users with permission to view responses, then invite collaborators to your survey with minimal “View Survey Results” permissions. This permission gives users access to the survey data, but won’t allow them to make edits. Qtip: So long as a dashboard user has “View Results” permissions for the survey itself, they’ll be able to download the uploaded files displayed in the widget, even if their dashboard permission is “View Only.“
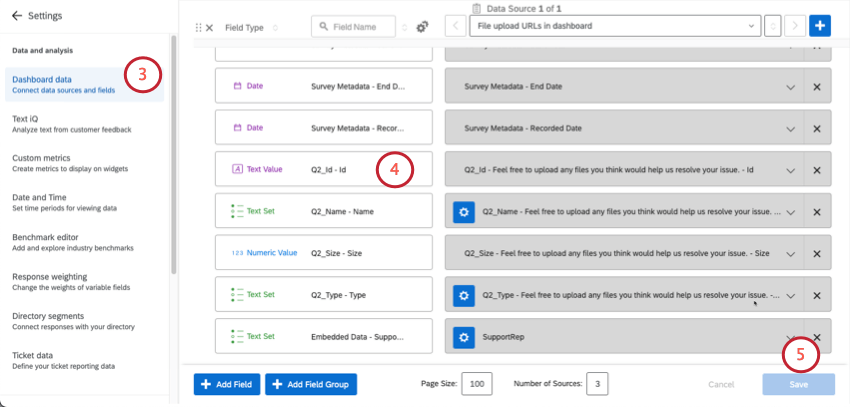
- File upload question’s “Id” – Text value.
- Any other file upload information you want to include in the widget, such as name.
Qtip: Uploaded files will only generate an image preview if they are image files, such as PNG, JPEG, or GIF.
Qtip: File upload, screen capture, and signature questions are only available in survey projects, and are not available in EX or 360 projects. Therefore, you can only create a widget with file links in CX Dashboards and Results Dashboards.
FAQs
I have multiple datasets on my dashboard. Can I use this feature with all of my widgets?
I have multiple datasets on my dashboard. Can I use this feature with all of my widgets?
- Changing which dataset your widget shows: Not all widgets can have their referenced dataset switched. Some can only use the default dataset. For a compatible list, see this section.
- Showing multiple datasets in the same widget: Not all widgets can show multiple datasets’ results at the same time. For a compatible list, see this section.
That's great! Thank you for your feedback!
Thank you for your feedback!