
Ad Hoc Reports Overview (Designer)
What's on this page
Attention: Reports in designer are for exploratory purposes only, and all insights packages have been deprecated. Please use Studio for the most accurate reporting.
About Ad Hoc Reports
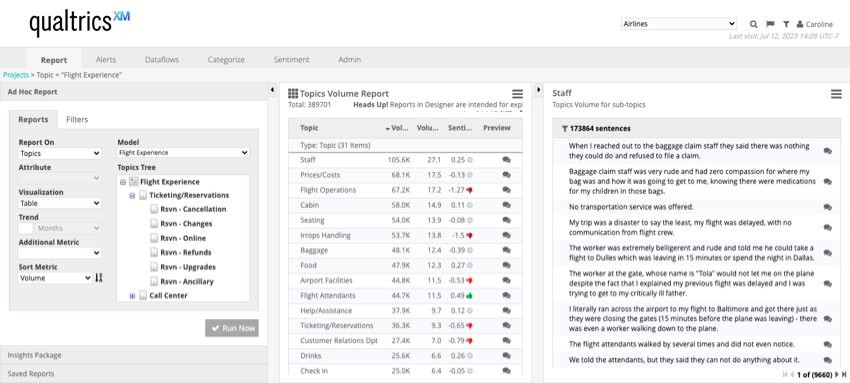
Ad Hoc reports can be accessed within the Report tab. From this tab you can run new reports, view report outputs, preview the verbatims behind each response included in a report, export, and save reports.
Qtip: By default, a report will be run with default settings when you open this tab. You can adjust this within Project Settings.
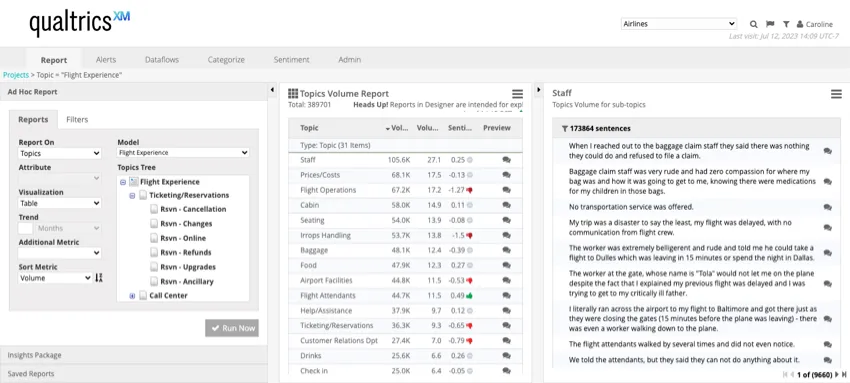
The panel on the left has 3 sections:
- Ad Hoc Report: This section contains report settings and filters, and is where you create a report.
- Insights Package: All Insights Packages have been deprecated. Please use Studio for the most precise reporting.
- Saved Reports: This section contains saved reports.
The central panel displays the report output. You can also view related reports, save reports, and export reports from this panel.
The panel on the right displays the verbatims behind each response in the report.
Qtip: You can use the arrows in the corner of each section to expand and collapse them. You can also drag each section to resize it.
Creating and Viewing a Report
When you create Ad Hoc reports, you are able to select the report and visualization type, as well as additional customization options. Once a report has been run, you can view the results in the center panel. You can also view sub-reports or preview sentences from customer verbatims. For more information, see Creating & Viewing Ad Hoc Reports.
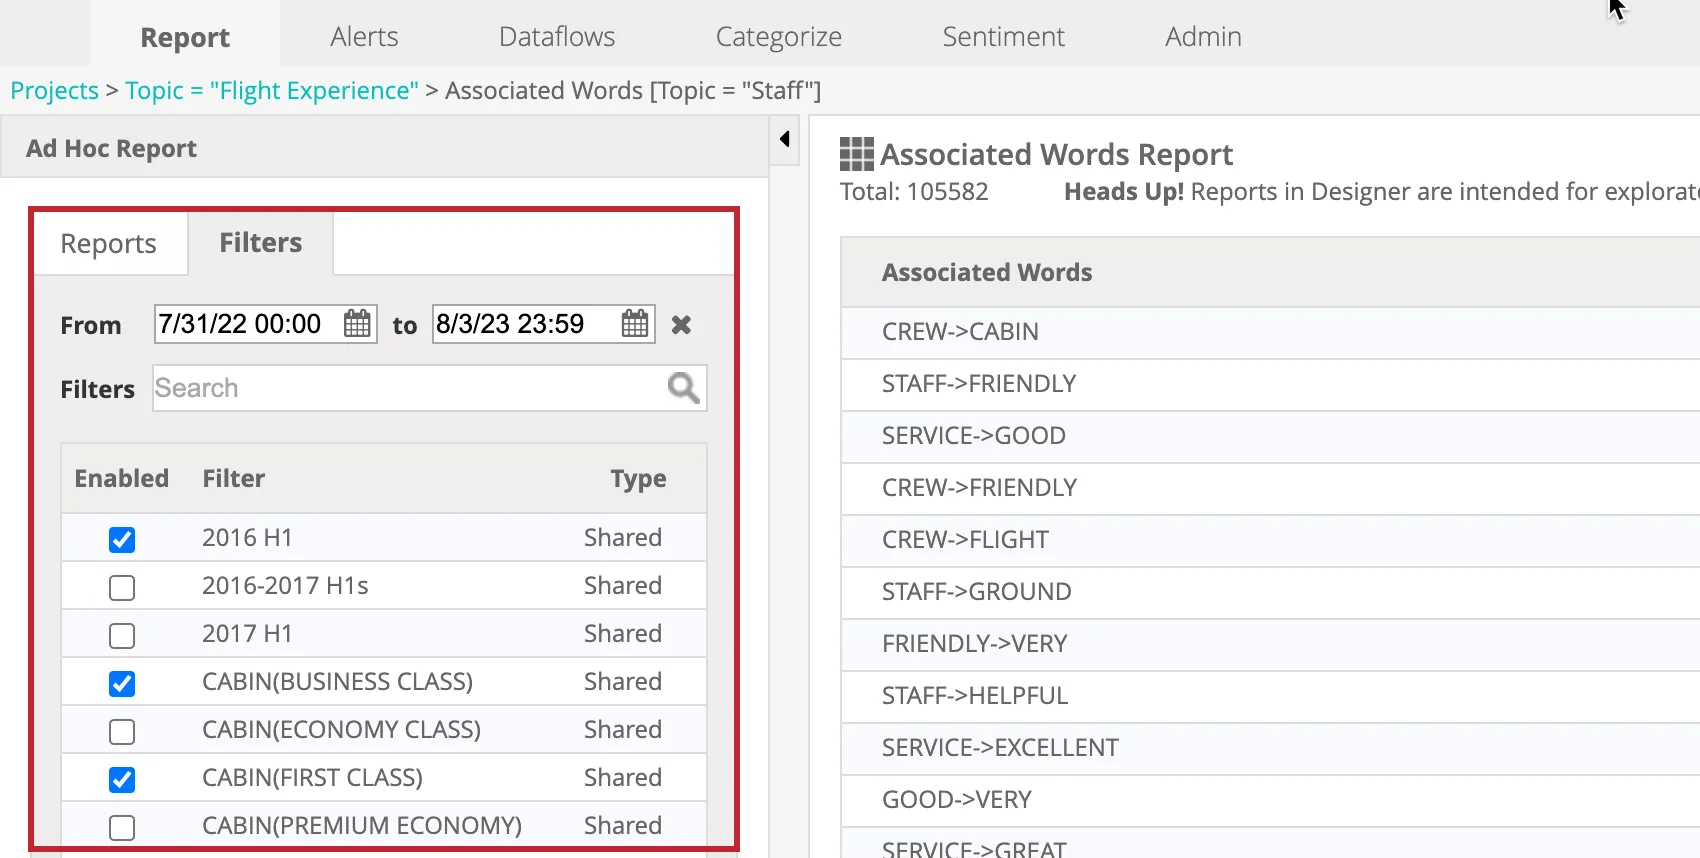
Filtering a Report
Click on the Filters tab within the Ad Hoc Reports section to apply filters to a report. There are 2 types of filters you can apply:
- Dates: Select a date range for the report.
- Filter: Select 1 or more filters to be applied to the report. See Filtering Data for more information.
When more than 1 filter is applied to a report, it will display data that satisfies ALL selected filters.
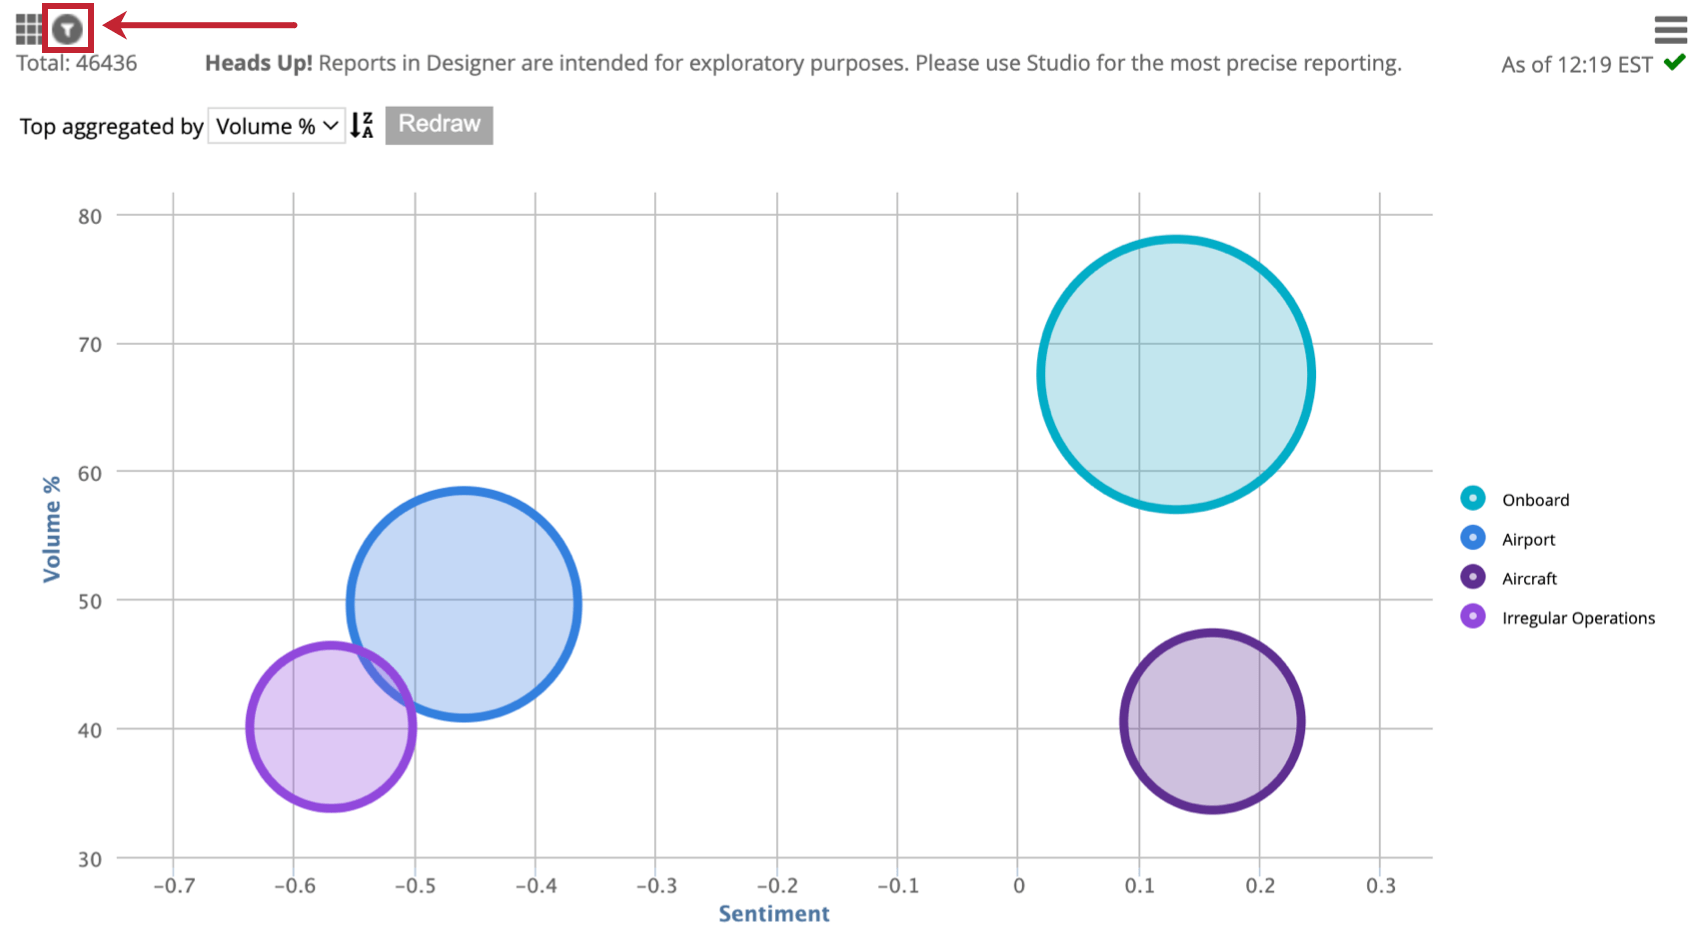
When a filter is applied, a filter icon will appear in the top-left corner of the report.

Report Types
When you create an Ad Hoc report, there are 5 report types to choose from. Each report type has different customization and visualization options. For more information, see Report Types.
Report Visualizations
Report visualizations determine how your data will be displayed in your report. Some visualizations have additional customization options. For more information, see Report Visualizations.
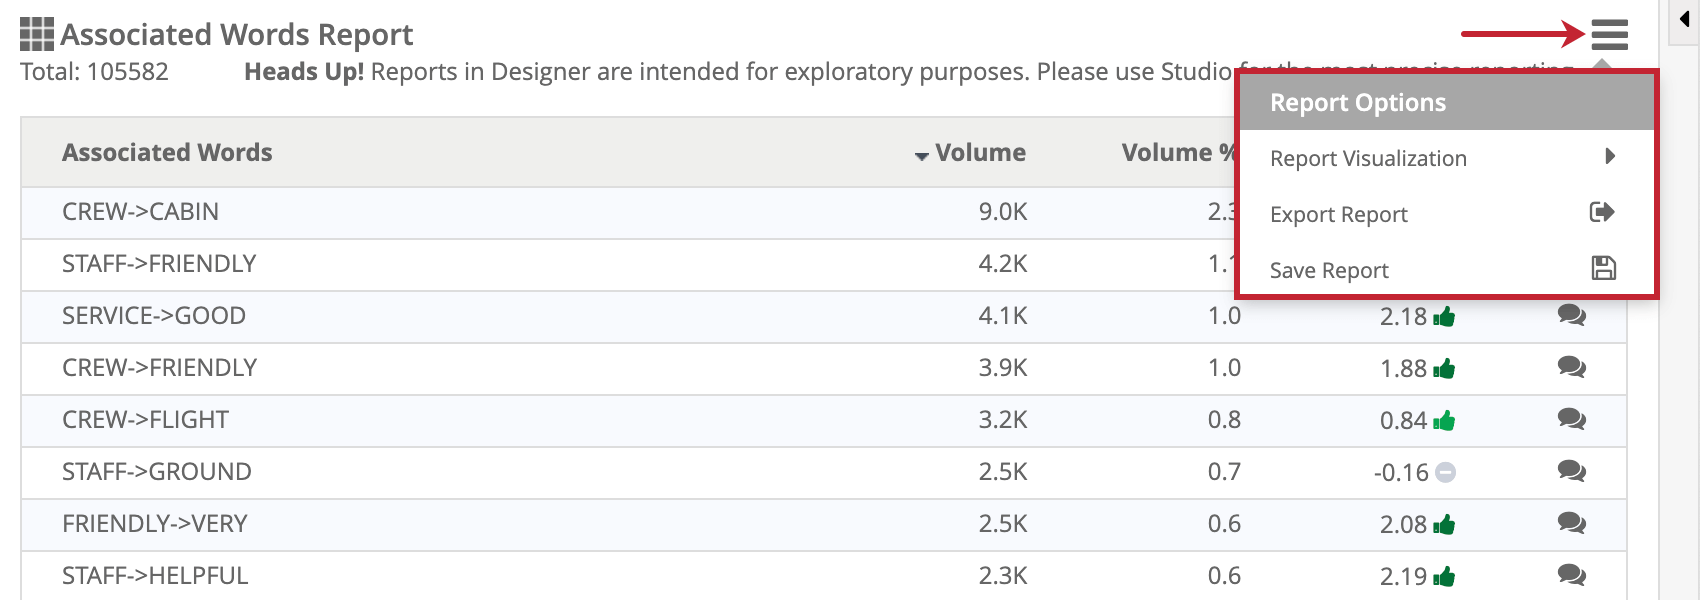
Report Options
To view additional options for your report, click the hamburger menu in the top-right of your report.
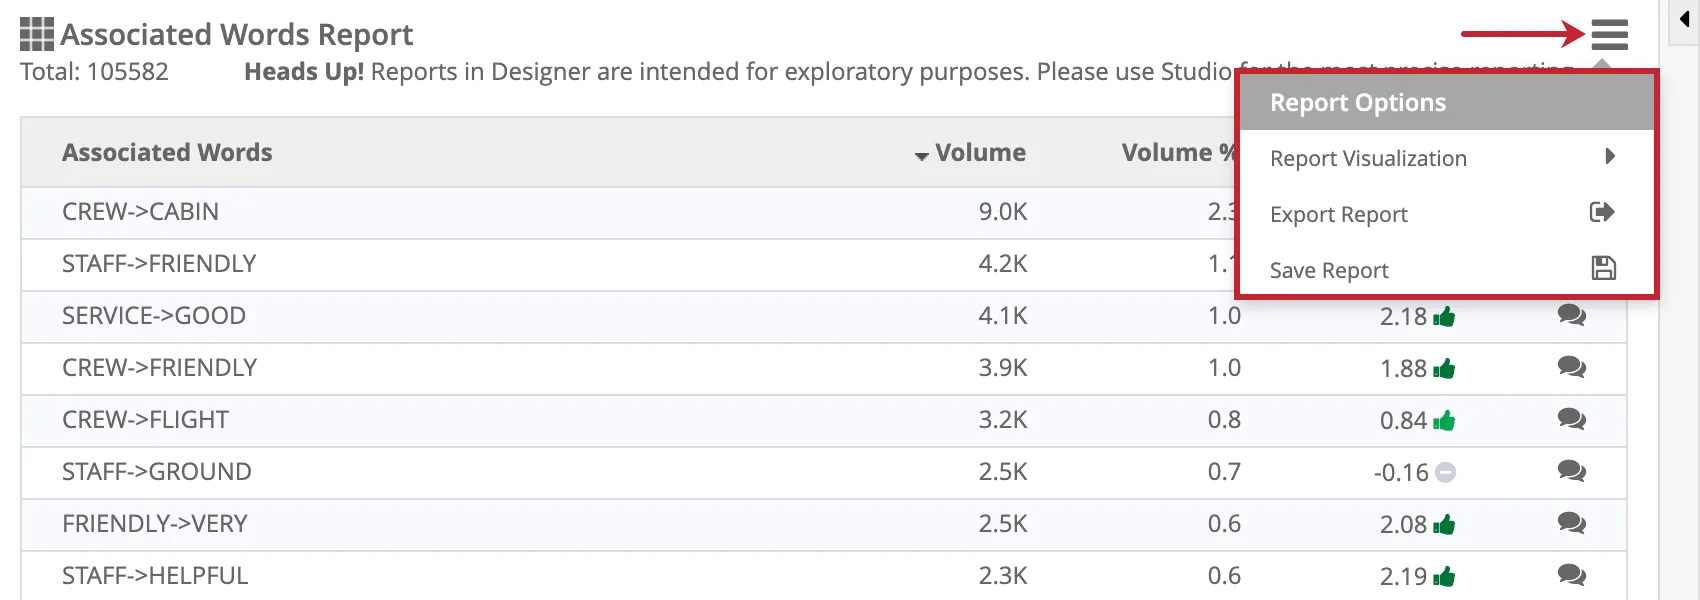
Report Visualization
This option lets you change the visualization type for your report.
Export Report
This option lets you export your report as a CSV or XLS. CSV exports contain report data as plain text. XLS exports contain report data as an Excel sheet, which includes a chart image if applicable.
Attention: To comply with Twitter’s content redistribution policy, XM Discover does not export Twitter records.
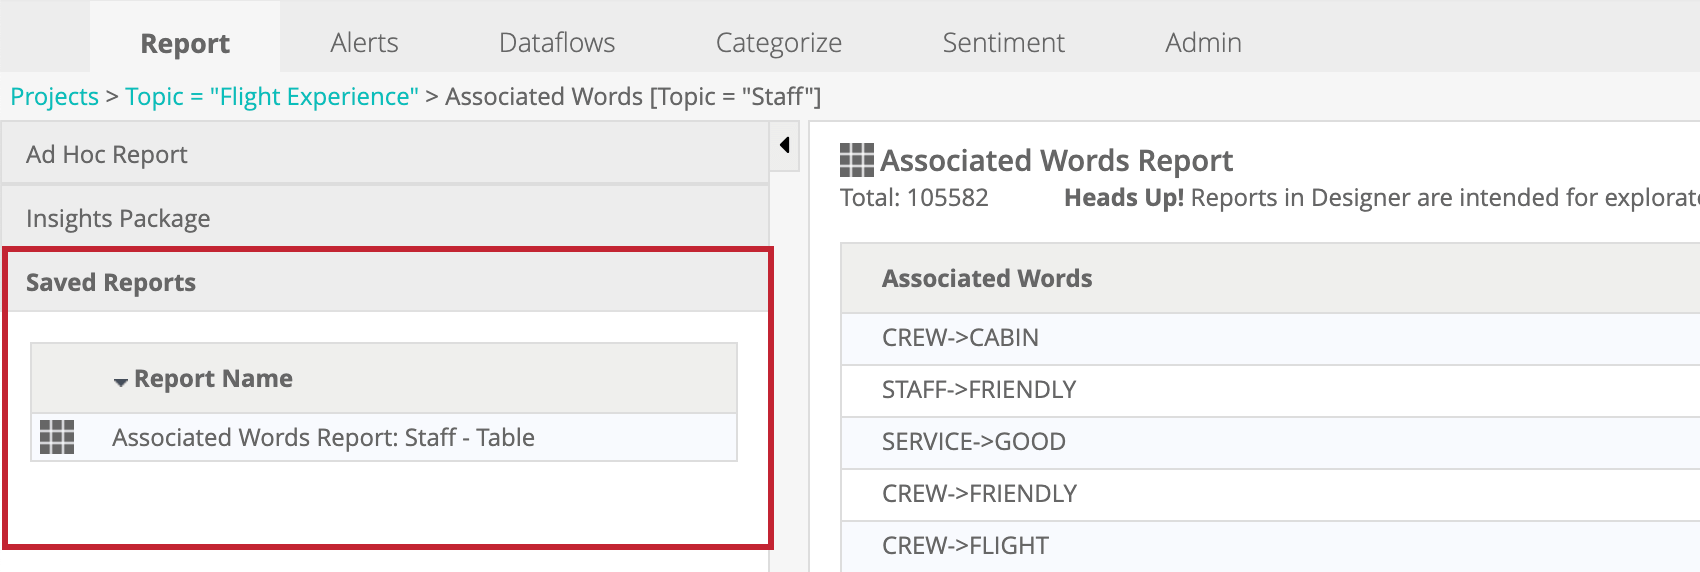
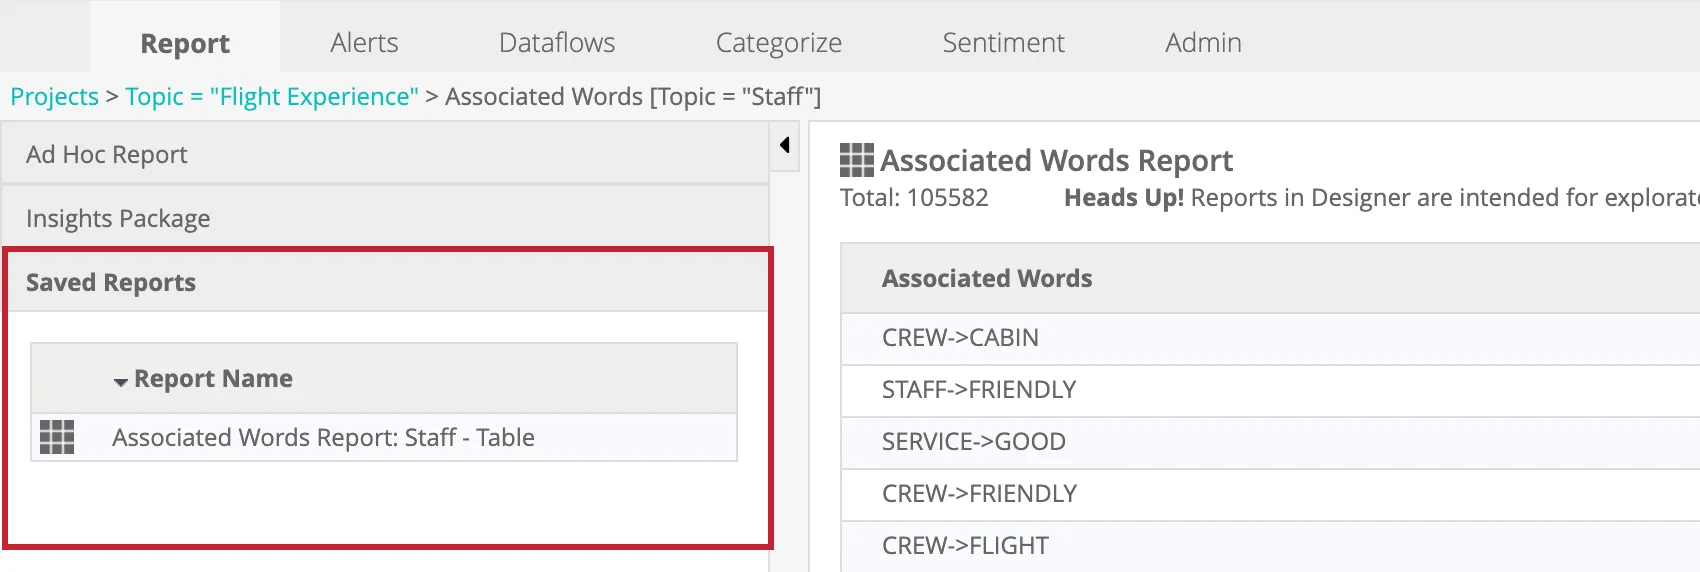
Save Report
This option lets you save a report configuration, which can save time on reports you run frequently. Saved reports can be accessed within the Saved Reports section of the Reports tab. Double-click on the title of a saved report to run it.
Attention: Saved reports are user-specific, so other users cannot see your saved reports.
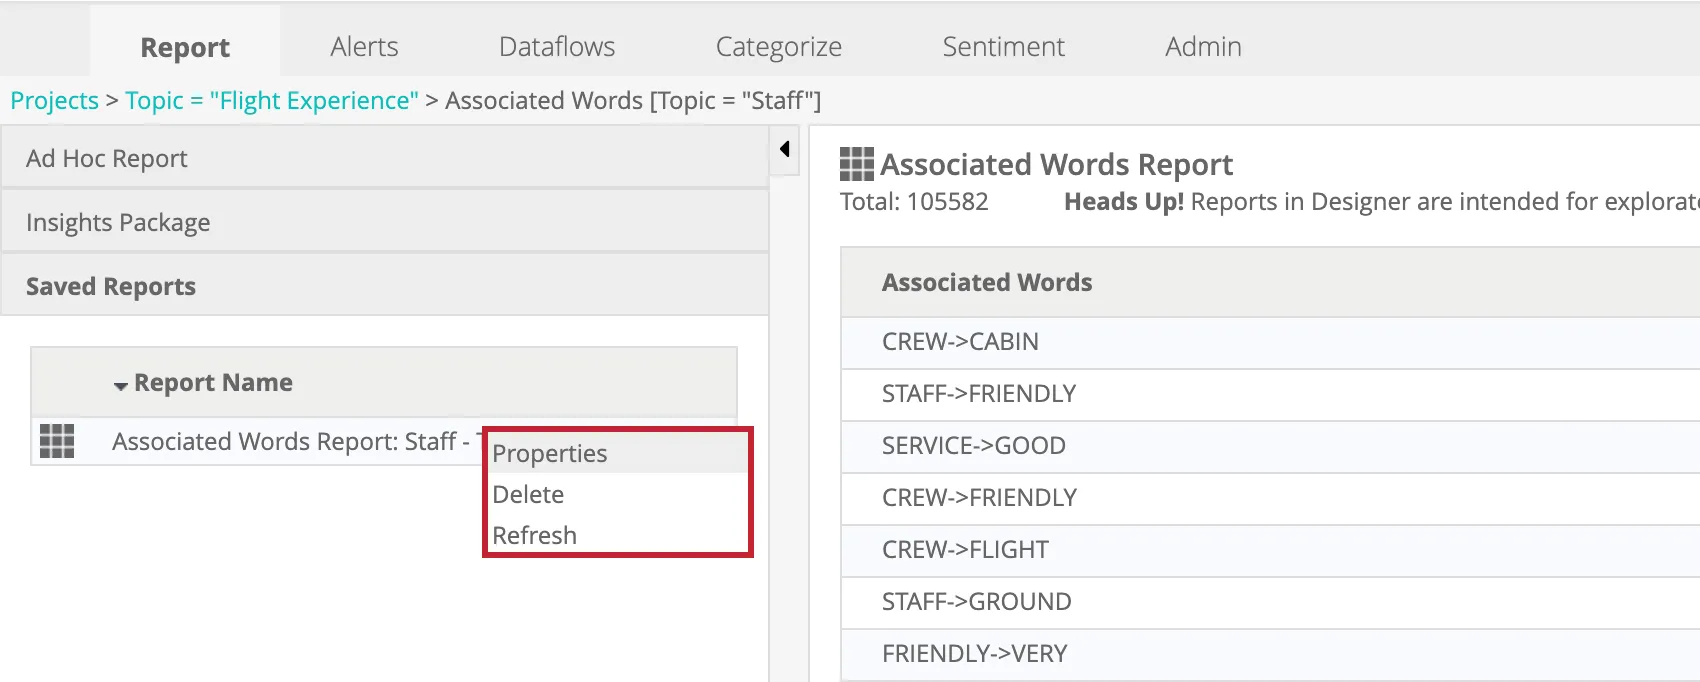
Right-clicking a report title will display additional options:
- Properties: View report properties and rename the report.
- Delete: Delete the report.
- Refresh: Refresh the report. See Report Caching for more information.
Report Caching
Report caching stores results of frequently run reports so they can be loaded faster. When any user in your project runs a report, its results are cached. For more information, see Report Caching.
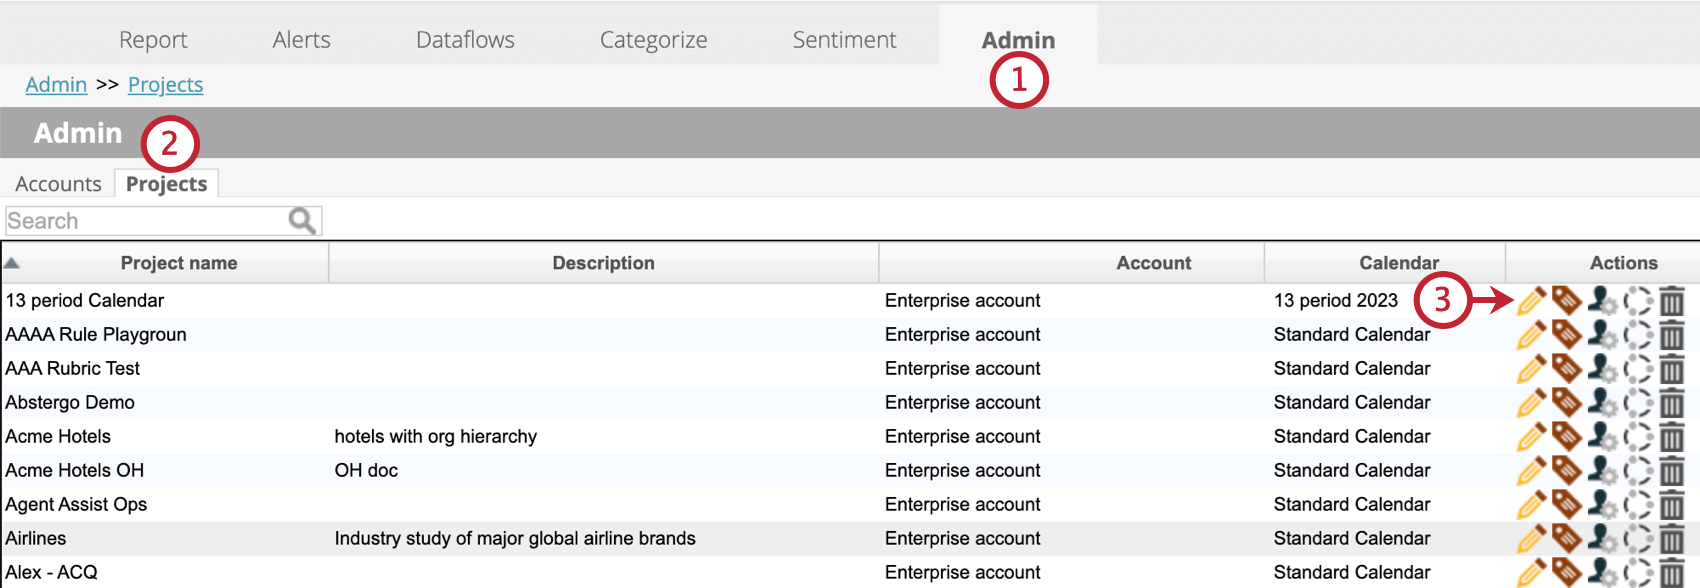
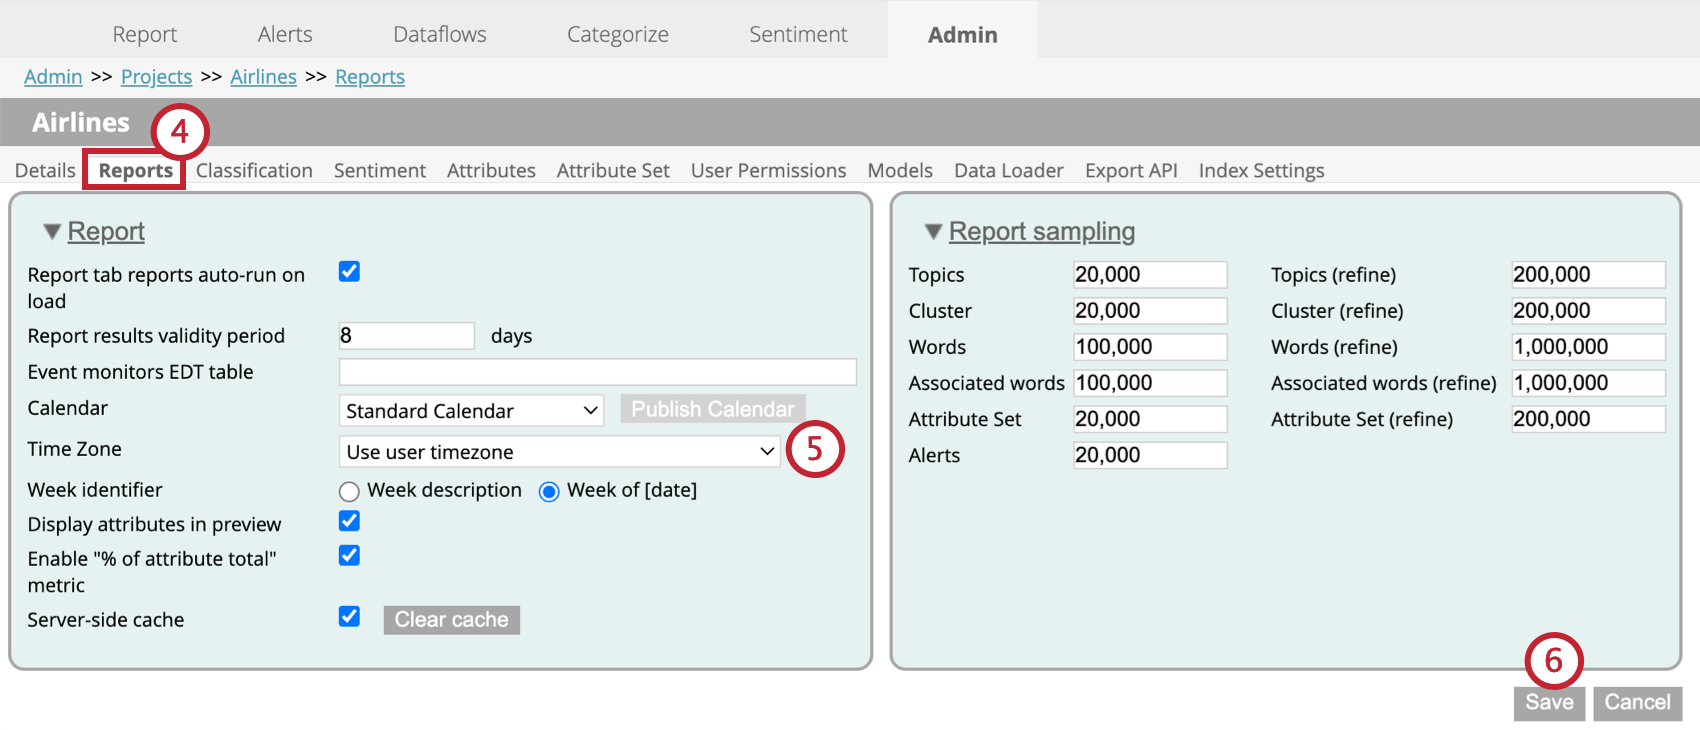
Time Zone Settings
Reports can be adjusted to a specific time zone in the Admin tab. Follow these steps to define a time zone for a project:
That's great! Thank you for your feedback!
Thank you for your feedback!