
Combining Ticket & Survey Data in Dashboards (CX)
What's on this page
About Combining Ticket and Survey Data in Dashboards (CX)
Many customer experience programs use both survey and ticket data to create a comprehensive “close the loop” program. Surveys provide a means to collect customer feedback, while ticket systems notify your representatives of the most critical feedback, allowing representatives to then reach out to customers and resolve issues as they arise. This process can build trust and close experience gaps, but to keep it running smoothly, it’s important to have the right reports and visualizations in place.
With the data mapper, ticket and dashboard data had to be separated onto different pages. However, now, with the data modeler, this data can be combined into one page, allowing for more dynamic dashboard visualizations.
Qtip: This page focuses on how to make sure you can join survey and ticket data together in a dashboard. For more comprehensive guidance on how to build a tickets program, see Closing the Loop.
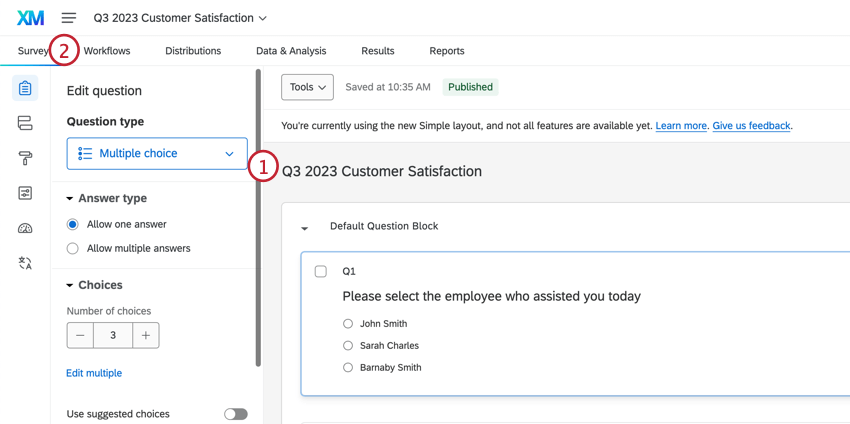
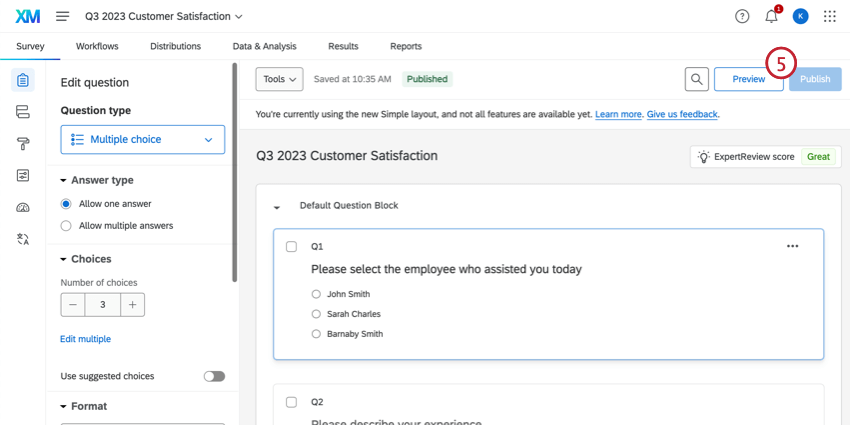
Setting Up Tickets in Surveys
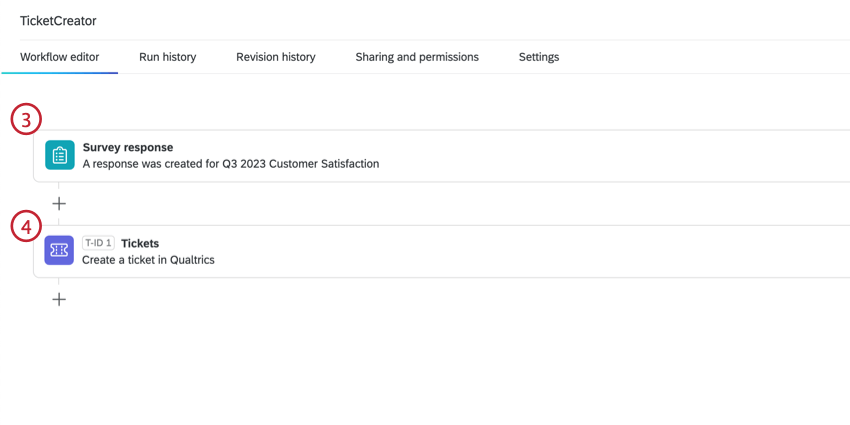
In order for tickets and survey results to appear in the same dashboard, your tickets should be connected to a survey. You cannot use tickets created in scheduled workflows or workflows started by non-survey events.
Qtip: For guidance on the best information to include in your survey, see our Closing the Loop support page.
Qtip: Conditions can narrow down when a ticket is created. For example, you may only want to create a ticket if a negative response is reported.
As responses are collected in this survey, tickets will be created and stored in the follow up page.
Creating a Data Model
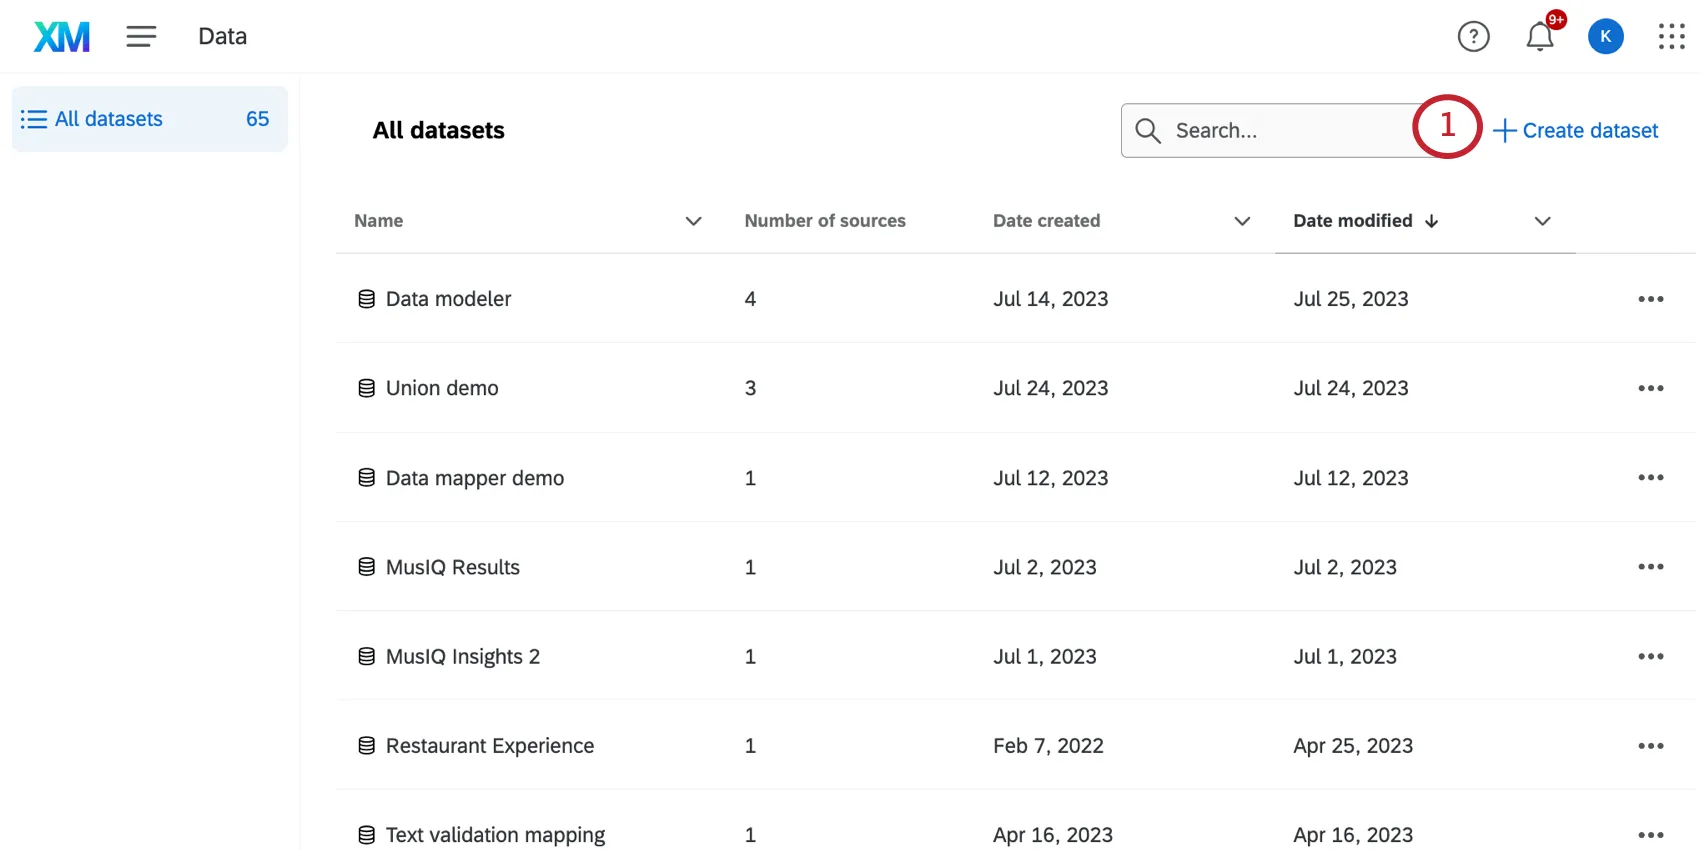
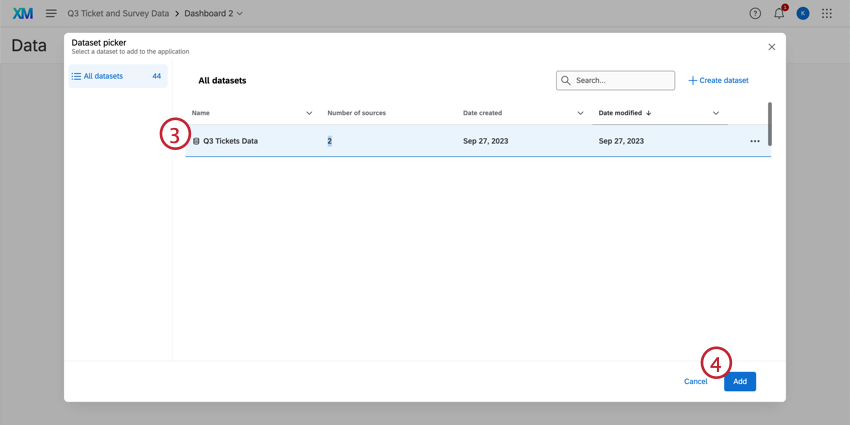
Create a dataset.
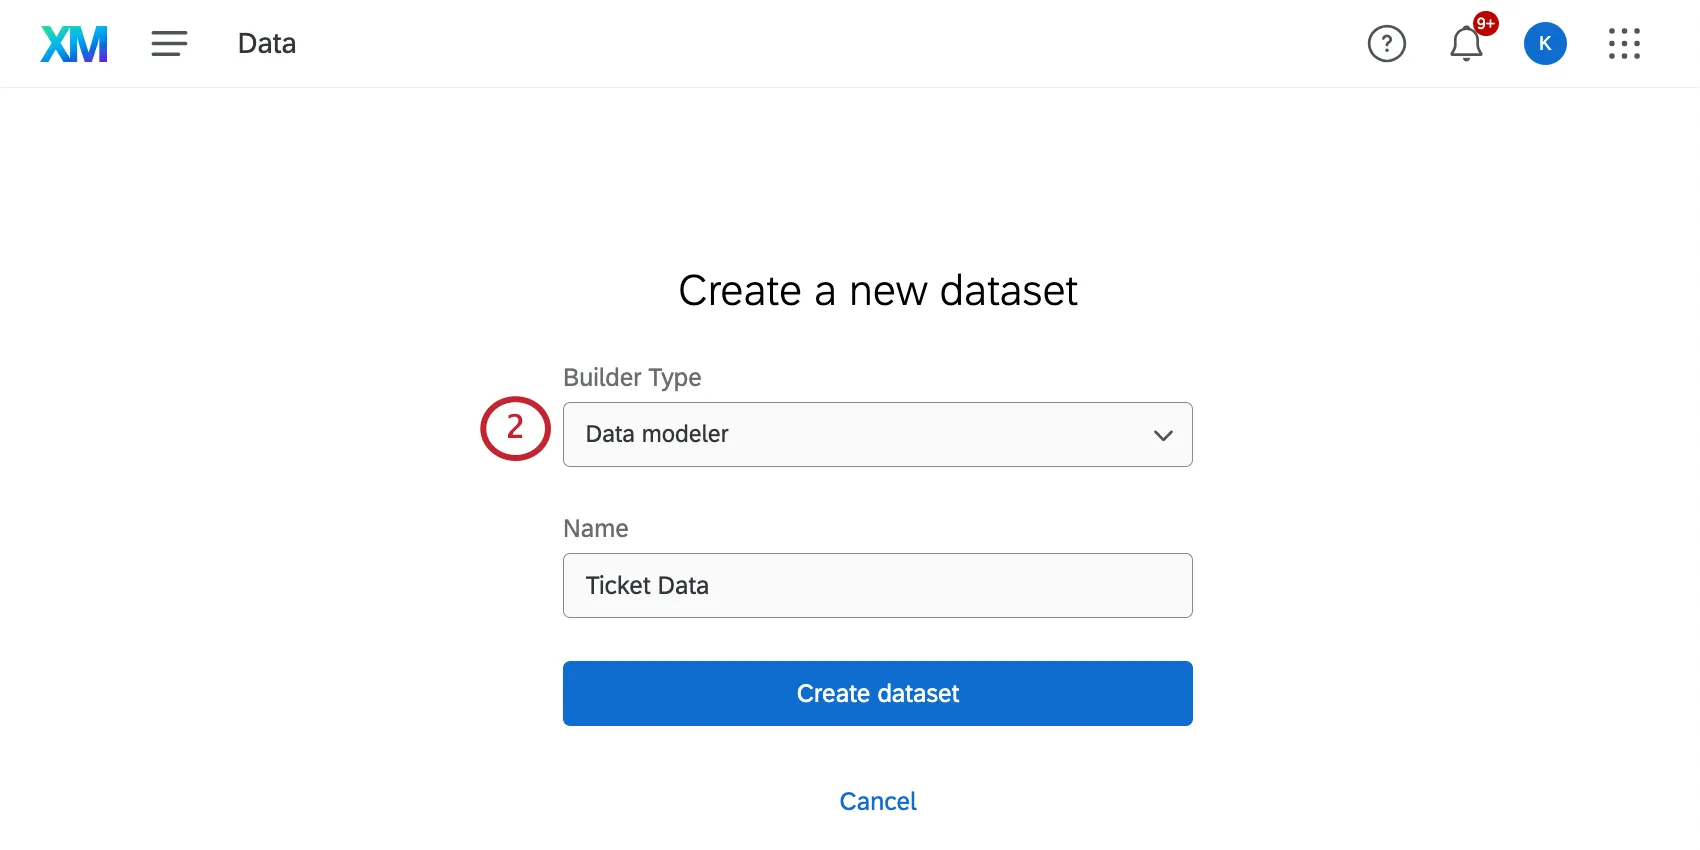
Set the Type to data modeler.
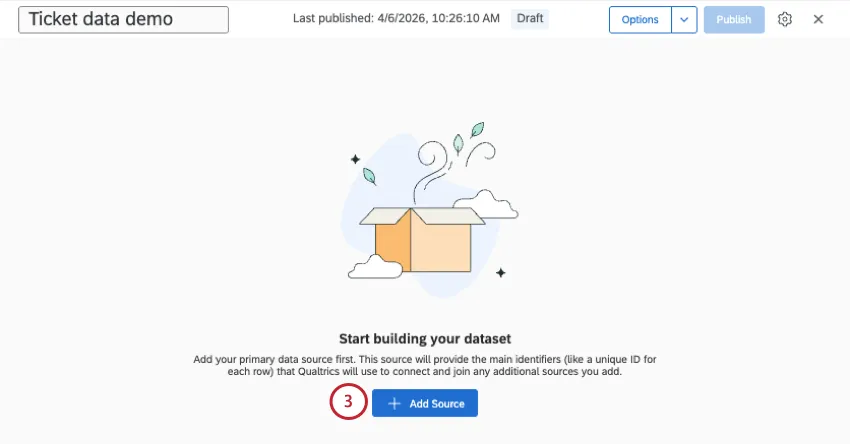
Click Add source.
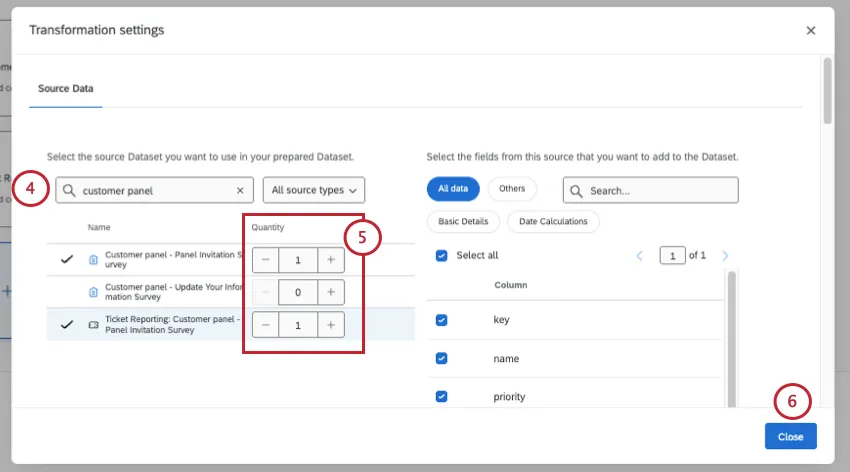
Find your ticket intake survey and your ticket data. You may need to search for the title of your intake survey.
Qtip: Ticket data sources are data from ticket workflows set up in surveys. These surveys must be ones you have access to before they appear. Ticket data is formatted Ticket Reporting: [Survey Name]. Make sure to select the dataset that matches the survey name of the survey data source you’re using. Data from tickets is not available for use in the data modeler until set up. See Migrating Ticket Reporting Data to the Data Modeler for more information.
Click the plus sign ( + ) next to your intake survey and ticket data.
Once you have both sources added, click Close.
Click the plus sign ( + ) next to your datasets.
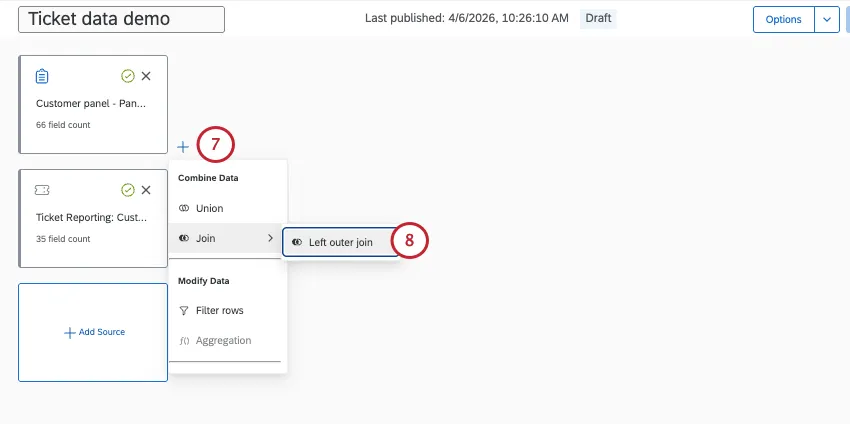
Hover over Join and select Left outer join.
In the Right of the Input row, select your tickets data.
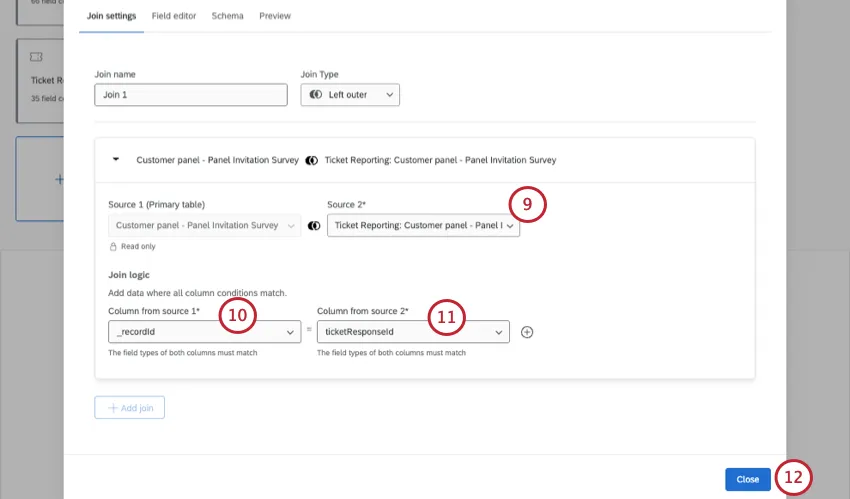
In the Left Column of the Join condition row, select your intake survey record id.
Qtip: Record ids are formatted [Survey Name]_recordId and [Ticket Reporting: Survey Name]_ticketResponseId
In the Right Column of the Join condition row, select your ticket response id.
Click Close.
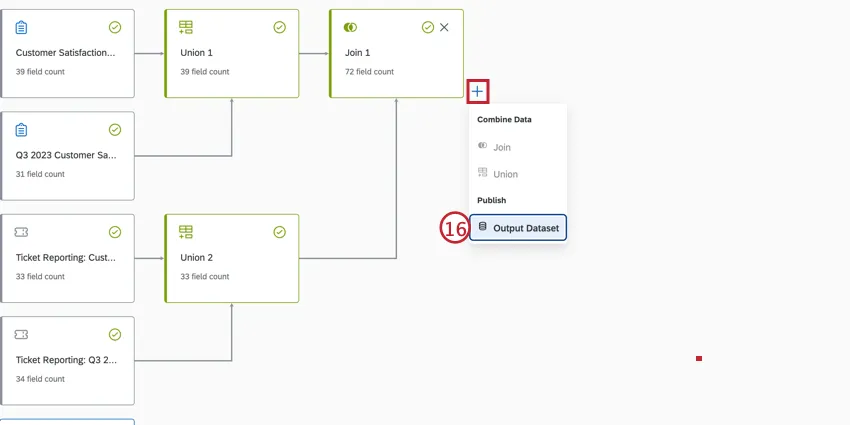
Click the plus sign ( + ) next to the Join.
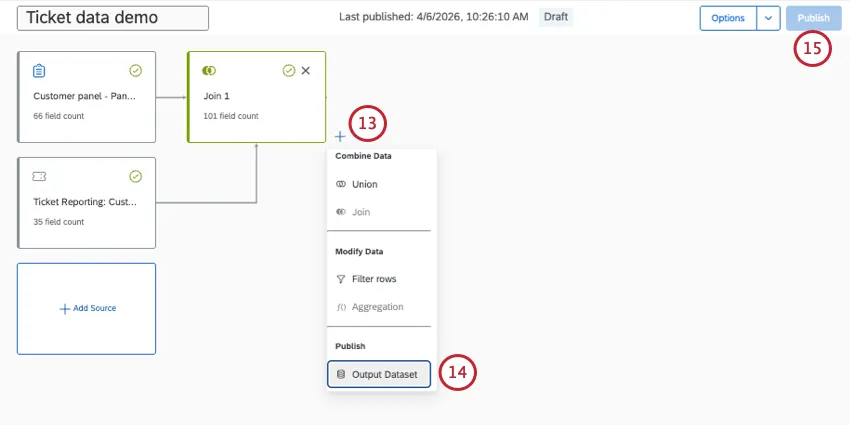
Add an Output Dataset.
Publish your data model.
Creating a Dashboard
After creating a data model, the survey and tickets data is ready to be mapped to a new dashboard.
Qtip: This section describes elements of creating a CX dashboard. For more information on dashboards, see Getting Started with CX Dashboards.
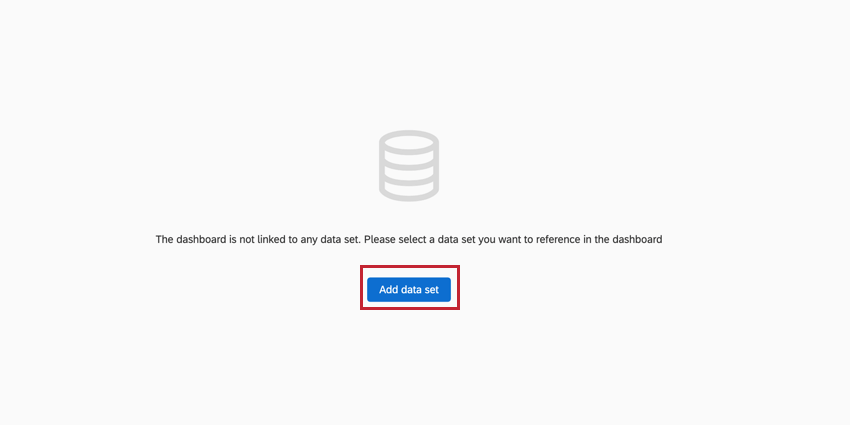
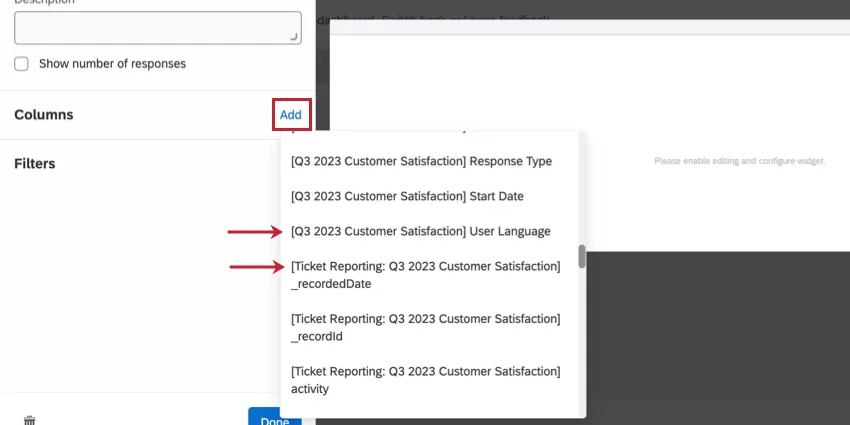
Once the dataset is added to the dashboard, you will see both tickets and survey data fields while building your widgets.
Example Widgets
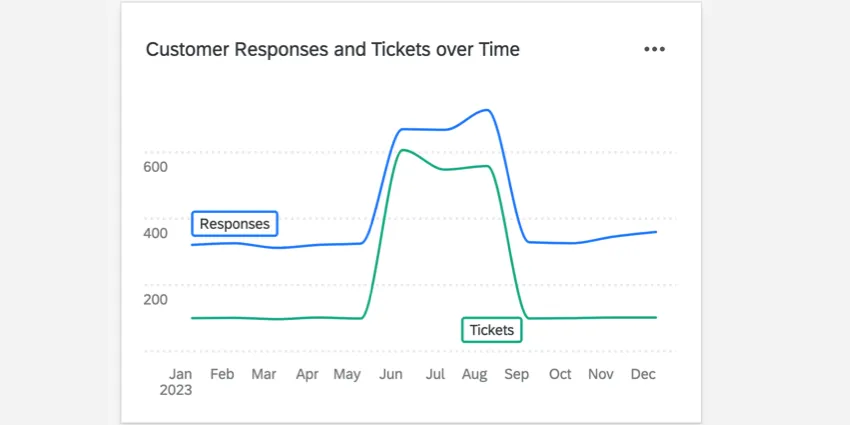
Below are a few example widgets to help understand how the feature can be used:
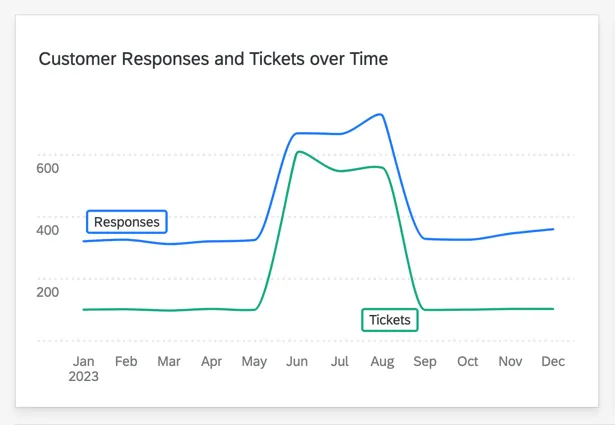
A line chart widget showing the number of survey responses and the number of tickets generated over time.
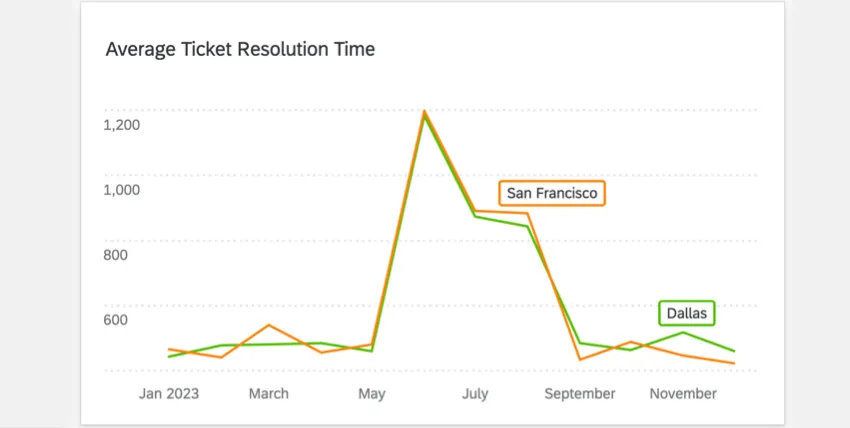
- A line chart widget showing the average ticket resolution time over time.
-
Editing a Dataset
When building your dashboard, it may be necessary to edit your dataset in order to use the kinds of widgets you want.
For more information, see Editing a Data Model (CX).
Migrating Ticket Reporting Data to the Data Modeler
Warning: When setting up a join, all records will be pulled from the left source (in this case, surveys). Only 1 record from the right source (ticket) per record on the left (survey response) will be joined. If you have multiple tickets per survey response, only a single ticket per response can be joined in this way. If you want to pull in all ticket data separately from your survey responses, use a union instead of a join.
Ticket Reporting Datasets are built using ticket data from all projects combined, whereas the data modeler separates each ticket dataset by project. Ticket reporting datasets cannot be imported into the data modeler, but they can be replicated by combining ticket datasets from different projects in the data modeler.
Attention: Only tickets created from surveys can be mapped with the data modeler.
Attention: Ticket Reporting Datasets can not be imported into the data modeler.
Identify the number of ticket source datasets and fields used currently in the Ticket Reporting Datasets for a dashboard.
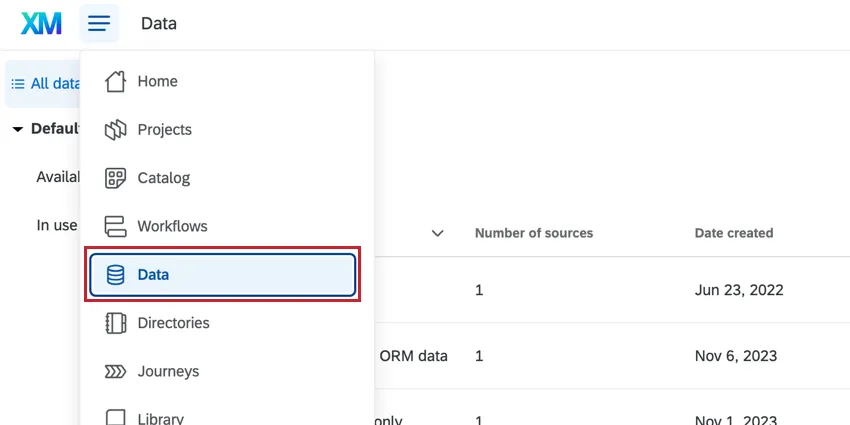
Navigate to the Data page.
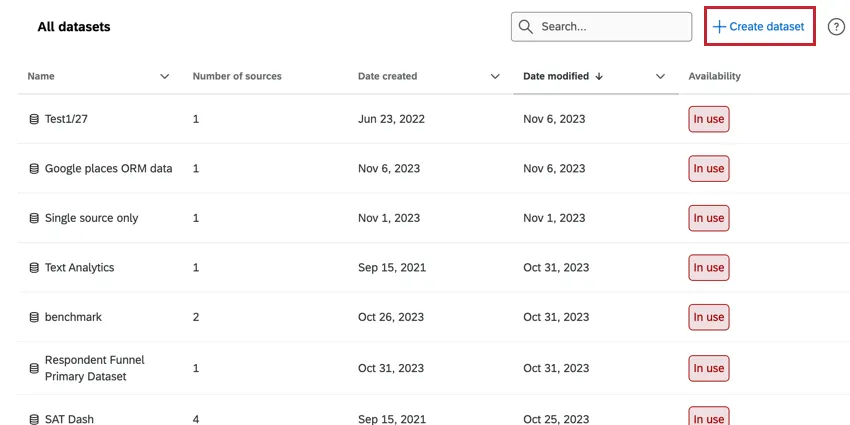
Click Create dataset.
Select the Data modeler (joins) type.
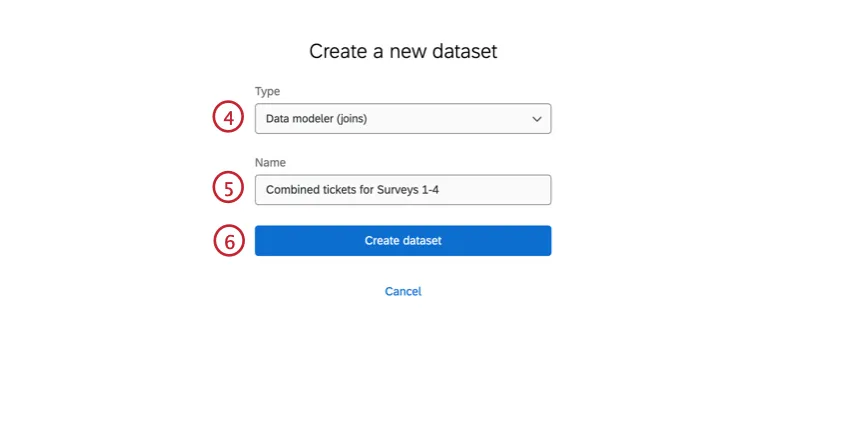
Name your new dataset.
Click Create dataset.
Click Add source and select all of the ticket datasets and corresponding survey datasets from step 1. (For more information, see the Creating a Data Model section above.)
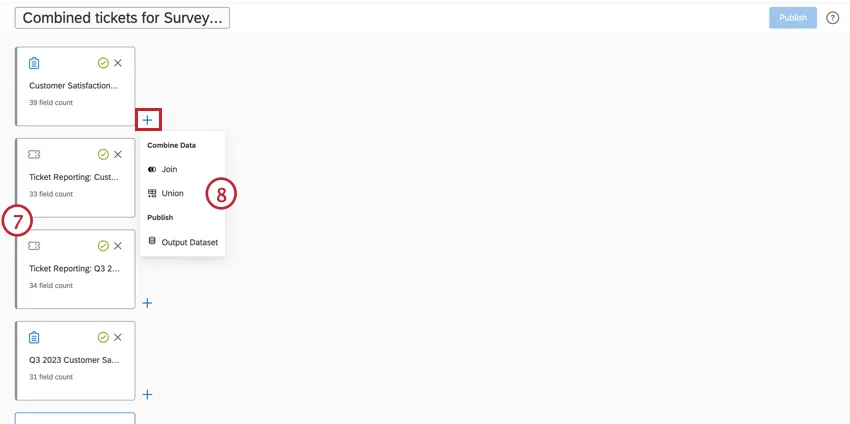
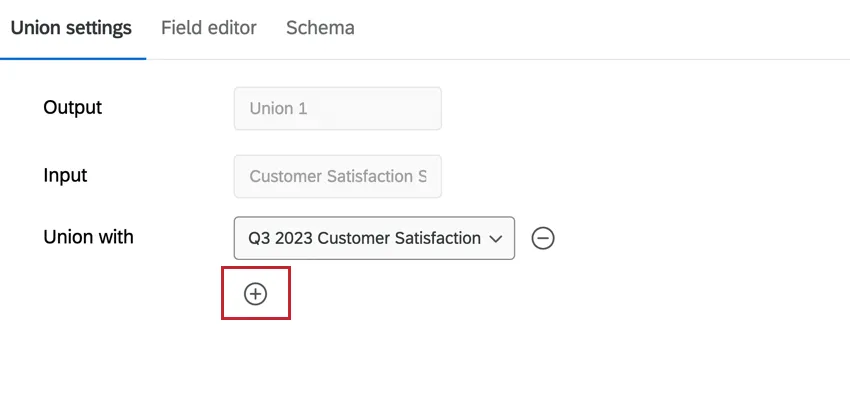
Click the plus sign ( + ) then click Union.
If the input is survey data, select the other survey sources in the Union with dropdown. If the input is ticket data, select the other ticket sources.
Qtip: To union with multiple sources, click the plus sign ( +) under the Union with dropdown.
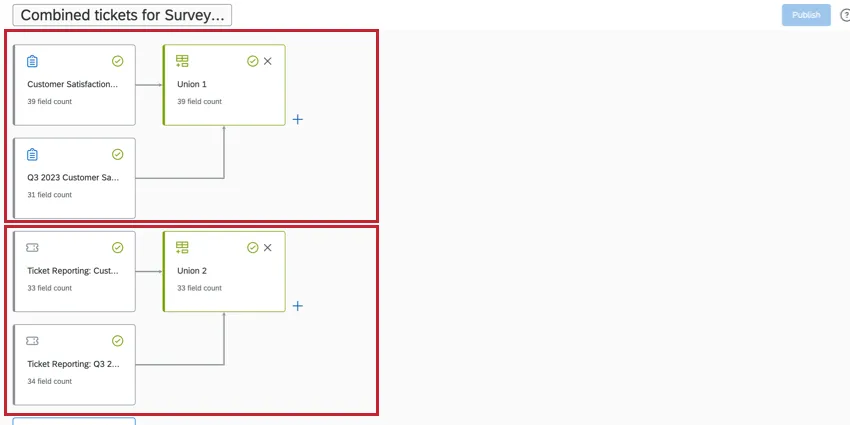
Repeat this step to combine the remaining data in a union. All survey datasets should be in a union together, and all tickets datasets should be in a union together.
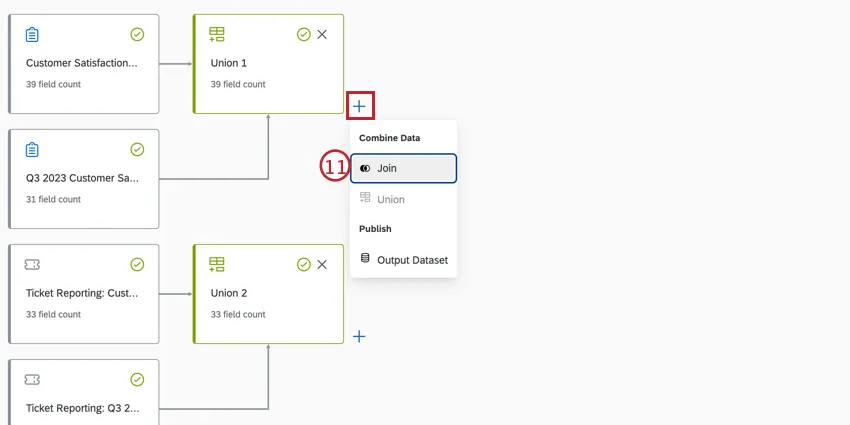
Click the plus sign ( + ) then Left outer join.
For Source 2, select the second union (the ticket union).
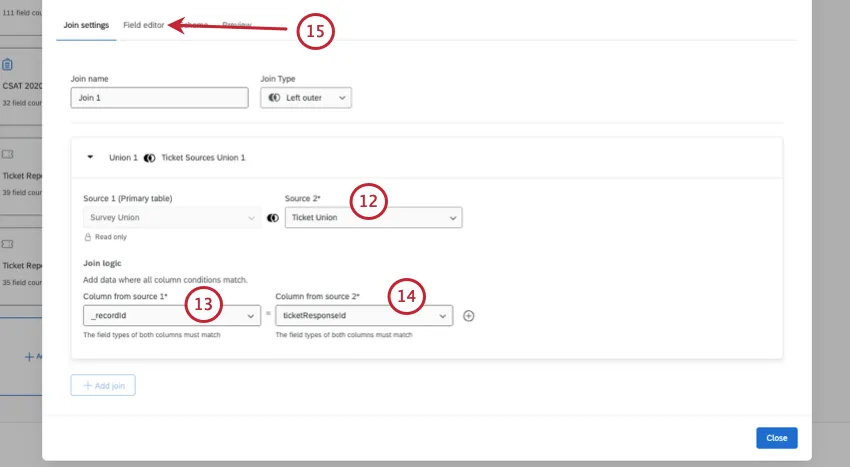
For the Join logic, under Column for source 1, select the recordId.
For the Join logic, under Column for source 2, select the ticketResponseId.
If there are any additional fields you'd like to add, you can do so via the Field Editor.
Click the plus sign ( + ) and select Output Dataset.
Publish your data model.
Follow the steps from the Creating a Dashboard section to use this dataset in CX Dashboards.
That's great! Thank you for your feedback!
Thank you for your feedback!