
Unions (CX)
What's on this page
About Unions
In a data model, unions let you combine multiple data sources together into a single dataset. Rather than combining individual rows of data, as you do in a join, you simply add more rows to the same dataset.
Qtip: Unions are the only way you can combine data in the data mapper.
Understanding Unions
To understand unions, let’s look at a few examples.
Example 1
We ran the same NPS survey in 2019 and in 2020. We create a union between these 2 surveys, and now we can report on both of their data in the dashboard.
If we want to create a widget that shows average NPS performance, we can do that with NPS data from both surveys.
2019 Survey Data
| NPS Score | Department |
|---|---|
| 10 | Clothing |
| 9 | Electronics |
| 7 | Housewares |
2020 Survey Data
| NPS Score | Store |
|---|---|
| 5 | Toronto |
| 6 | Raleigh |
| 9 | Seattle |
Resulting Dataset
| NPS Score | Department | Store |
|---|---|---|
| 10 | Clothing | Null |
| 9 | Electronics | Null |
| 7 | Housewares | Null |
| 5 | Null | Toronto |
| 6 | Null | Raleigh |
| 9 | Null | Seattle |
Example 2
We ran an NPS survey in 2019 and in 2020. However, each year, we added and removed a few different questions. Still, when we create a union between these 2 surveys, we can report on both of their data in the dashboard.
If we want to create an average NPS widget, we can do that with NPS data from both surveys, because they share this data in common.
If we also want to report on Departments, we can add another widget to our dashboard. However, it’s important to note that this widget will only have data for 2019, because there is no department data for the 2020 survey.
2019 Survey Data
| NPS Score | Department |
|---|---|
| 10 | Clothing |
| 9 | Electronics |
| 7 | Housewares |
2020 Survey Data
| NPS Score | Store |
|---|---|
| 5 | Toronto |
| 6 | Raleigh |
| 9 | Seattle |
Resulting Dataset
| NPS Score | Department | Store |
|---|---|---|
| 10 | Clothing | Null |
| 9 | Electronics | Null |
| 7 | Housewares | Null |
| 5 | Null | Toronto |
| 6 | Null | Raleigh |
| 9 | Null | Seattle |
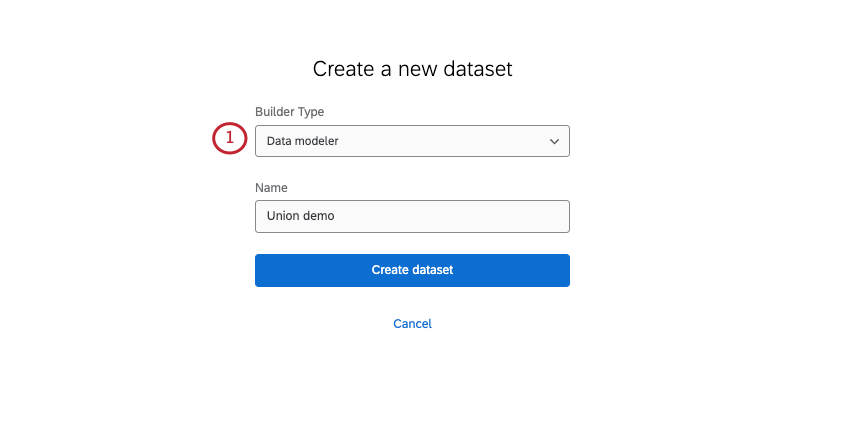
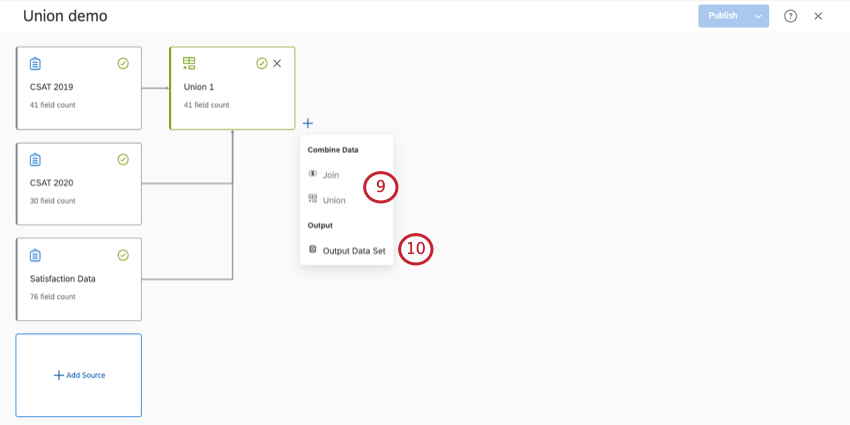
Creating Unions
Qtip: You can only create 3 unions per dataset.
Qtip: If you plan on creating joins, we recommend doing so after you create unions. This will result in the fastest dashboard performance.
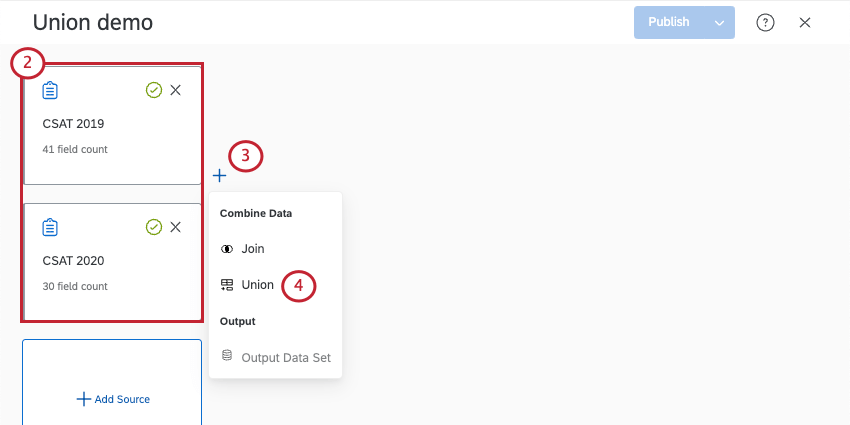
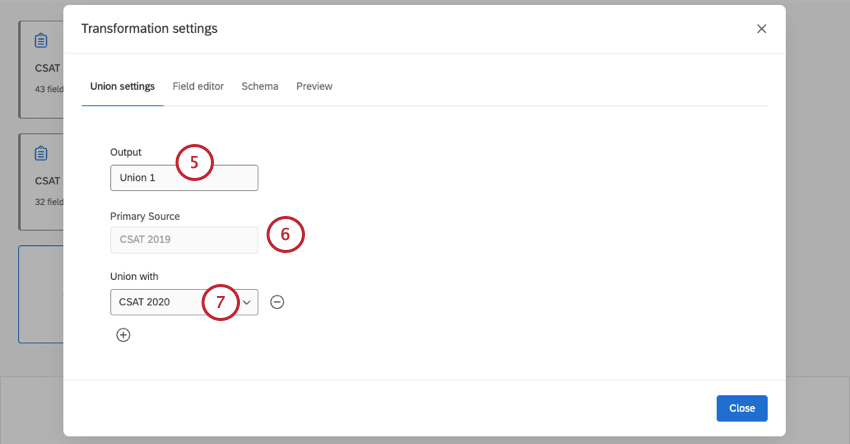
Qtip: Click the plus sign ( + ) to add more sources to the union.
Qtip: See Mapping, Merging, and Separating Fields for more details.
Qtip: When you’re finished making edits, click Close.
Mapping, Merging, and Separating Fields
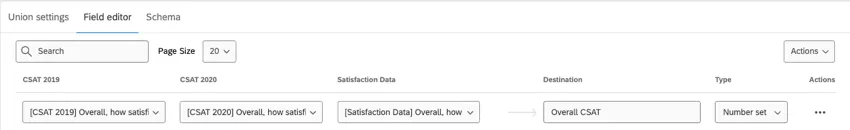
When you map data, you decide the specific survey questions and metadata that relate back to your dashboard data. As you create a union, similar questions from different surveys will map back to the same dashboard field.
Example: The same overall customer satisfaction question from 3 different surveys is mapped into the same dashboard field named Overall CSAT.
A lot of fields are mapped automatically based on detected similarities. However, it’s always best to double-check the data for accuracy.
Qtip: Fields only automatically map if the field in each sources matches exact naming. For example, if you have a field named “Age” in one source and “Q3 – Age” in the second source, they won’t automatically map. But if the fields are just called “Age” in both sources, they’ll map together.
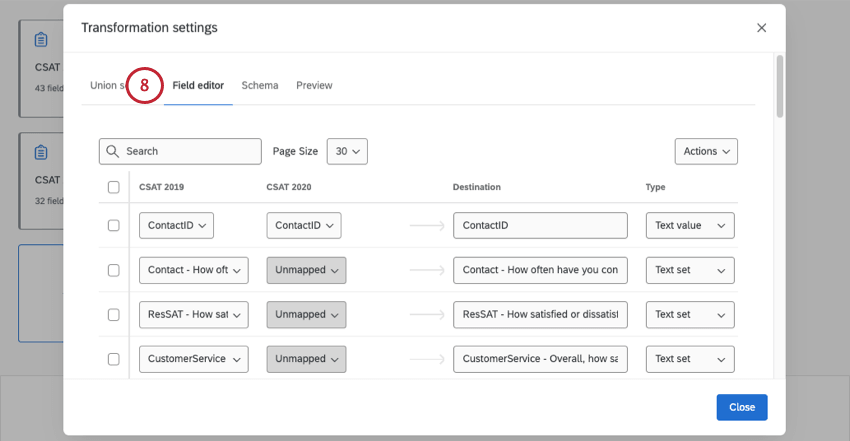
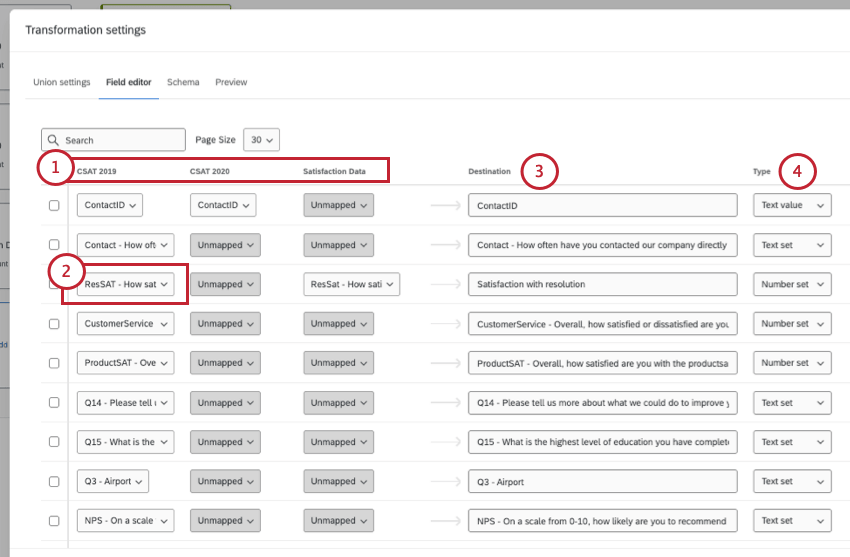
All data mapping happens in the Field editor tab.

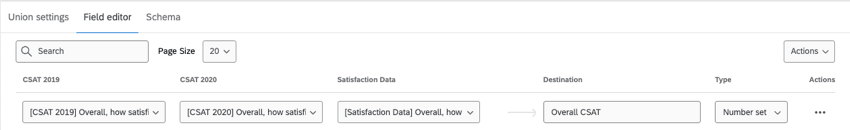
Example: In this row, the CSAT 2019 and Satisfaction Data surveys have questions mapped to the Satisfaction with resolution field. CSAT 2020 is not mapped to this field.
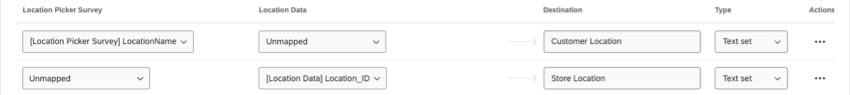
You do not have to map every source to every field; it is ok to leave items unmapped. You can merge data from multiple sources into the same field or keep the data separate as needed.
Example: The location data we collected in these 3 surveys doesn’t communicate the same info: one is store location, and the other is the customer’s home location. We separate these fields by mapping sure only the matching source is mapped, while leaving the other source unmapped.

Adding a New Field
You can add a new field to your union, the original source, and any joins you have in your data model. If you’re adding a new field, you need to make sure you add it to every node in the model.
For more detailed steps, see Adding a New Field.
FAQs
Are changes to data models reflected immediately in dashboards?
Are changes to data models reflected immediately in dashboards?
If you have multiple sources of the same type in your dataset (such as tickets and surveys), we generally recommend creating unions before you create joins.
That's great! Thank you for your feedback!
Thank you for your feedback!