
Dashboards Basic Overview (Studio)
What's on this page
About Dashboards (Studio)
Qtip: Permissions may be limited by a license. For information on how to change a user’s permission, see Managing Users in Studio, or see XM Discover Licensing for more details about administrative use. See also Sharing Dashboards and Books for information on sharing dashboards and books.
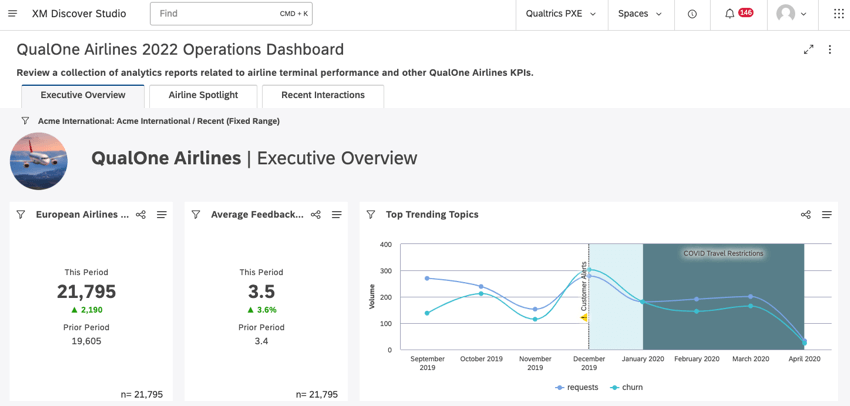
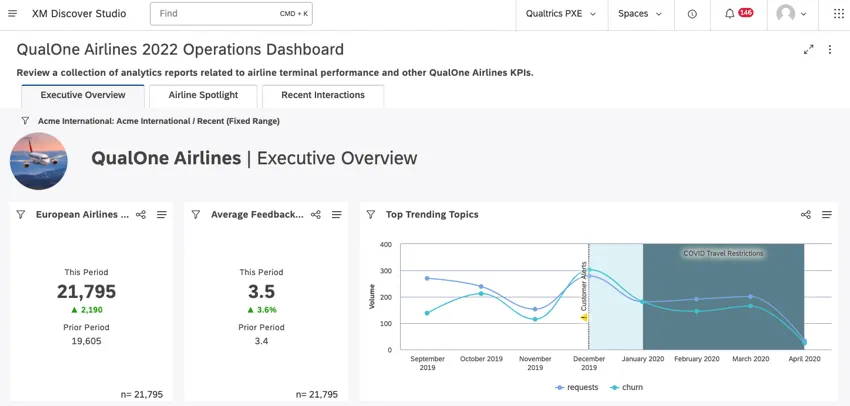
In Studio, a dashboard is a customizable collection of graphs and visualizations called “widgets”, curated on a single page or view. A single dashboard can hold up to 25 reporting widgets and up to 50 content widgets. You can arrange the widgets freely around the dashboard’s canvas.
Qtip: We recommend that you create separate dashboards for different purposes and target audiences.
Widgets are organized inside a dashboard. You can combine dashboards into a library, which is called a “book”, that is easy to navigate and shareable.
There are many ways you can interact with a dashboard to dive deeper into a particular data point or insight within a graph or widget. Depending on your specific user permissions or your dashboard author’s design choices, you can, for example, do the following:
- Change the dashboard filters.
- Click into an attribute or model in one visualization to filter or segment another data visualization.
- Sort key performance metrics.
- Drill down into data points to dive deeper with additional visualizations.
Dashboard Types
Dashboards are often designed for monitoring key performance indicators, explanations of insights, a springboard for exploration of insights and root cause analysis, and many other purposes. There are 3 types of dashboards that have maximum impact for stakeholders:
- Operational: A monitoring tool that provides a comprehensive snapshot of a business’s performance in a given period. It’s an exploration to find and analyze pain points, the “pulse” of your customer feedback.
- Analytical: A tool used to focus on a specific business question to identify trends, changes to KPIs, and quantify impact. The results presented in the dashboard usually stem from using the operational dashboard as an exploration tool.
- Strategic: Looks at benchmark performance data, and compares it to the current period to track value over time and close the loop for a specific business question.
Navigating Dashboards Using Dashboard Explorer
When you first click into an email with a link to a shared book or dashboard or sign in to Studio, the landing page is called the dashboard explorer. This is where you can browse or view all of the dashboards and books shared with you. For more information, see Navigating Dashboards Using Dashboard Explorer.
Creating and Managing Dashboards
Studio allows you to create customizable dashboards featuring charts and tables called widgets. For more information, see Creating Studio Dashboards.
Dashboard Properties
Dashboard properties define the dashboard’s title, description, owner, content provider, and personalization settings. For more information, see Dashboard Properties.
Editing Dashboards and Books
After a dashboard is created, you can change its properties or edit its widgets. For more information, see Editing Dashboards. After a book is created, you can change its properties, modify its tabs, and make quick changes to the dashboards within a book. For more information, see Editing Books.
Duplicating Dashboards and Books
You can duplicate books created by you or by other users. For more information, see Duplicating Books.
Dashboard Versioning
A version is a snapshot of all the dashboard’s widgets, applied filters, and personalization created whenever your dashboard is saved. For more information, see Dashboard Versioning.
Scheduling Dashboards
You can schedule a dashboard to periodically refresh or distribute a PDF snapshot via email. For more information, see Scheduling Dashboards.
Publishing Dashboards
Dashboard publishing lets you decide when your dashboard is finished so you can push all of your changes live at once. For more information, see Publishing Dashboards.
Commenting on Dashboards
Studio users can discuss a dashboard with other viewers by leaving comments on it. For more information, see Commenting on Studio Dashboards.
Customizing Dashboards
You can customize dashboards and books by applying preview color themes and pattern fills. For more information, see Customizing Dashboards and Books.
Dashboard Components
Dashboard components include category models, attributes, filters (both Studio and Designer), and metrics used in your dashboard. For more information, see Dashboard Components. Sentiment can be used across XM Discover to build informative dashboards. For more information, see Using Sentiment Data.
Sharing Dashboard Components
You can share dashboard components with the dashboard’s users, and give these users the same level of access they have to the dashboard, or a lower level. For more information, see Sharing Dashboard Components.
Drillable Dashboards
Drillable dashboards let you drill from a reporting item in one dashboard to another dashboard filtered on that item’s definition. For more information, see Drillable Dashboards.
Labeling Dashboards and Books
You can add labels to dashboards and books to provide additional context into their purpose and enhance their findability. For more information, see Labeling Dashboards and Books.
Rating Dashboards and Books
Studio users can rate dashboards and books on a 5-star scale, helping other users find the best dashboards in Studio. For more information, see Rating Dashboards and Books.
Embedding Qualtrics Dashboards in XM Discover
Users with access to XM Discover and CX or EX dashboards can use Studio as the single reporting platform by embedding their dashboards in Studio books. For more information, see Embedding Qualtrics Dashboards in XM Discover.
Deleting Dashboards and Books
You can delete dashboards or books if you no longer need them. For more information, see Deleting Dashboards and Books.
Filtering Dashboards
You can create and apply filters to an entire dashboard. For information on creating filters, see Creating Dashboard Filters. To learn more about applying filters, see Applying Dashboard Filters.
You can also use a widget as a filter. This lets you use data points in one widget as filters for other widgets. For more information, see Using Widgets as Filters.
Exporting Studio Data
Depending on viewer access and permission level, it’s possible to export Studio data from all reporting widgets of a dashboard to an XLSX file and export and save a dashboard as a PDF file for offline viewing or quick sharing. For more information, see Exporting Studio Data.
Dashboard Access
Sharing Dashboards and Books
You can share dashboards and books with individual users, groups, or even someone who hasn’t registered in Studio yet. For more information, see Sharing Dashboards and Books.
Embedding Dashboards in Third Party Applications
You can embed dashboards in third party applications and websites with compatible iframe technology. For more information, see Embedding Dashboards in Third Party Applications.
Transferring Dashboards and Books
Dashboard owners can transfer their dashboards to other users, making them the new owners. For more information, see Transferring Dashboards and Books.
Requesting Dashboard Access
If you don’t have access to a dashboard in Studio, you can request access to the dashboard. For more information, see Requesting Dashboard Access.
That's great! Thank you for your feedback!
Thank you for your feedback!