
Creating A Data Model (EX)
What's on this page
About Creating A Data Model
After creating a new Employee Journey Analytics project from scratch, the next step is to set up a data model to join two or more of your existing data sources. Within the data model you are able to add data sources, join data sources, filter your data, and create an output dataset that will be used for analysis.
Just about any type of Employee Experience project’s data can be mapped to your Employee Journey Analytics model. For a list of compatible project types, see this table.
Qtip: This page only describes data models in Employee Journey Analytics projects.
Adding and Editing Sources
The first step when creating your data model is adding a source.
Attention: You can add a maximum of 10 sources to each project.
Editing a Source
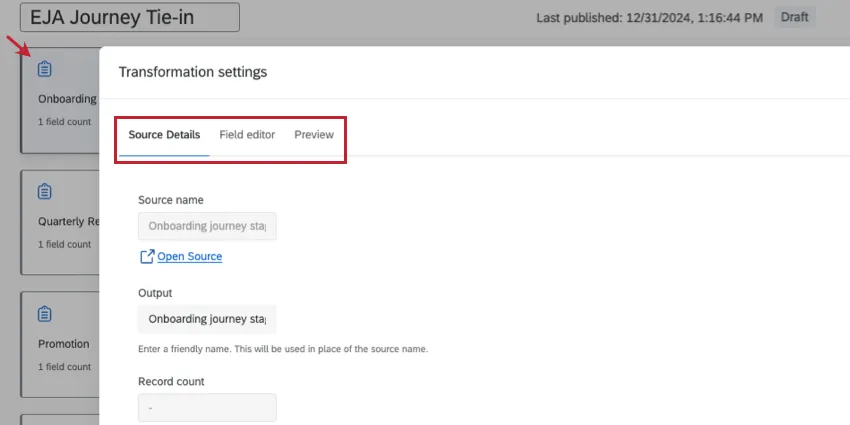
When you click on a source there are a few tabs that display additional information:
Navigate to the Data Model tab within your Employee Journey Analytics project.
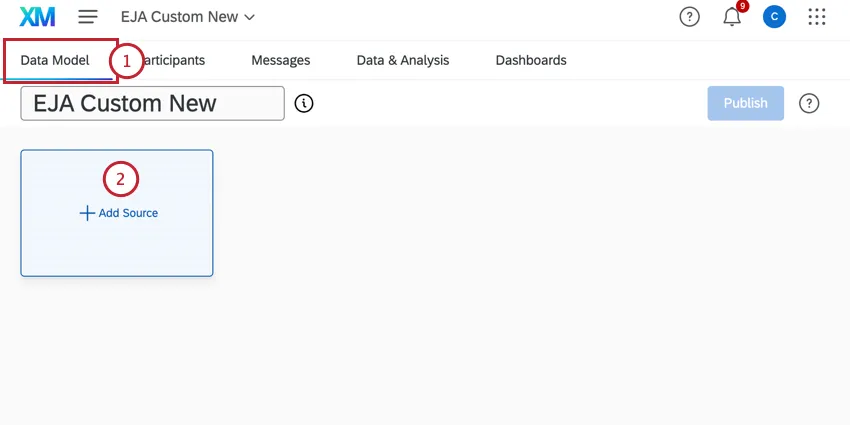
Click Add Source.
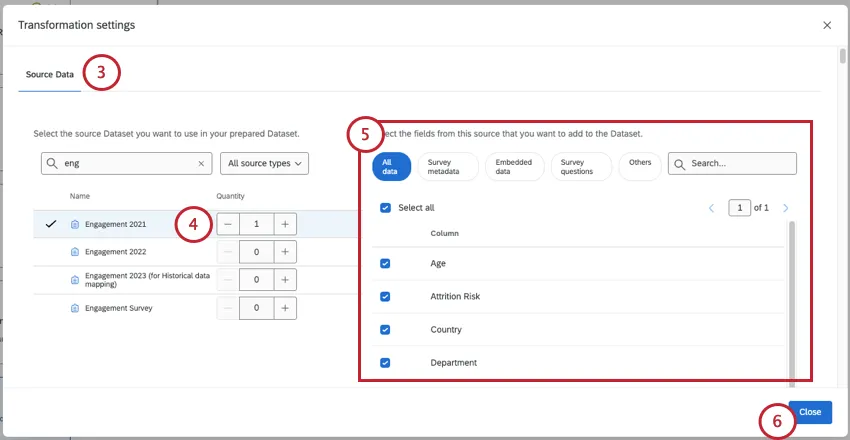
Under Source Data, find an EX projects to use for the data model.
Attention: Only projects you have access to will appear in this list. If any projects are not showing up, make sure they have been collaborated with you.
Qtip: Click All source types to filter results by a specific source type.
To add the source to the model, change the Quantity to 1 (or more, if desired).
Qtip: It can be useful to add the same source more than once if you plan to perform separate unions and joins in your dataset. You cannot create a union or a join with multiple copies of the same source.
Select all the fields you want to include in your dataset. You can click on different types of data, like “Survey questions”, to see only those fields, or use the search bar to search for specific fields.
Qtip: When selecting fields to include in your data model, think about which fields will be important when analyzing your data. Fields that are commonly included are survey questions, important metadata, and the field you plan on using to join your data sets.
When you have finished selecting fields, click Close. Your selections will be saved automatically.
Repeat steps 2-5 for each project you want to add as a data source.
Qtip: If you are adding two or more surveys to your data model that contain the same employee and organization data, you may only want to include one set of this data. Including the same fields twice will create duplicates in your output data set and dashboard.
Source Details: This tab shows the source name of the dataset, the number of records in the source, and the number of fields in the source. You can also edit the output name of the source, which is what appears in the data model.

Qtip: Editing the output name will not change the name of the original source.
Field editor: This tab shows the fields you selected when adding the source, as well as their field type. You can also remove fields, edit fields, recode fields, and add new fields here.

Attention: Any edits made here will cause connections that modify the data source to be reset. Field edits should be done before adding connections that modify the data source.
Removing a Source
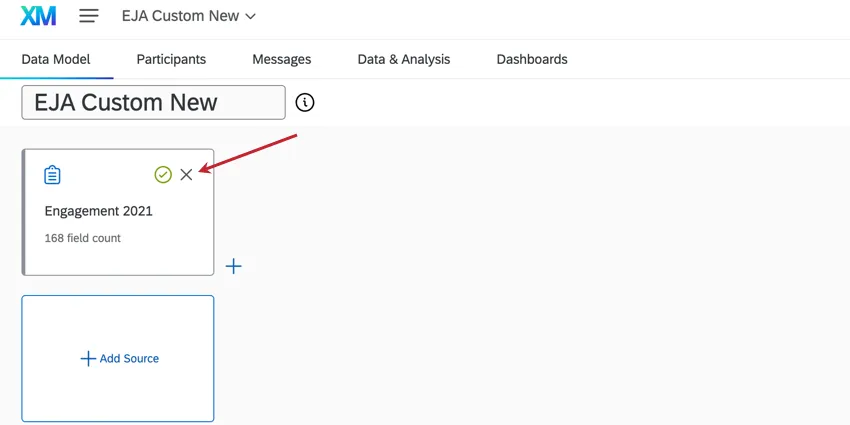
If you have added a source to your data model but decide you no longer want it, click the x to remove it.
Qtip: You cannot remove a source if it is connected to any transformations.
Attention: Any field edits made in Manage fields will be reset when a source is removed.
Filtering Rows
Filtering rows in your data model narrows down the responses included in your dataset.
Example: Add a filter to your sources so that only data from the last 12 months is displayed, allowing you to analyze trends over the last year.
This section covers the basics of adding a filter within your data model. For more information on nesting logic or choosing between any/all, see Filtering Responses.
Click the plus sign (+) next to the node you want to filter.
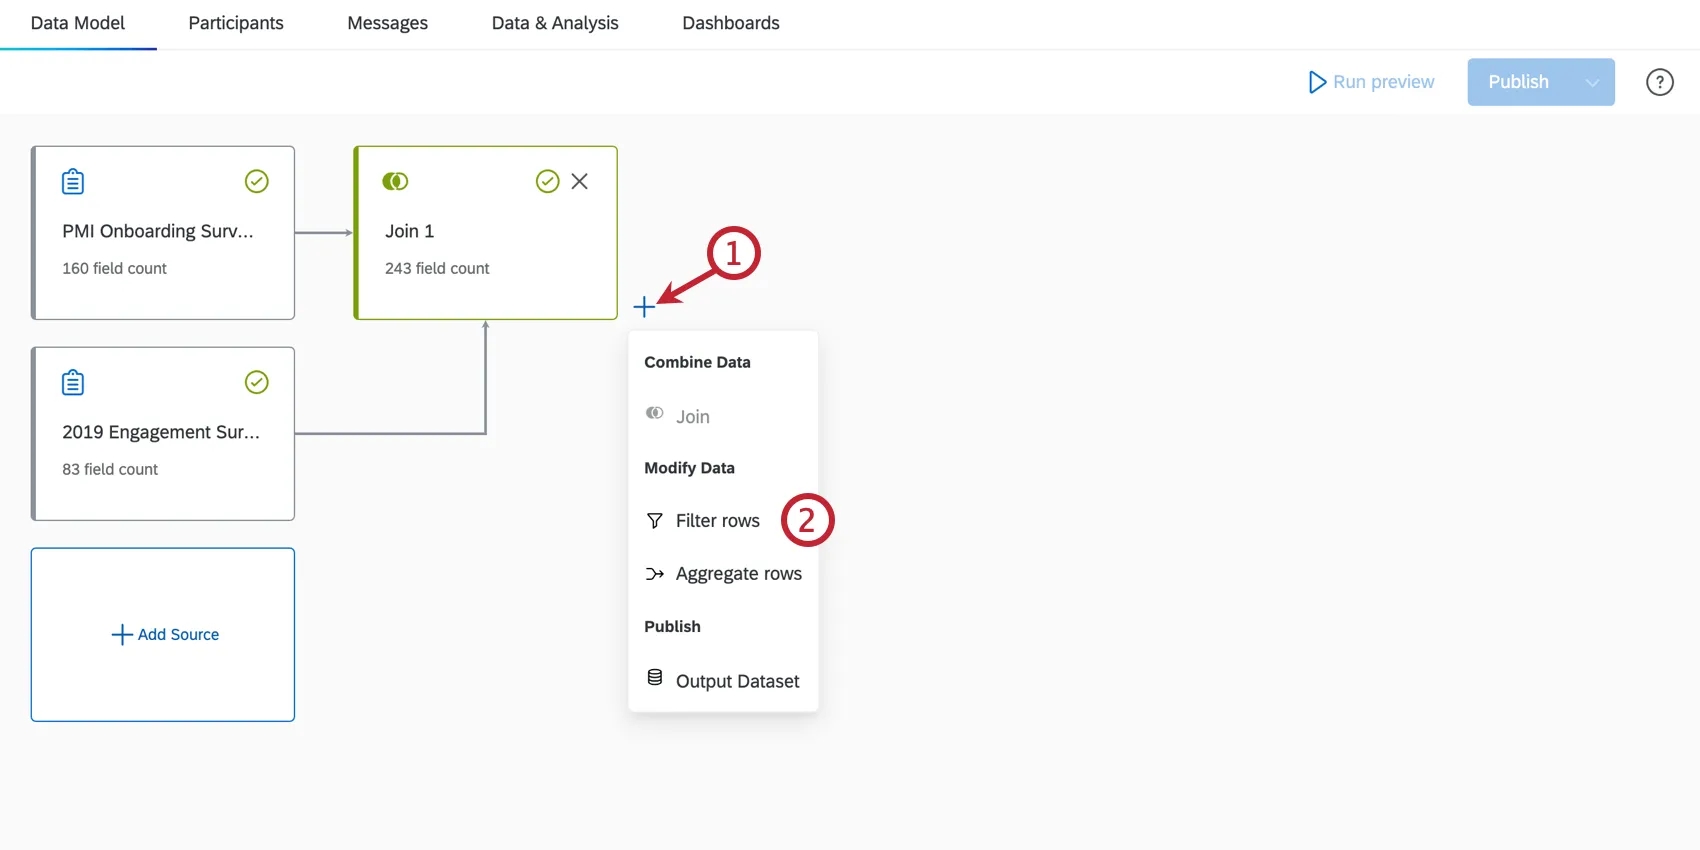
Click Filter rows.
Click into the Output field to edit the name of the filter if desired.
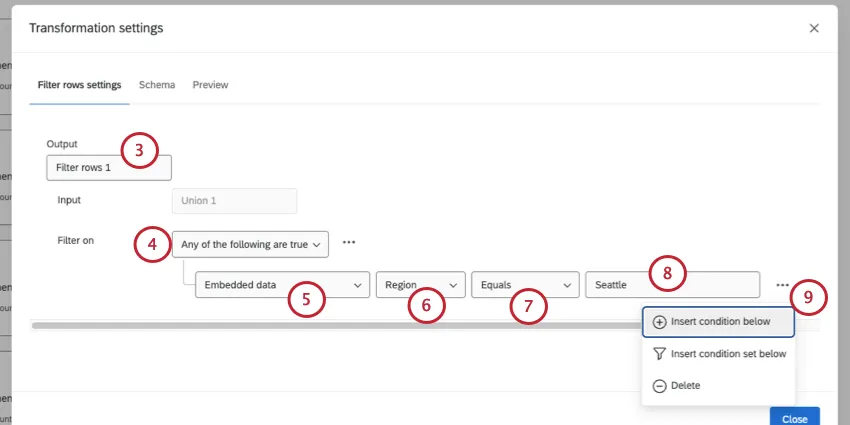
Choose whether all conditions need to be met for a record to appear in a filter, or if only some of them need to be met. See All vs. Any for more information.
Select a data type for the filter. If you want to create a filter based on fields from a survey project, select either Embedded data or Survey metadata. If you want to create a filter based on fields from an Imported Data Project, select Others.
Select a specific field for the data type you selected.
Select a condition for the filter.
Select a value for the filter. In the above screenshot, the joined data is being filtered to only include employees that are in the Seattle office.
Click the three horizontal dots next to the first condition to add additional conditions or condition sets, or to delete the condition.
If desired, click the Schema tab to view the fields in your data set, as well as their field type.
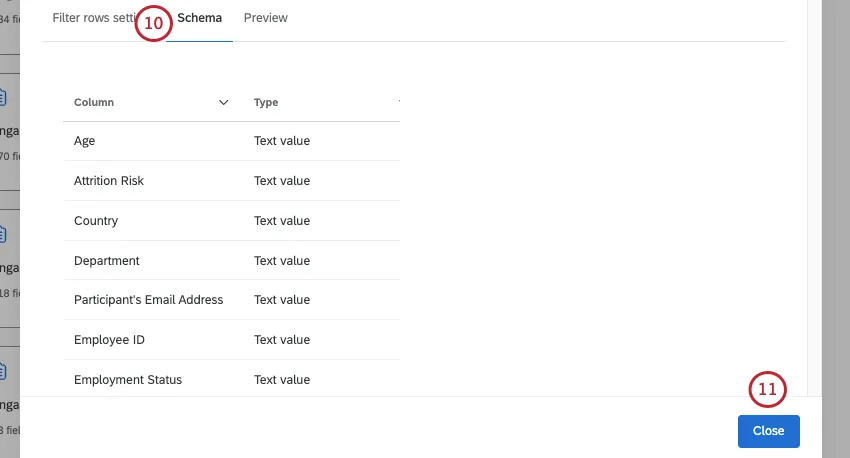
Qtip: Field mappings, names, and types cannot be edited here. To edit fields, open a previous node, like the source.
When you're done, click Close. Your selections will be saved automatically.
Editing, Removing, and Adding Fields
Attention: Editing Join and Filter transformations will reset any edits made in the Field Editor tab for the current transformation, as well as any future transformations and associated field edits.
For steps to edit fields, see the following support pages. Although these are CX pages, the functionality is exactly the same in the Employee Journey Analytics data modeler.
Performing Joins
Joins allow you to combine rows from 2 or more data sources based on a related column of data that they share. By using a join, you can gather and analyze the combined data more efficiently and effectively, creating more insights. Currently, the data modeler only suppers left outer joins.
For more details, see the Joins (CX) support page. Although this is a CX support page, the functionality is exactly the same in the Employee Journey Analytics data modeler.
Qtip: A common example of a join key for employee data is the employee unique identifier.
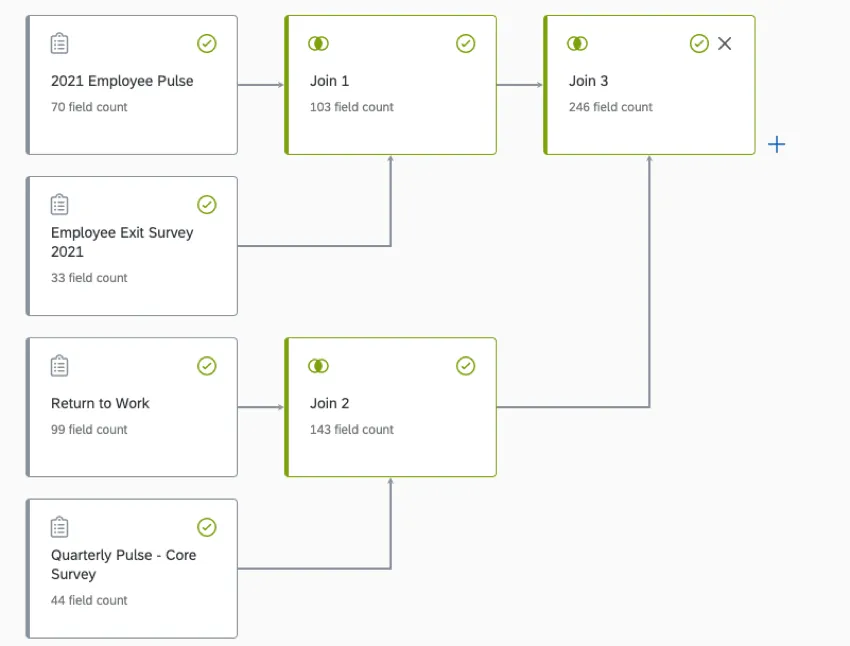
Example: This is what a completed data model with joins might look like for employee data.
Joining Multiple Participant Responses
Depending on your source projects, it’s possible a participant may have multiple responses in the project tied to the same unique identifier (e.g., a Lifecycle project with multiple responses enabled). The way these responses are handled in the data model is based on the source join order.
If the “right” source has duplicate join keys (i.e., multiple responses per unique identifier), then the data model will join on 1 response and drop the others. However, if the “left” source has duplicate join keys, then the values on the “right” source will be duplicated across those on the “left” source with matching join keys.
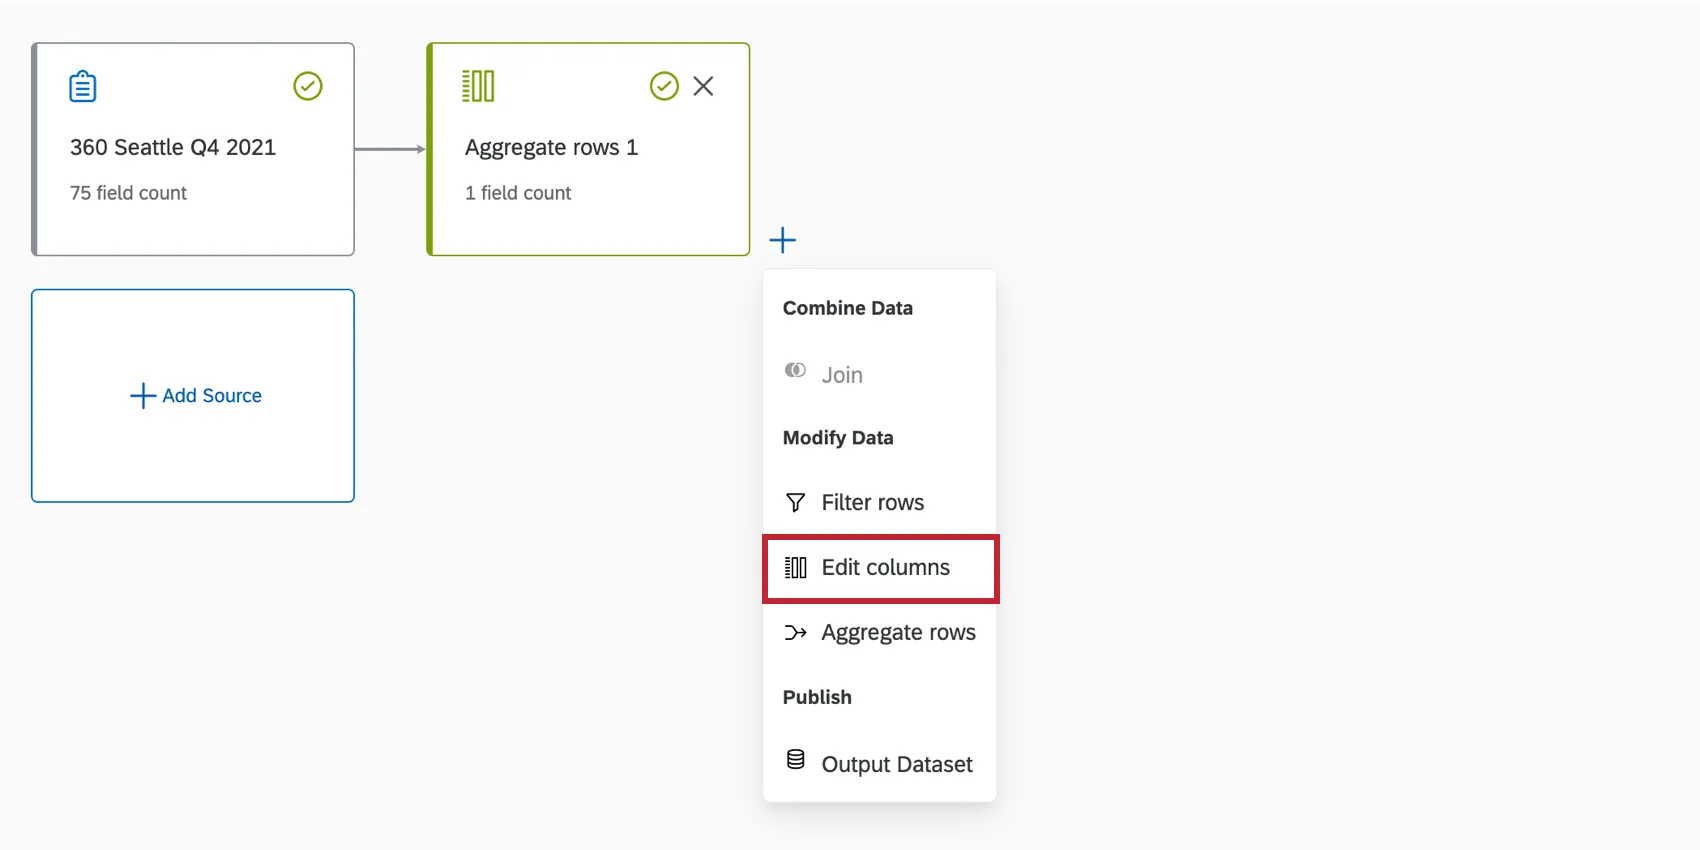
Aggregating Rows
You can aggregate rows in your data model to help you report on variables in both datasets. This is especially helpful if you have fields in your projects that represent the same data but are called different names.
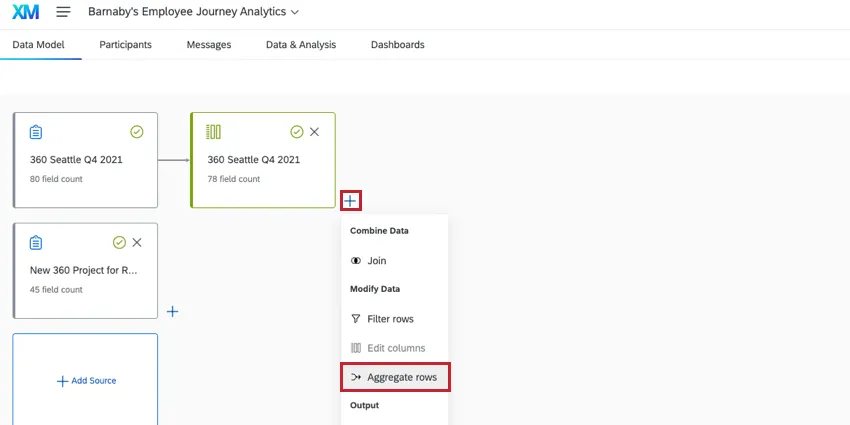
See Aggregating Data Model Rows for step by step instructions on aggregating rows. Note that while the linked page discusses EX + CX reporting functionality, the steps to aggregate data in an Employee Journey Analytics project are the same (you will use 2 EX projects instead of 1 EX and 1 CX).
Qtip: To edit fields with aggregate rows, add an Edit Columns component and edit the fields in the Field editor tab.
Adding an Output Dataset
Once you have finished combining and modifying your data, it is time to add an output dataset.
Click the plus sign next to the last element in your data model.
Select Output dataset.
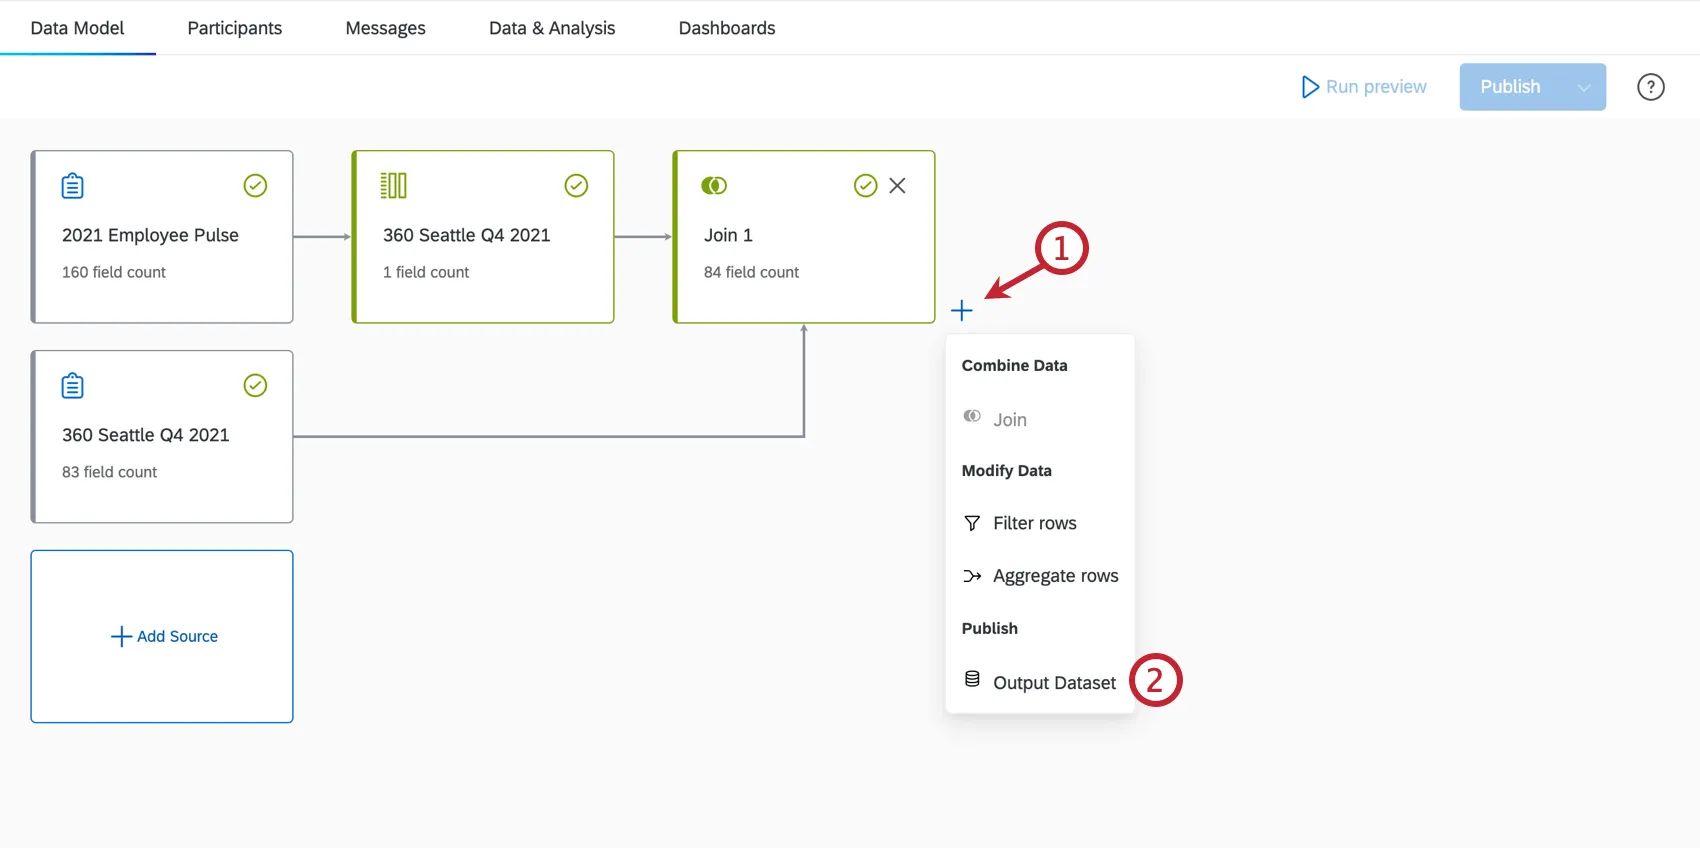
Give the output dataset a name.
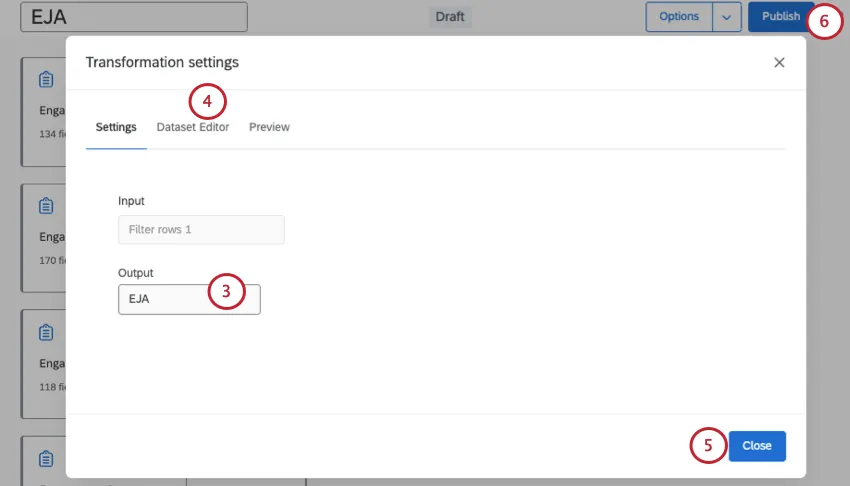
If desired, click the Dataset editor tab to view the fields in your dataset, as well as their field type.
Attention: There is a limit of 1,000 columns for your output dataset.
Click Close.
Publish your data model changes.
Previewing Your Data Model
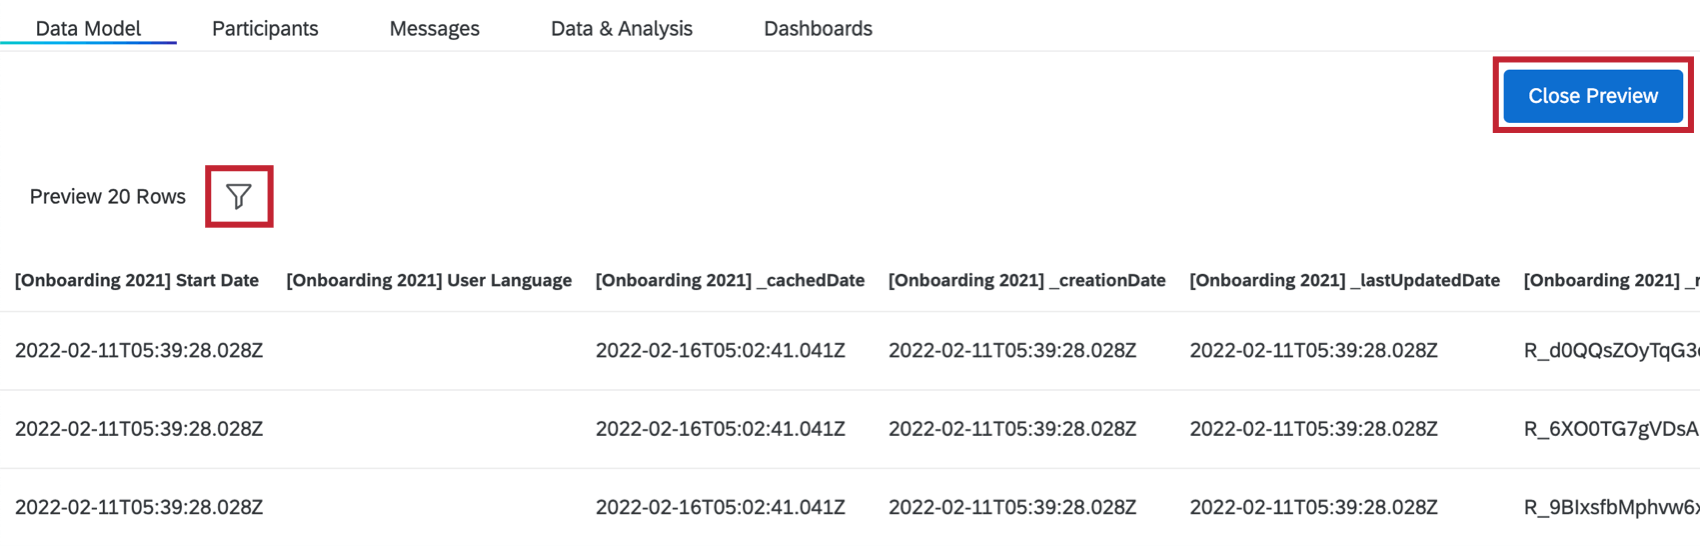
After creating your data model, click Run preview to generate your output dataset.
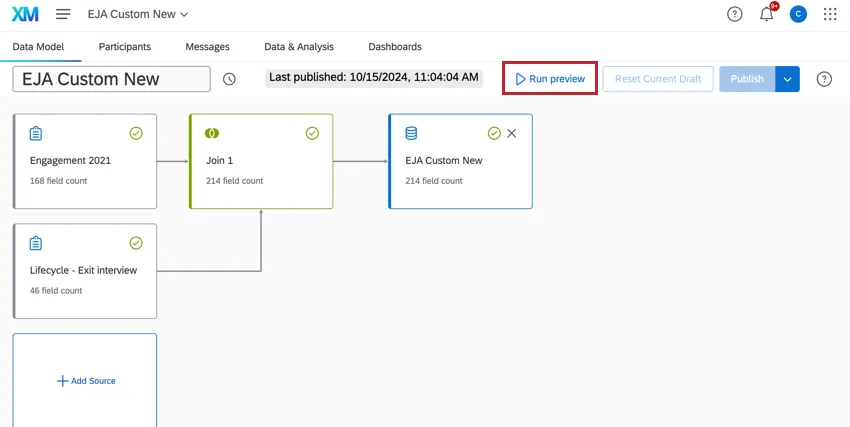
This may take a while to generate; when the preview is complete you will be taken to a preview of your dataset.
Attention: If it takes more than a couple hours for your dataset to load, you can reach out to Qualtrics Support.
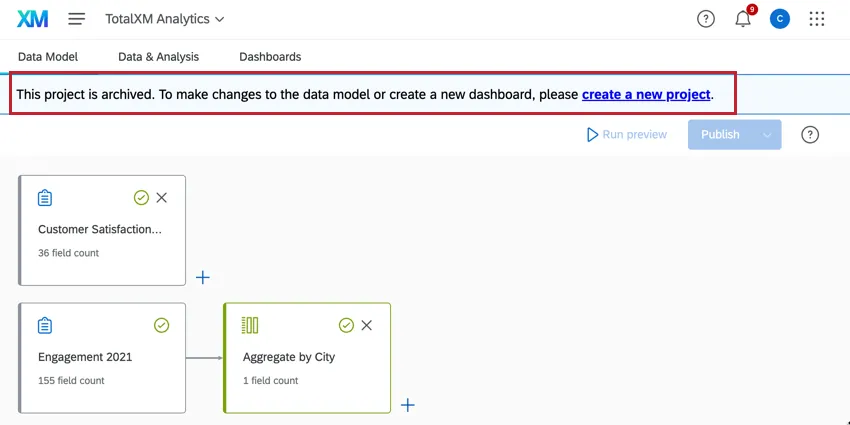
Archived Projects
Attention: Projects created before November 6, 2024 use the old data model and have been placed in an Archived state. You cannot edit, publish, or refresh the data model in archived projects. Previously published data, dashboards, participants, and Stats iQ will continue to be available and operational, however dashboard creation and copying is disabled in archived projects. Archived projects cannot be copied; create a new project instead.
FAQs
Are changes to data models reflected immediately in dashboards?
Are changes to data models reflected immediately in dashboards?
If you have multiple sources of the same type in your dataset (such as tickets and surveys), we generally recommend creating unions before you create joins.
What’s the difference between data sources and datasets?
What’s the difference between data sources and datasets?
Learn more about these key terms.
What happens if I edit a field that’s being used to join 2 data sources together?
What happens if I edit a field that’s being used to join 2 data sources together?
That's great! Thank you for your feedback!
Thank you for your feedback!