
Respondent Funnel in the Data Modeler (CX)
What's on this page
About Using a Respondent Funnel in the Data Modeler (CX)
By hosting respondent funnel, contact, and even survey data in the same dashboard, you can create a more insightful and comprehensive report on the performance of your Qualtrics distributions. By having both contact and distribution data in the same dashboard, you can break out delivery and response metrics by important demographics and key customer information.
To accomplish this, you’ll join the contact and respondent funnel information together.
Qtip: The steps in this page are intended to provide an example, but you may need to adjust the structure of your data model depending on your reporting goals.
Qtip: As you create your data model, recommendations will appear, making joins quicker and easier than ever. We recommend adding all of your key sources first, then seeing what your data modeler says to do next. For examples of datasets this feature can help you build, see Recommended Edits.
Attention: Another key improvement of the data modeler over the data mapper is in embedded data limits. In the data mapper, you can only add 50 embedded data fields. In the data model steps covered on this page, there are no embedded data limits.
Qtip: Confused about what datasets are vs. data sources? Not sure how to tell the data mapper and modeler apart? Learn more about these and more key terms.
Step 1: Enabling Respondent Funnel Data
Before you can build the dashboard dataset described on this page, the respondent funnel needs to be enabled for your account, and the directory’s funnel data needs to be prepared.
For exact steps, see Enabling Respondent Funnels for a User. A Brand Administrator can complete these steps.
Step 2: Enabling Contact Data
Adding contact data to your dataset allows you to report on response rates and demographics in addition to your respondent funnel data. To use directory data in CX Dashboards, you need to make it available as a source. See Using Contact Data as a CX Dashboard Source for detailed steps.
Qtip: You can map a respondent funnel source without contact data if you only want to report on fields in your respondent funnel.
Step 3: Determine Your Data Model Structure
You will use Joins to build your data model, which allows you to combine rows from 2 or more data sources based on a related column of data that they share. The order of your data sources determines how data is pulled into the model. See Understanding Left Outer Joins for detailed information.
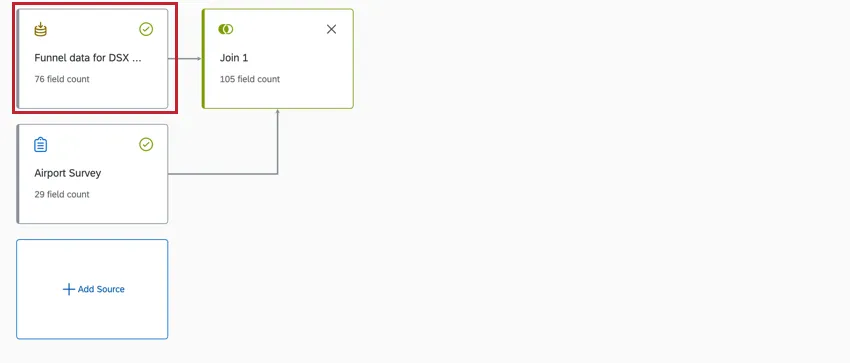
If you want to have a record for every transaction in the respondent funnel, the respondent funnel data source should be on the left. In this example, if a contact does not have a transaction it will be omitted from the dataset.
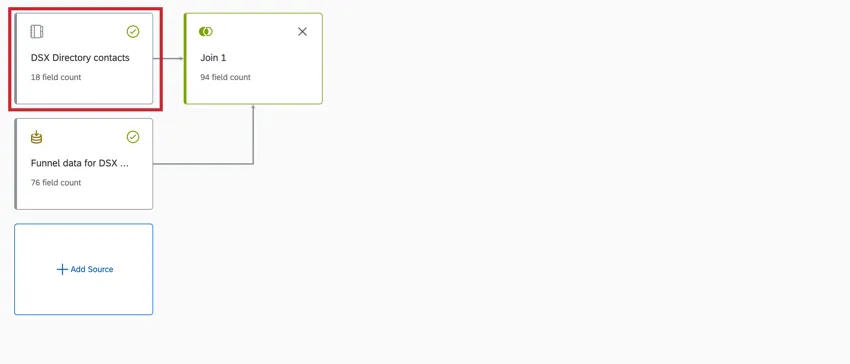
If you want to have a record for every contact in your directory, the directory data source should be on the left. In this example, only one transaction per contact will be added to the dataset.
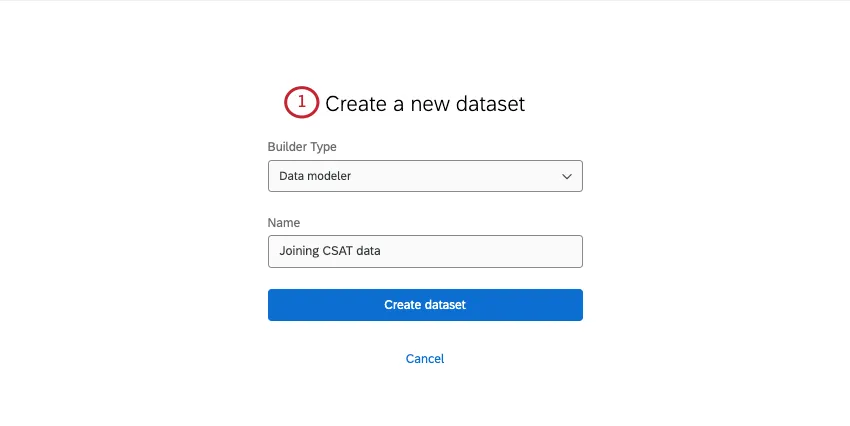
Step 4: Creating a Dashboard Dataset with Contact Data
The goal of this join is to create contact records that contain both embedded data and distribution data. This will allow you to filter and break out respondent funnel performance by key contact information. To instead attach distribution information to survey responses, see this section instead.
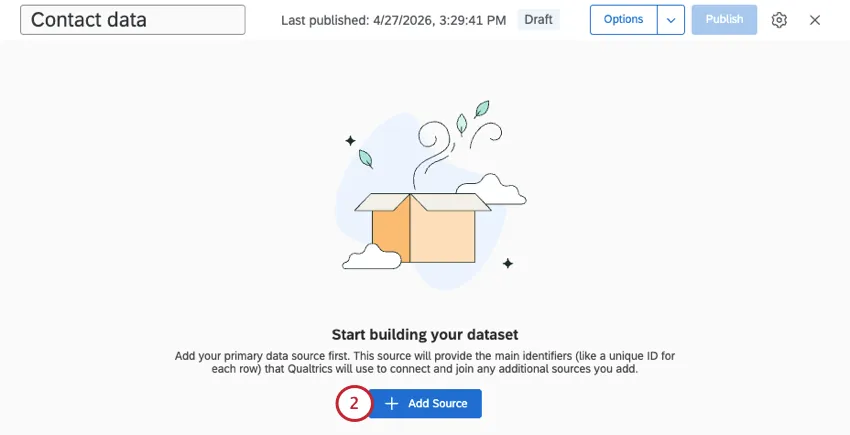
Add a source.
Filter for sources from Directories.
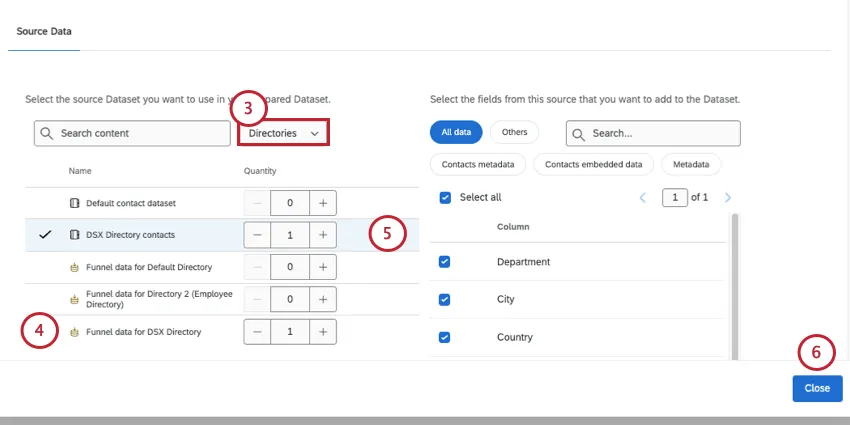
Add your respondent funnel as a source.
Add your contact data as a source.
Qtip: Be thoughtful about the fields you include from your contact data source. If there are sensitive fields you don’t want shown to users, consider excluding them completely from the dashboard data or adding them to a separate dataset with limited access.
Attention: If you have access to multiple directories, make sure the directory name matches both the contacts and respondent funnel data!
Click Close.
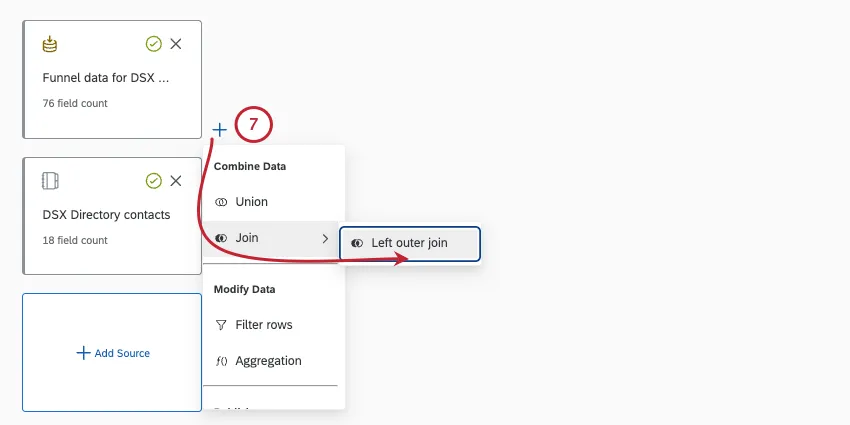
Next to the respondent funnel source, add a left outer join.
Under Source 2 (also called the right input or secondary table), select the contact data.
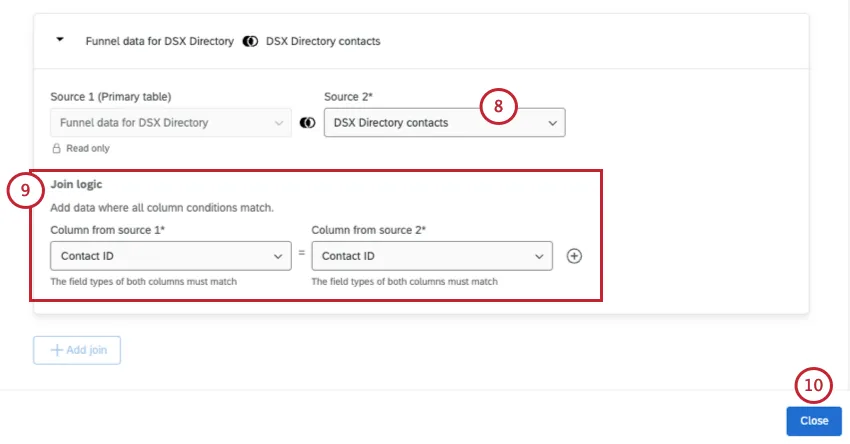
Under Join logic, select Contact ID for both the left and right sources.
Click Close.
Create an output dataset.
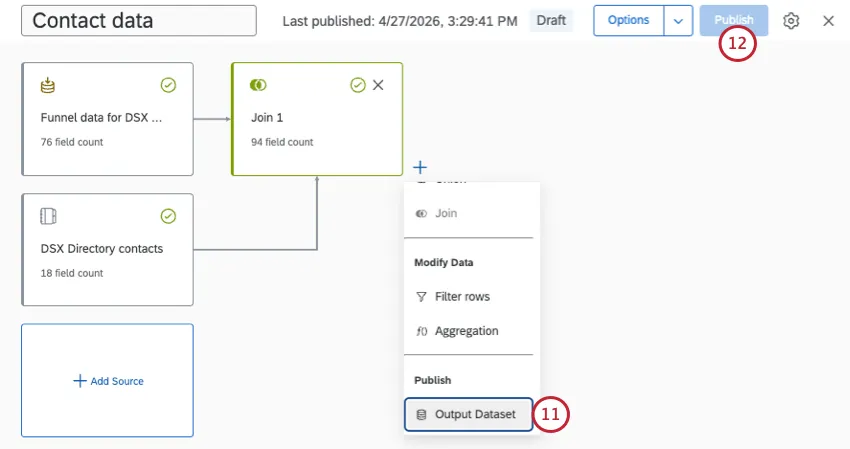
Publish your changes.
Qtip: For more information, see Joins (CX), and Creating a Data Model (CX).
Step 4: Creating Custom Funnel Metrics
Now that your data is joined, you can start building custom metrics like response rate and completion rate. For steps, see the following resources on the Respondent Funnel support page:
- Response Rate and Completion Rate
- Example Custom Metrics (More ideas for custom metrics you can build)
- Default Fields (A guide to the fields’ meanings and the types they should have)
If you want to make edits to the fields in the data model beyond what’s covered above, check out Editing Dataset Fields.
Qtip: If you need to change the field type, you edit at the source or in the join. You cannot edit the data model’s output field types. See more details.
Step 5: Building a Dashboard
Once your data is mapped, you’re ready to start making your dashboard!
All the data you’ve mapped can appear together on regular dashboard pages. This means you’re free to start building widgets and filters as you normally would, with a mix of both contact and response funnel data available for you to work with.
Qtip: For help getting started building dashboards, see Creating Your Project and Adding a Dashboard (CX).
Mapping Survey Responses With Your Funnel Data
You can join funnel data with survey data, or join funnel data with contact data, but you cannot join all 3 together, because they cannot be joined using the same key.
In this section, we’ll discuss how to link funnel and survey data without contact data.
Qtip: There is a limit to how many unions or joins you can create in a data model. See the linked pages for more information.
Determining Your Data Model Structure
The order that your data sources are listed in the model determines how data is processed by the join, so it is important to determine the structure that will work best for you. You should also consider what type of join you want to use. To learn more with examples, see Joins (CX).
Qtip: For the fastest dataset updates, we recommend left outer joins.
Joining Multiple Surveys
If you want to include multiple surveys in your dashboard, you should create a union of all of these surveys first. You’ll then join the union to your first join.
Add your surveys as sources to the data model.
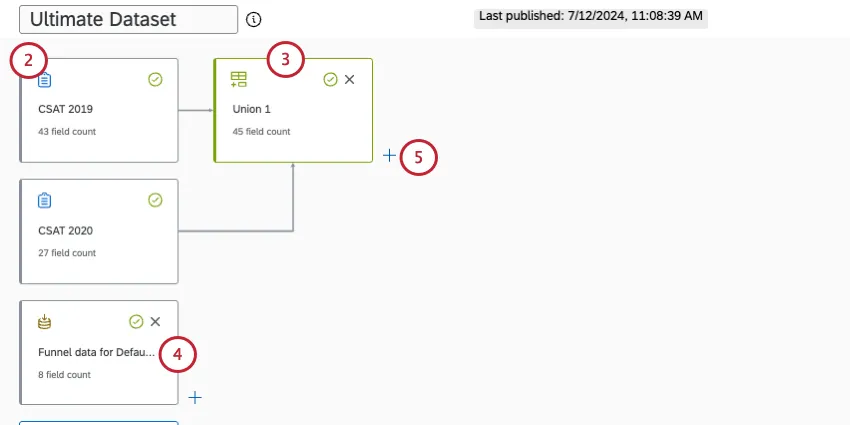
Add your respondent funnel data as a source to the data model.
Next to the union, create a left outer join.
Under Source 2 (also called the secondary table or right input), select your respondent funnel data source.
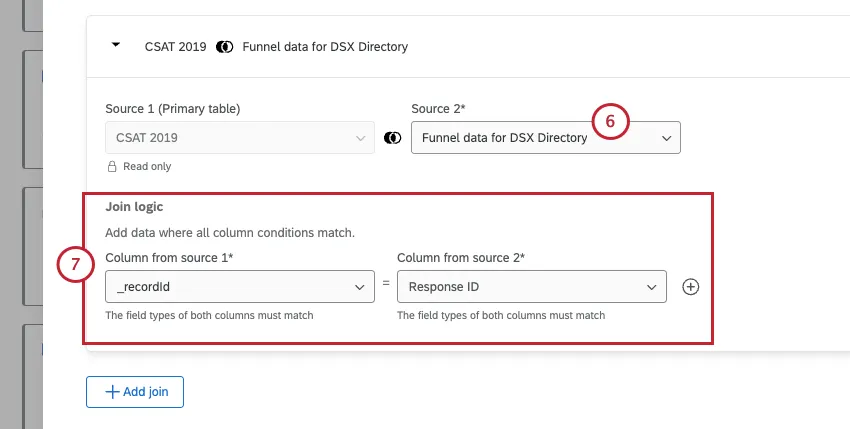
Under Join logic, the join key for the surveys should be _recordId, and for the respondent funnel should be Response ID.
When you’re finished, create your output dataset.
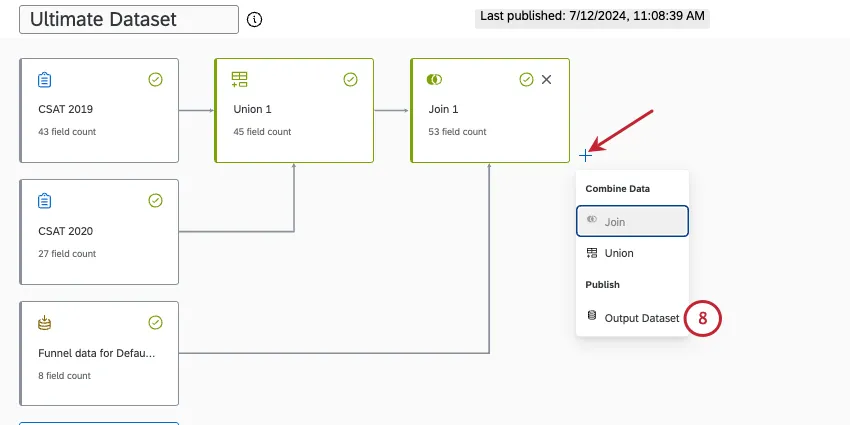
Publish your changes.
That's great! Thank you for your feedback!
Thank you for your feedback!