
Heat Map Visualization
Suite
Strategy & Research
Product
Qualtrics
What's on this page
About Heat Maps
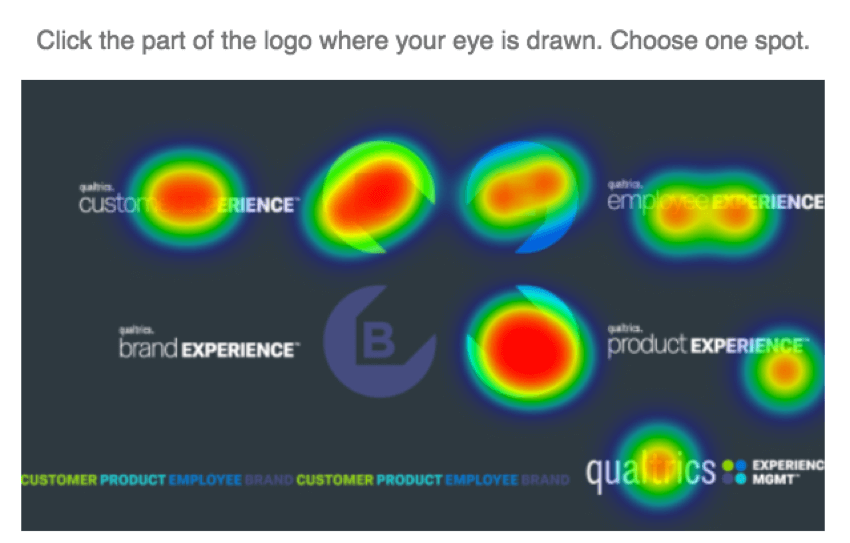
The Heat Map visualization is a representation of data collected for a Heat Map question. Colors are overlaid on the graphic so that the redder the area, the more respondents clicked that part of the graphic.

Qtip: If your Heat Map question has regions applied, you can view your region selection data in just about any other visualization, including Bar Charts, Results Tables, and Breakdown Bars.
Customization Options
For basic visualization instructions and customization, visit the Visualizations Overview support page. Continue reading for visualization-specific customization.
Heat Map visualizations have two unique options:
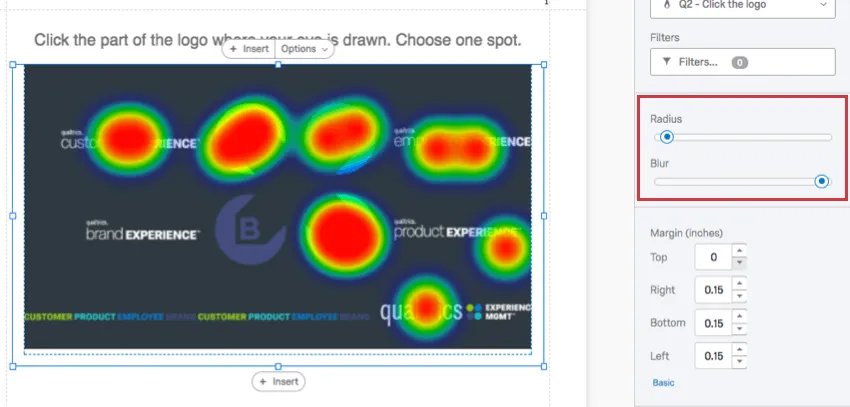
- Radius: Determine how widely the color should surround a frequently clicked area.
- Blur: Determine the number of pixels used to transition from one color to another. The less blur you apply, the more the most frequently touched parts of the image are overlaid with plain, red blocks.
Compatibility
Heat Map visualizations are only compatible with Heat Map questions. This also means this visualization can only be used in advanced-reports.
That's great! Thank you for your feedback!
Thank you for your feedback!