About Master Account Reports
Studio provides a set of reports on your Master Account usage. You can request that the following reports be emailed to you:
- Object Reports:
- Dashboard Sharing Report
- Widget Version Report
- Embedded Widget Report
- Metric Sharing Report
- Filter Sharing Report
- Alert Subscriptions Report
- User Reports:
- Permission Mapping Report
- Data Access Report
- Model Access Report
You can run Studio administrative reports to track account usage and activity using these supported widgets:
- Bar Widget
- Line Widget
- Table Widget
- Pie Widget
- Scatter Widget
- Heatmap Widget
Requesting Object and User Reports
Attention: A Manage Settings permission is required to access object and user reports.
Sign in to Studio.
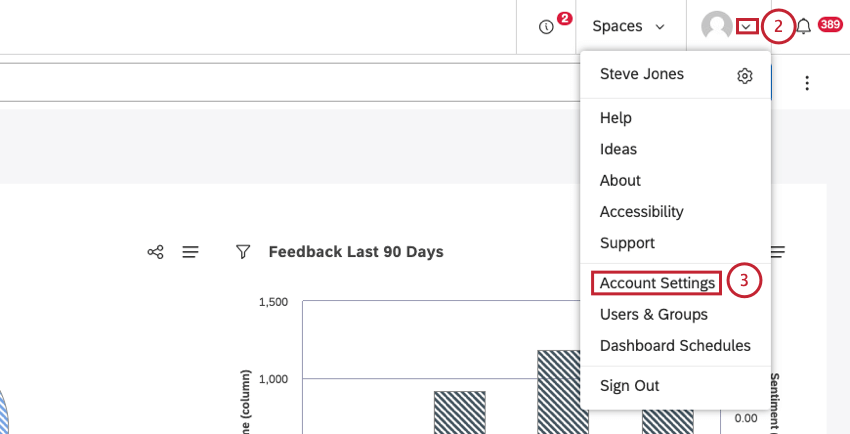
Expand the user avatar menu in the top navigation area.
Select Account Settings.
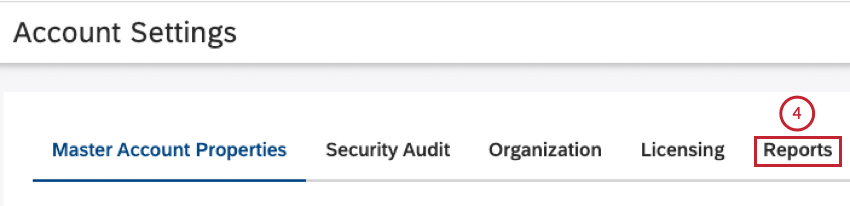
On the
Account Settings page, select the
Reports tab.
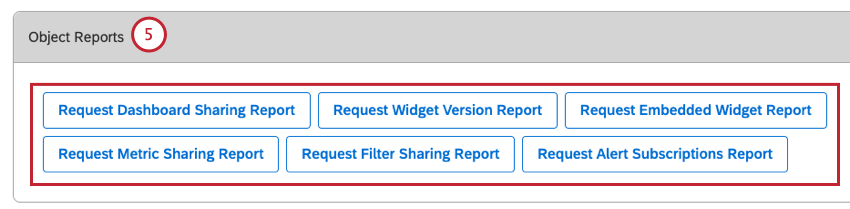
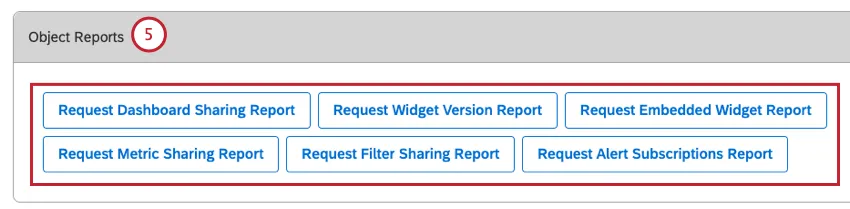
Under
Object Reports, click one of the following object report types:
- Request Dashboard Sharing Report
- Request Widget Version Report
- Request Embedded Widget Report
- Request Metric Sharing Report
- Request Filter Sharing Report
- Request Alert Subscriptions Report
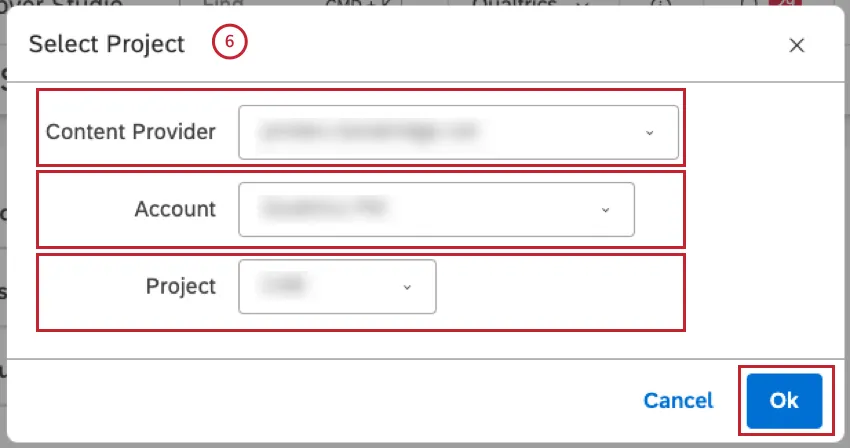
If you click
Request Alert Subscriptions Report, you will need to select the following options:
- Content Provider: choose your content provider.
- Account: choose the account to use.
- Project: choose the project to use.
- Click OK once finished.
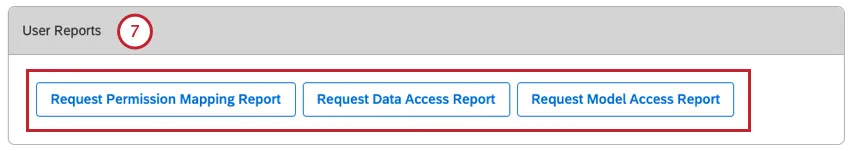
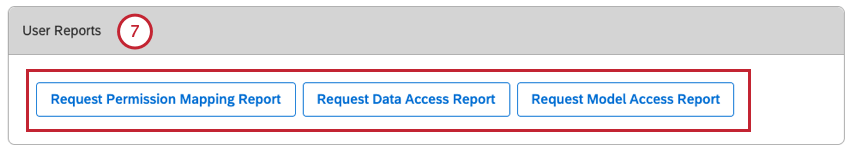
Under
User Reports, click one of the following user report types:
- Request Permission Mapping Report
- Request Data Access Report
- Request Model Access Report
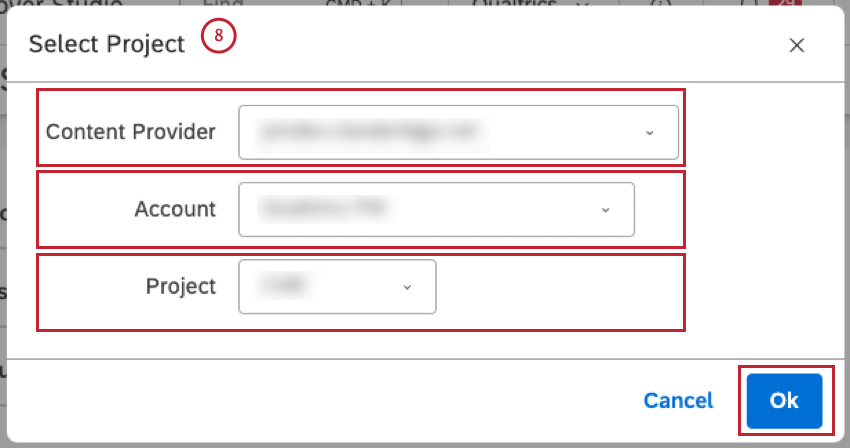
If you click Request Model Access Report, you will need to to select the following options:
- Content Provider: choose your content provider.
- Account: choose the account to use.
- Project: choose the project to use.
- Click OK once finished.
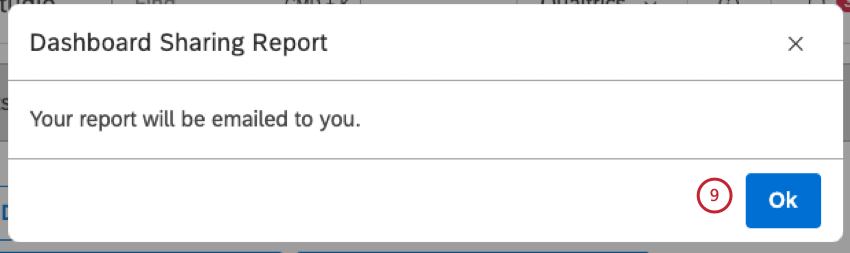
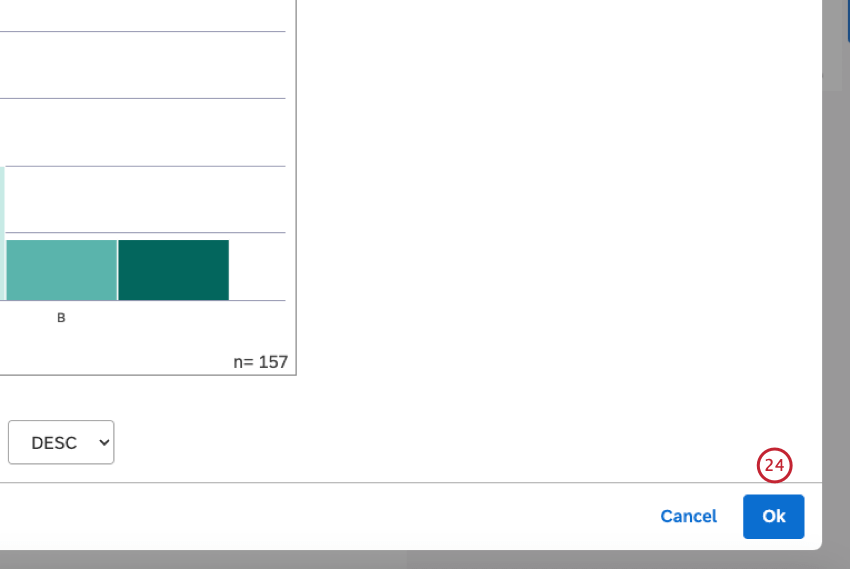
Click
Ok in the
Sharing Report window to confirm that the report will be emailed to you.
Wait until the report is emailed to you. This may take a couple of minutes.
Dashboard Sharing Report
The Dashboard Sharing Report provides an overview of the dashboards in your Master Account, as well as their owners and the users with whom the dashboards are shared.
The report is an Excel file that contains the following two sheets:
- Dashboard data sheet
- Book data sheet
Dashboard Data Sheet
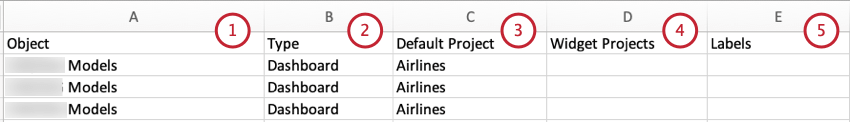
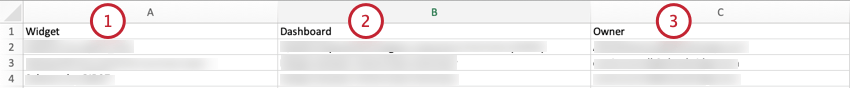
The dashboard data sheet contains the following information:
Object: The name of a dashboard or a book.
Type: Shows object’s type (dashboard or book).
Default Project: Shows the default content provider project selected in dashboard properties.
Widget Projects: Shows the content provider projects referenced by the dashboard’s widgets. Multiple projects are listed in alphabetical order, separated by semicolons.
Labels: Shows labels applied to an object. If no labels are added, this cell is empty.
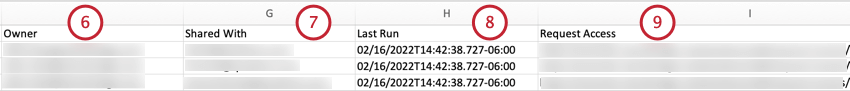
Owner: Owner’s email address. If the object is not shared, this cell is empty.
Shared With: Emails of all Studio users with whom the object is shared or Public if the object is shared with all Master Account users. If the object is not shared, this cell contains the owner’s email address.
Last Run: Shows the last time a dashboard or book was:
- Viewed or refreshed (manually or via a schedule)
- Exported to PDF (manually or via a schedule
Qtip: Use this to identify dashboards and books that are popular, and those that are not viewed at all.
Request Access: Use this link to request access to an object from its owner.
Qtip: You will be prompted to confirm the request only if you do not already have access to that object.
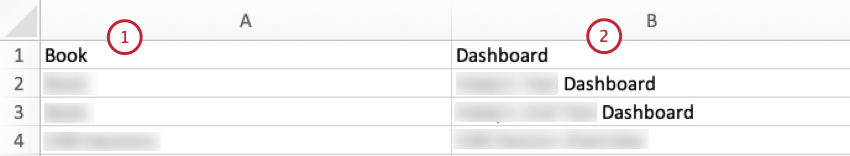
Book Data Sheet
The book data sheet contains the following columns:
Book: The name of a book.
Dashboard: The name of a dashboard that belongs to a book.
The Widget Version Report provides an overview of the dashboards in your Master Account that have any reporting widgets.
The report is an Excel spreadsheet that contains the following information:
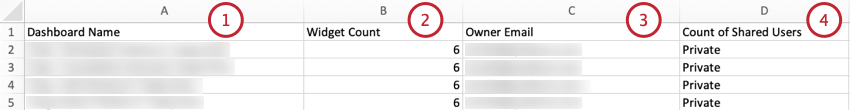
Dashboard Name: The name of the dashboard.
Widget Count: The number of reporting widgets in a dashboard.
Owner Email: Dashboard owner’s email address.
Count of Shared Users: The number of users with whom the dashboard is shared, Public if the dashboard is shared with everyone, or Private if the dashboard is not shared with anyone.
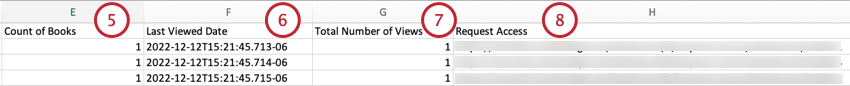
Count of Books: The number of books into which the dashboard is included.
Last Viewed Date: The date and time the dashboard was last viewed.
Total Number of Views: The total number of times the dashboard has been viewed.
Request Access: A link that lets you request access to a dashboard from its owner. You will be prompted to confirm the request only if you do not already have access to it.
The Embedded Widget Report provides an overview of widgets embedded in external tools. This report is available in Excel format.
Embedded Widget Report (Excel Version)
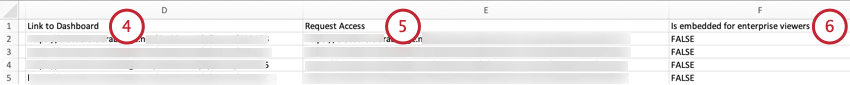
The Excel version spreadsheet contains the following information:
Widget: The name of the embedded widget.
Dashboard: The name of the dashboard.
Owner: ashboard owner’s email address.
Link to Dashboard: A link to open a dashboard.
Request Access: A link that lets you request access to a dashboard from its owner. You will be prompted to confirm the request only if you do not already have access to it.
Is embedded for enterprise viewers (Only for accounts with SSO): Indicates whether Enterprise viewers have access to the widget outside of Studio.
- TRUE: Enterprise users can view the widget outside of Studio.
- FALSE: Enterprise users cannot view the widget outside of Studio.
Embedded Widgets Module
The embedded widgets module enables you to view all embedded widgets within an account and manage these widgets.
Sign in to Studio.
Expand the user avatar menu in the top navigation area.
Select Account Settings.
On the
Account Settings page, select the
Reports tab.
Scroll down to the
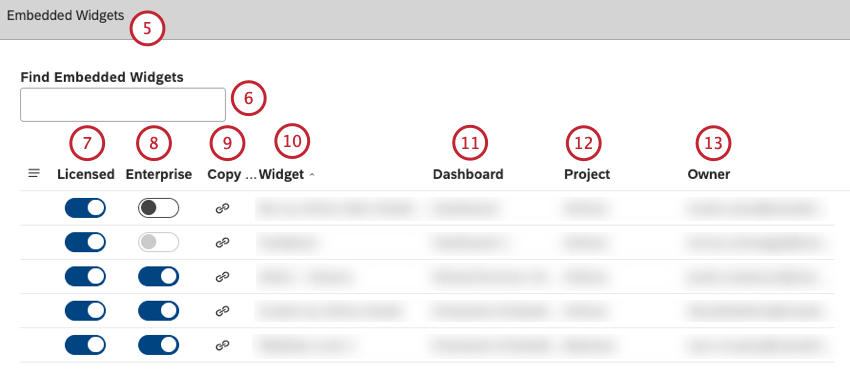
Embedded Widgets section.
You can enter the name of an embedded widget into the Find Embedded Widgets box to find an embedded widget.
Under the
Licensed column, you can toggle the switch to
On to allow licensed users to view and interact with a widget outside of Studio. Toggle the switch to
Off to not allow anyone to view the widget outside of Studio. Use this option to disable widget sharing via embedding.
Qtip: This switch controls whether Licensed viewers should have access to a widget outside of Studio.
Under the Enterprise column (available only for accounts with SSO), you can toggle the switch to On to allow Enterprise users to view a widget outside of Studio. Toggle the switch to Off to not allow Enterprise viewers to view a widget outside of Studio.
Under the Copy Link column, you can copy the embed code.
Under the Widget column, you can view the name of an embedded widget.
Under the Dashboard column, you can view the name of the dashboard in which the widget is embedded. Click the dashboard to open the dashboard.
Under the Project column, you can view the project on which the widget is based.
Under the Owner column, you can view the dashboard owner’s email address.
Metric Sharing Report
The Metric Sharing Report provides an overview of the metrics available in your Master Account, as well as their owners, labels, projects, type, and users with whom the metrics are shared.
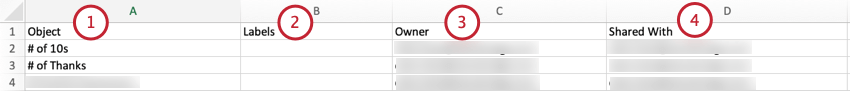
The report is an Excel file that contains the following information:
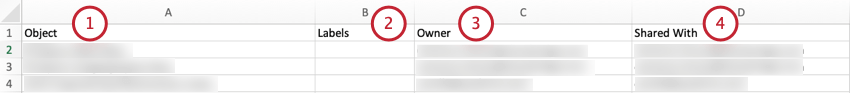
Object: The name of the metric.
Labels: Labels applied to the metric.
Owner: Owner’s email address.
Shared With: Shows with whom the metric is shared. The following options are possible:
- Emails of Studio users with whom the metric is shared individually.
- Names of Studio groups or Public if the metric is shared with all Master Account users.
- Owner’s email address indicates that the metric is not shared.
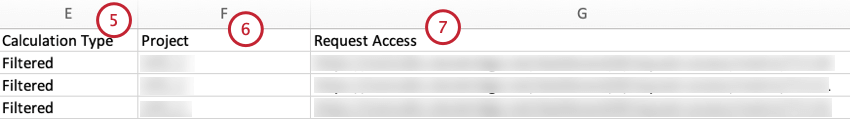
Calculation Type: The type of the metric.
Project: The name of the project to which the metric belongs.
Request Access: A link that lets you request access to a metric from its owner. You will be prompted to confirm the request only if you do not already have access to that metric.
Filter Sharing Report
The Filter Sharing Report provides an overview of the filters available in your Master Account, as well as their owners, labels, projects, and users with whom the filters are shared.
The report is an Excel file that contains the following information:
Object: The name of the filter.
Labels: Labels applied to the filter.
Owner: Owner’s email address.
Shared With: Shows with whom the filter is shared. The following options are possible:
- Emails of Studio users with whom the filter is shared individually.
- Names of Studio groups or Public if the filter is shared with all Master Account users.
- Owner’s email address indicates that the filter is not shared.
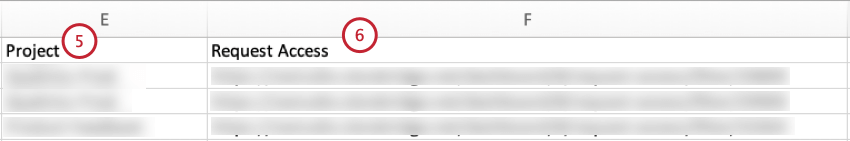
Project: The name of the project to which the filter belongs.
Request Access: A link that lets you request access to a filter from its owner. You will be prompted to confirm the request only if you do not already have access to that filter.
Alert Subscriptions Report
The Alert Subscriptions Report provides an overview of new verbatim and scorecard alerts, as well as groups subscribed to each alert. Use this report to ensure alerts are delivered to the appropriate stakeholders.
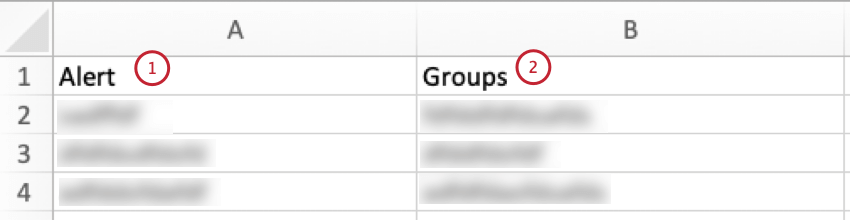
The report is an Excel file that contains the following information:
Alert: The name of the alert.
Groups: A list of all groups subscribed to the alert. Each group is displayed in a separate column.
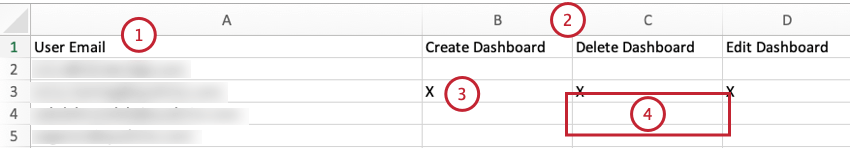
Permission Mapping Report
The Permission Mapping Report provides a map of users of your Master Account and their derived permissions.
The report is an Excel file that contains the following information:
User Email: The email address of the user.
Permissions: A map of Studio permissions. This map covers the sum of all user’s permissions (user-level and group-level).
The permissions available to the user are marked with an X.
If a cell is empty, permission is not granted.
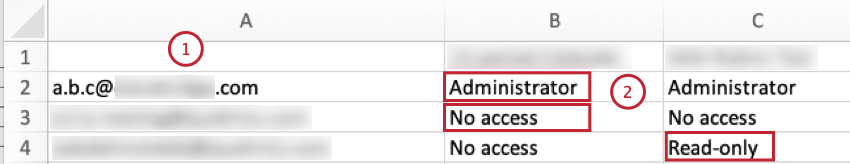
Data Access Report
The Data Access Report provides a map of users of your Master Account and their data access levels.
The report is an Excel file that contains the following columns:
User Email: The email address of the user.
A map of all projects from the content provider’s account to which the user is linked and that user’s corresponding data access level.
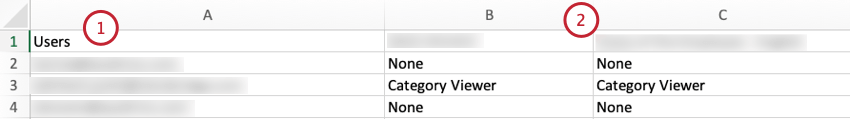
Model Access Report
The Model Access Report provides a map of project users and their category model access levels. You can use this report to do the following:
- Get the point-in-time category model access for an entire project.
- Identify users that have inappropriate access for easier updates.
- Save the snapshot offline for future use.
The report is an Excel spreadsheet that contains the following columns:
Users: The email of the user.
A map of all category models in the selected project and each user’s corresponding model access level.
Studio Administrative Reporting
Attention:To create and edit administrative reports, a user needs to meet all the following requirements:
- Have one of the power user accounts (Internal XM Discover User, Account Administrator, or Account Owner).
- Have a Conduct Security Audit permission and full administrative rights to data in the corresponding Content Provider.
Regular users can view administrative reports in a dashboard, but cannot create or edit them.
Administrative reporting provides greater visibility into usage, actions, and activity in your Studio workspace. It allows you to dig into security logs via personalized dashboards to answer some of the following questions:
- Which dashboards get the most traffic?
- Who is logging in and when?
- Who is editing which production dashboards?
- Which users are exporting data from the system and how often?
Supported Widgets for Studio Administrative Reporting
You can use the following widgets in administrative reports:
Running Studio Administrative Reports
Administrative reporting dashboards use the Studio Admin project to access the security audit log, and by default, dashboard date filters are set to Last 24 hours, Last 3 days, Last 7 days, Last 30 days, and Last 90 days.
Sign in to Studio.
Create a dashboard to be used for administrative reporting using one of the dashboard templates from the
Admin Reporting folder.
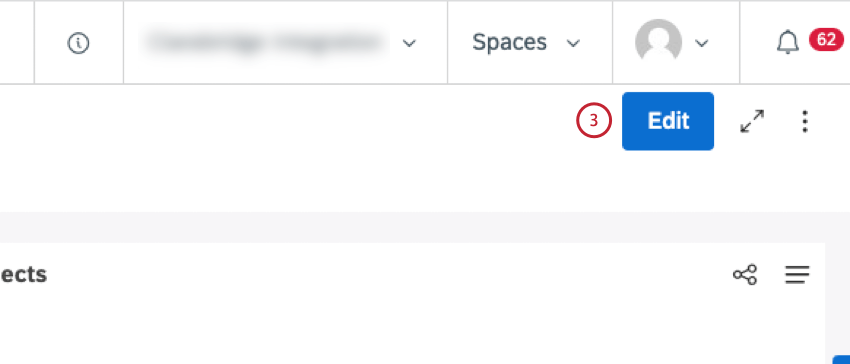
With the dashboard open, click
Edit.
Add one of the supported widgets.
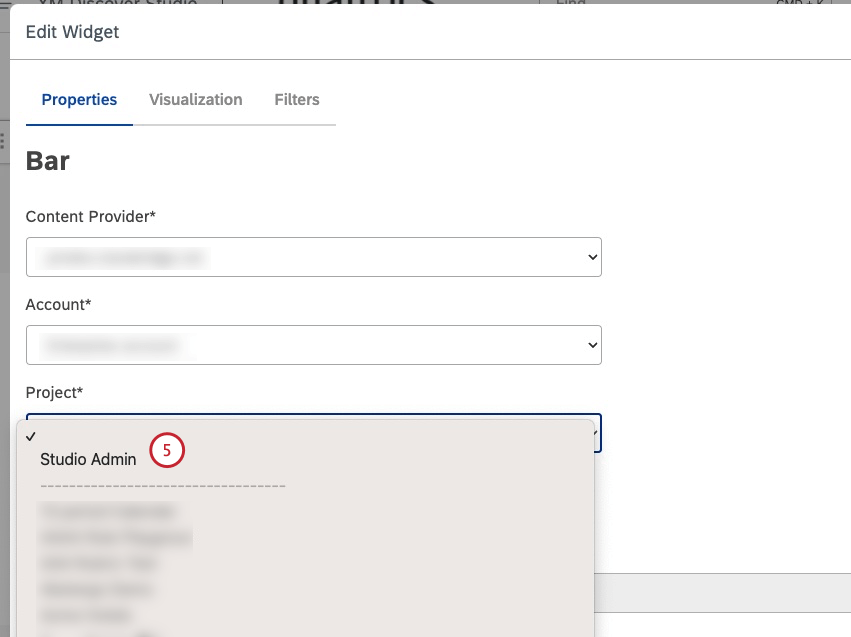
In the
Edit Widget window, select the
Studio Admin project from the
Project menu in the
Properties tab.
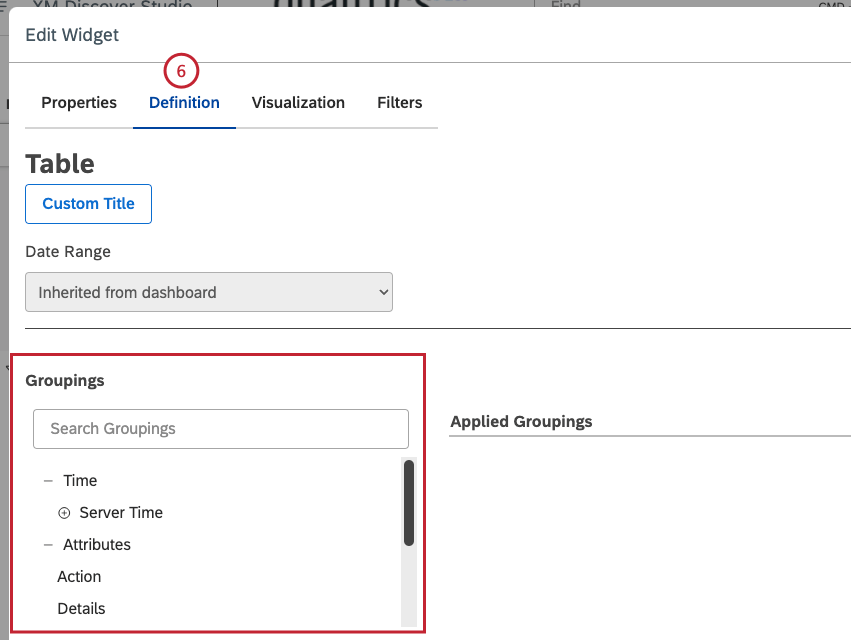
For the table widget, select the
Definition tab.
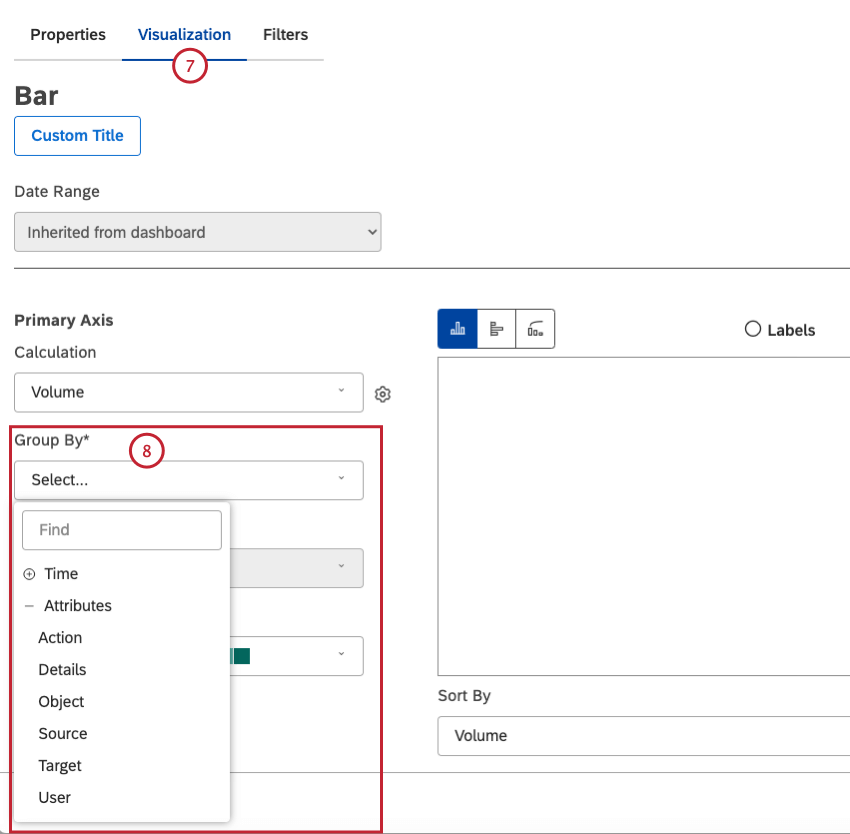
For other reporting widgets, select the
Visualization tab.
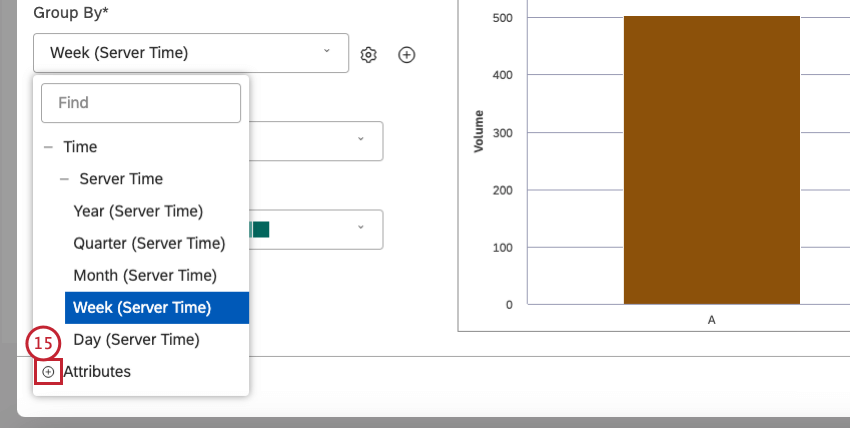
You can select up to 7 groupings to report on from the following options: Time, Action, Details, Object, Source, Target and User.
Select
Time from the
Group by menu to group data by time.
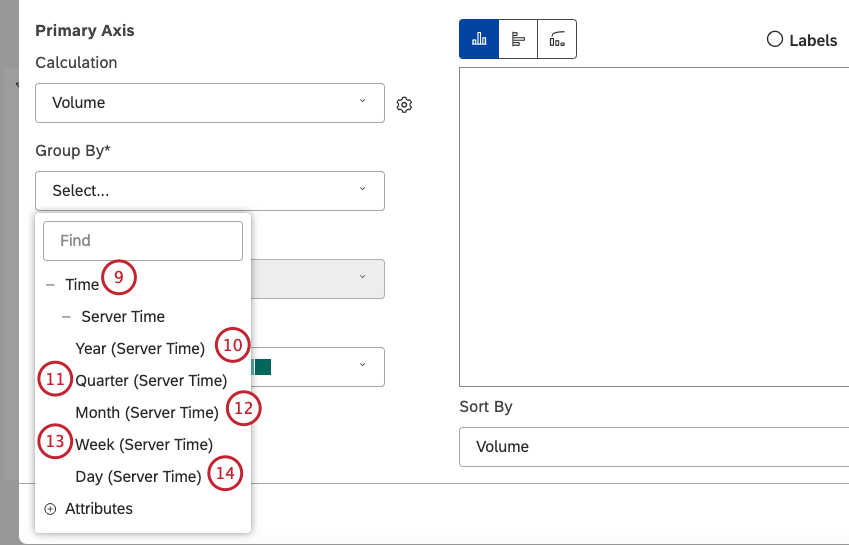
To choose how you want to display time, select Year (Server Time) to display values as [YYYY].
Select Quarter (Server Time) to display values as [YYYY]-Q[Q] where YYYY is the year and Q is the quarter.
Select Month (Server Time) to display values as [YYYY]-M[MM] where YYYY is the year and MM is the month.
Select Week (Server Time) to display values as [YYYY]-W[WW] where YYYY is the year and WW is the week.
Select Day (Server Time) to display values as [MMM]-[DD]-[YYYY].
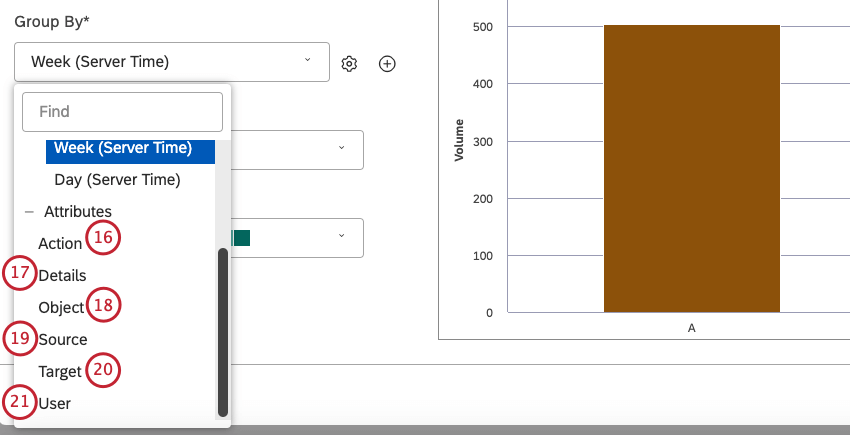
Click the plus (
+ ) icon to expand the
Attributes menu.
Select
Action to Group data by the actions performed in Studio. See Actions Logged for details.
Select
Details to group events by their details.
Example: Compare how many times users were updated individually versus updated via bulk.
Select Object to group data by the object on which the action is performed. Example: When someone renames a dashboard from Dashboard Explorer, its old name is the Object, and new name is the Target).
Select Source to see where events come from.
Select Target to group data by the target of the action.
Select User to group data by the user who performed the action.
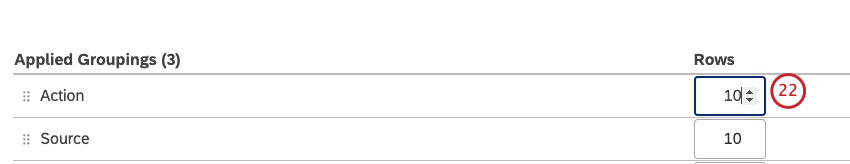
For the table widget, for all groupings except Time, click the
Up and
Down arrows next to the rows number to adjust the number of rows to display in the
Rows column.
Qtip: You can display up to 3,000 rows per grouping.
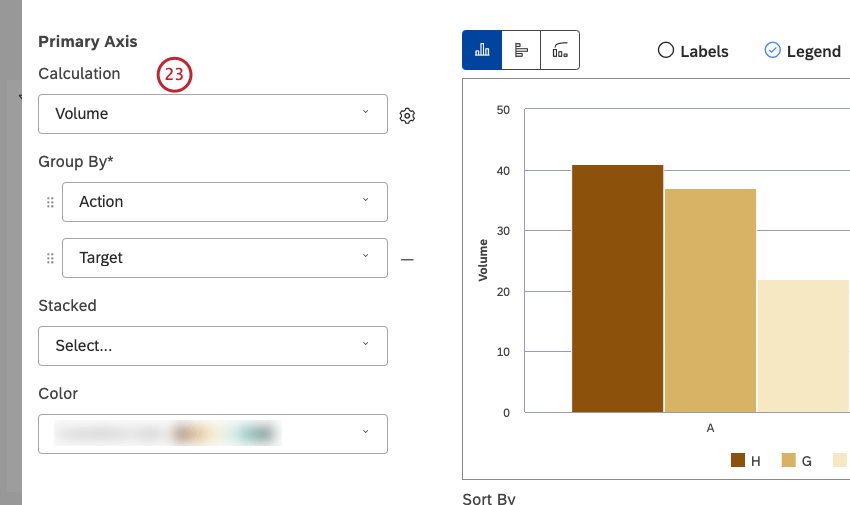
Select
Volume as a calculation.
Click
Ok at the bottom right of the
Edit Widget window to run the report.
Studio Administrative Reports Examples
Below are some examples of administrative reports you can run depending on what you want to learn.
Who are the most active users?
Group your report by User.
Qtip: Compare team sign-ins by member in a Bar graph or analyze the volume of sign-ins by team member and tenure in a Scatter graph.
Which dashboards are most viewed?
Group your report by Object.
Group your report by This step is optional.
In the Filters tab, set the Action to DashboardViewEvent.
What are the most common actions for my team?
Group your report by Action.
In the Filters tab, set the User to the members of your team. Alternatively, you can filter by User Type to look at segments of users.
How often are users logging into Studio?
Group your report by User.
In the
Filters tab, set the
Action to
UserLogInEvent.
Qtip: Compare overall team sign-ins over time in a Line graph.
Which external websites are most often used to embed Studio widgets?
Group your report by Target.
In the Filters tab, set the Action to EmbedViewEvent.
