
Understanding Your Response Dataset (EX)
What's on this page
Attention: Many links on this page link back to pages regarding standard Qualtrics surveys, not just Employee Experience projects. Detailed below are the differences you will need to be aware of on each page. While some content may look slightly different when creating your Employee Experience project, feature functionality remains the same.
Qtip: This page describes functionality available to Engagement, Lifecycle, Pulse, and Ad Hoc Employee Research projects. For more details on each, see Types of Employee Experience Projects.
About “Understanding Your Response Dataset”
For additional analysis outside of Qualtrics, you can download a dataset file for any Employee Experience project. This dataset includes all your survey’s raw response data, including question responses, participant information, and more.
Every row of the file represents a different response to the survey.
Attention: The file referenced in this page was downloaded in the CSV format and is opened in Excel. It has also been formatted using the Excel Wrap Text feature for easier reading. Other file formats include the same data points, but may display the contents with a slightly different layout.
File Format Basics
Every row of the file is a different survey response (although not necessarily different respondents, if you are running a Lifecycle project and chose to let people answer multiple times). Every column is a type of survey data.
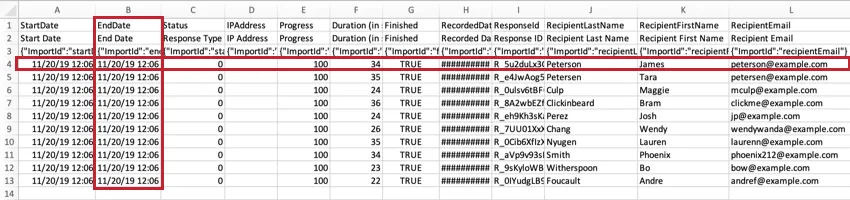
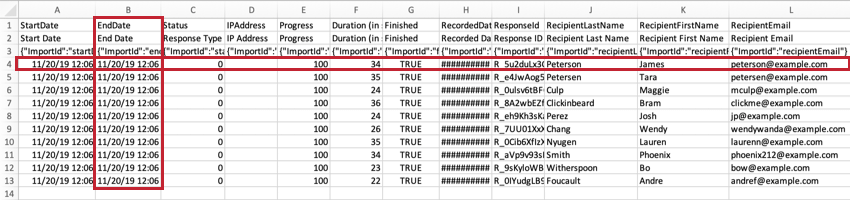
CSV and TSV files come with 3 rows of headers. The first header is the internal Qualtrics ID of the field (e.g., EndDate, Q1, Q2, and so on). The second header is the field’s name or text (e.g., End Date, How satisfied are you with Qualtrics?). The third header has import IDs. All 3 of these headers are included because they are needed to upload the data to a survey. Respondent data starts on the fourth row of the file.
Qtip: Based on the file format you downloaded (SPSS, Excel, etc.), you may see different headers. See Export Formats for more information on the formats available.
Participant Information
StartDate and EndDate
The StartDate column indicates when the participants first clicked the survey link. The EndDate column indicates when the participants submitted their survey. If the entry is an incomplete response, this date will indicate the last time the participant interacted with the survey.
Qtip: If your Start Date and End Date columns in Excel contain ######, try making the columns wider. Excel uses # symbols when a date won’t fit.
Status
The value in the Status column indicates the type of response collected. There are three main possible statuses:
- 32 / EX: A normal response
- 36 / Imported: An imported response
Qtip: Old files may also have the codes 40, relating to Spam. All Spam statuses have been deprecated. For better tools that will help you identify spam, check out Fraud Detection and Response Quality.
IPAddress
This column includes the subject’s IP address.
Finished and Progress
This Finished column details whether the response was submitted or closed. A “1” or “TRUE” indicates the participant reached an end point in their survey (e.g., hitting the last Next/Submit button, being screened-out with Skip or Branch Logic, etc.). A “0” or “FALSE” indicates the participant left their survey before reaching an end point and the response was instead closed manually or due to session expiration.
The Progress column shows the progress a participant made in the survey before finishing. For those marked as “1” or “TRUE” in the Finished column, the Progress is marked 100, regardless of whether they were screened out. For those whose responses are marked “0” or “FALSE,” you will get an exact percentage of how far they got in the survey based on what question they left off on.
Duration
The number of seconds it took the respondent to complete the survey. This is the entire duration of the response; if a respondent stops in the middle of the survey, closes the browser, and comes back another day, that time is counted.
Qtip: While the export measures duration in seconds, in the Data tab this field is displayed in hours:minutes:seconds.
Recorded Date
This column indicates when a survey was recorded in Qualtrics. For users taking surveys online, this date and time will be very similar to End Date. However, for responses that are imported, Recorded Date will often differ from End Date, instead reflecting when you manually uploaded the results, not when the survey taker finished.
Qtip: Noticing a difference of several minutes between End Date and Recorded Date? A slow internet connection can delay the time between when the participant submits their survey data and when Qualtrics officially saves it to the website.
ResponseID
The ResponseID is the ID Qualtrics uses to identify each response in the database. This identifier is provided as a reference and generally does not have a use in data analysis.
LocationLatitude and LocationLongitude
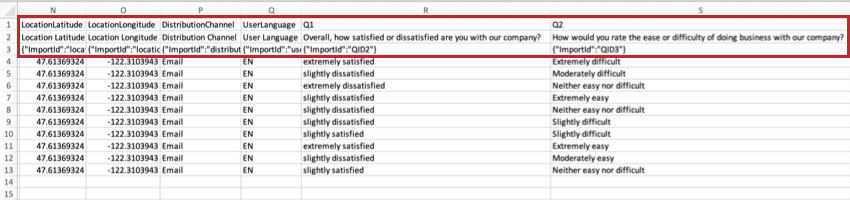
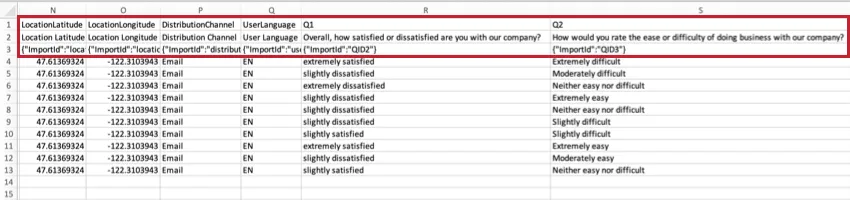
The location is an approximation determined by comparing the evaluator’s IP address to a location database. Inside the United States, this data is typically accurate to the city level. Outside the United States, this data is typically only accurate to the country level.
Qtip: A response must be complete in order to record GeoIP data and thus calculate a latitude and longitude. Incomplete responses will not contain a latitude or longitude.
Qtip: Latitude and longitude data values are based on city/zip code and cannot be used to identify a specific location or individual.
Metadata and Embedded Data
Any metadata saved to your participants and embedded data saved to responses will appear as data columns.
Only embedded data fields saved in the survey flow are included in the downloaded dataset.
Qtip: Curious about the Q_DataPolicyViolations column? See Sensitive Data Policy. Not every license has sensitive data policies enabled, so if this column is blank, don’t worry.
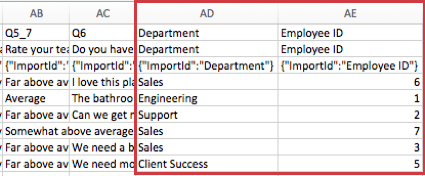
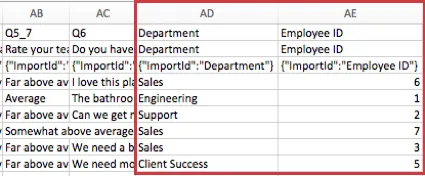
ParticipantName, ParticipantEmail, ParticipantUniqueIdentifier, and Parent Unit
The participant’s name appears in the Participant Name column in Last name, First name format. The participant’s email address appears in the Participant Email column. The ParticipantUniqueIdentifier is the participant’s unique ID.
The Parent Unit column contains the location of the participant in your company hierarchy. This will appear as the unit or manager name. This does not appear in Lifecycle or Ad Hoc Employee Research project exports, just Engagement exports.
Last Metadata Update Timestamp
The date and time the metadata was last updated. This time is shown in GMT (UTC+0), not your account’s time zone.
This column may also be called “Timestamp Of Last Metadata Update.”
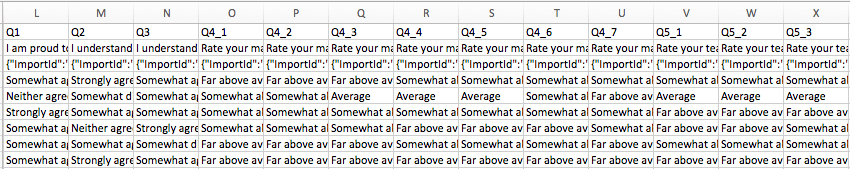
Question Responses
Columns are headed with the question labels (Q1, Q2, etc.) and the beginning lines of the question text.
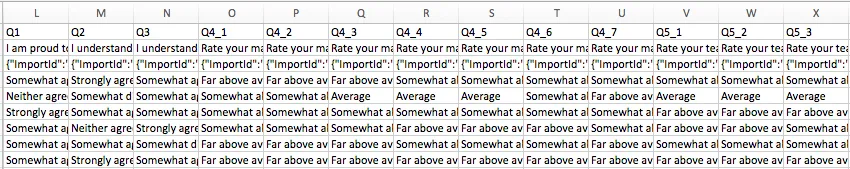
Question data is formatted the same in survey projects. See Question Responses for more detail on how this data is formatted.
Randomization Data
If you randomized blocks or questions in your survey, then you’ll have randomization data available in your dataset.
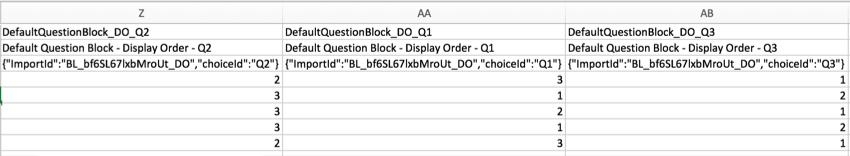
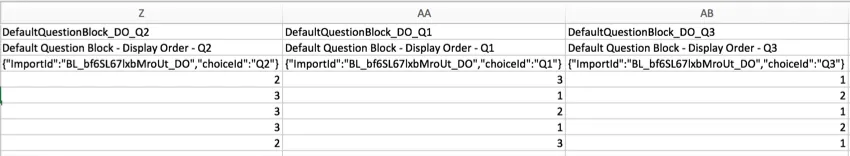
Data from randomized 360 projects is formatted the same as it is in survey projects. See Randomization Data for more detail on how to understand this data.
File Format Differences
Though all file types download the same data fields described above, each features a layout that may be slightly different. These are much the same as the the file formats available for the Survey Platform, so read the support page on different file types for Survey Platform exports for more detailed information.
That's great! Thank you for your feedback!
Thank you for your feedback!