
BX Program Best Practices
What's on this page
About BX Program Best Practices
BX Programs let you conduct a comprehensive, ongoing assessment of the health of your brand compared with your key competitors. BX surveys create the data that is used to generate the brand tracker data source, a stacked dataset that makes the BX analytic tools and dashboard more robust. It is important to program your survey specifically so that it is compatible with creating a brand tracker data source.
Qtip: The Setup Assistant walks you through the creation of your BX program and provides a template for the survey. If you customize the survey beyond what is suggested, be aware that survey fields required for the BTDS may not be automatically generated.
Attention: BX Programs are much bigger and more complex than standard survey projects. We recommend using the preview link to ensure all of the elements are working properly. Additionally, we recommend conducting a “soft launch” by sending the program to a small population (e.g., 10% of your sample size) and then reviewing your data.
Qtip: BX programs are typically conducted by the Qualtrics Implementations team or a third-party implementations partner. If you have questions about your implementation, please reach out to your Technical Success Manager.
Survey Structure
Warning: If you are using a BX study built by the Qualtrics Implementation team or a third party implementation team, do not make any unauthorized changes to the survey builder or the survey flow, as this can invalidate the data collected.
Most BX surveys follow the same basic structure designed to provide reliable responses and measure key metrics.
Qtip: Demographics data can be used to ensure that the sample of respondents is representative of the population you would like to study.
We recommend following these best practices when editing your survey content and structure.
- Use standard question types (single select, multi-select, or text entry) whenever possible. Have a clear plan for how you are going to map the data for any other types of questions.
- Avoid setups where respondents can answer the same question container for different content. For example, using one question to ask respondents to provide context on a randomly selected brand.
- Consider what filters you’d like to use on your dashboard and include ways to capture that information. For example, if you need to filter by age groups, be sure to create an age group embedded data variable.
- Consider what date ranges will be most relevant in your reporting. It’s common to create a “wave_date” embedded data field to capture the most relevant fielding period information in order to filter or bucket in dashboards. Qtip: Fielding periods may not align with the Recorded Date or End Date fields, which is why the “wave_date” field is helpful for reporting. For example, your April wave might need to include some respondents from the beginning of May.

- Consider any custom variables that might be needed, and set them up using embedded data.
Qtip: We recommend grouping elements in the survey flow to keep logic organized and easier to troubleshoot.
Programming Principles
In order to generate a Brand Tracker Data Source (BTDS) with your program, certain additional programming considerations are required:
Reusable Choice List
The full brand list for the entire survey should be entered as a Reusable Choice List. The brand names throughout the rest of the survey must be identical matches to the names entered in the Reusable Choice List. For more information, see the support page linked.
Qtip: Options like “Other”, “NA”, or “None” should not be included in the reusable choice list, but can be included in actual survey questions.
Attention: Brand names cannot exceed 35 characters.
Question and Answer Text
For questions repeated for each brand (also known as brand-led questions), the question label (e.g., “NPS_brandX”) and question text (e.g., “How likely are you to recommend [brand X] to a friend or colleague?”) should be consistent.
For questions with brands as the answer choices, make sure to set the Variable Name as the brand in the reusable choice list if the answer choice text is different than the brand name (e.g., if there is HTML for an image or additional text).
Parallel Survey Blocks
A Parallel Survey Block is when a series of questions about a single brand is grouped together in a survey block, and there is a survey block for each brand. Each block name should follow the same naming pattern, which will cause the questions within them to be considered parallel. Qualtrics will stack parallel questions together.
Example: Let’s say you want to make blocks that ask about barriers to purchasing brands. If you name each block “Barriers – [Brand Name]” (e.g. “Barriers – Best Breakfast”, “Barriers – Healthy Cereal”), the machine algorithm will consider these blocks parallel and stack questions together. If blocks have different naming conventions (e.g. “Barriers – Best Breakfast”, “Barriers – Healthy Cereal (kids)”), the machine algorithm will not consider the blocks parallel and might not stack them.
Stacking Embedded Data
By default, embedded data fields will not be stacked. However, stacking embedded data fields is often necessary for custom brand variables that compute and measure brand data.
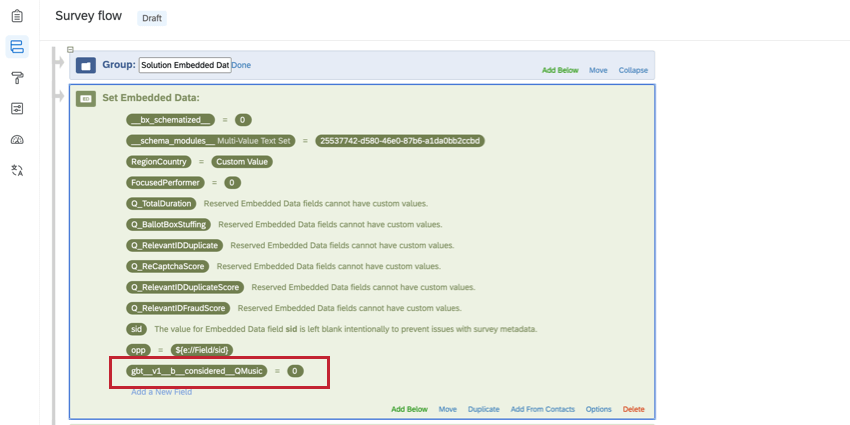
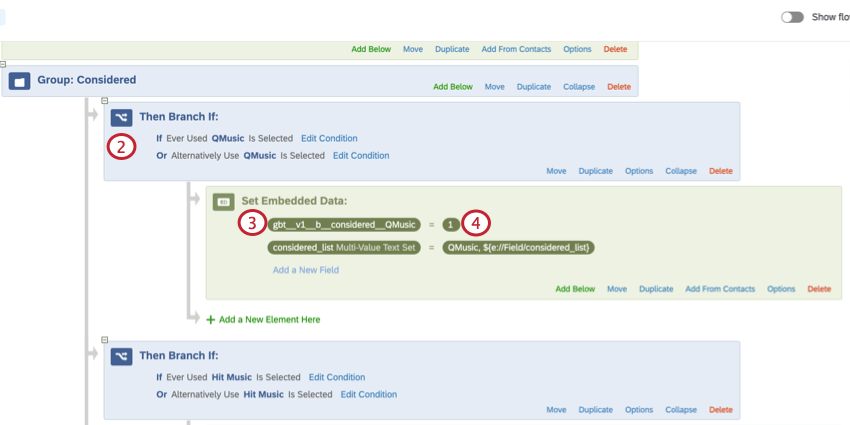
Stacked embedded data fields should be added to the top of the survey flow with the value “0” and the following naming convention:
gbt__v1__[Stack Type]__[Column Name]__[Brand Name] Example: You might want to define “consideration” as whether a respondent has ever used the brand or would use the brand if their preferred one is not available. Creating a stacked embedded data variable allows you to combine both of those conditions into one field you can use in your dashboard filters and widgets.
See the sections below for more information on creating your stacked embedded data variable.
Stack Type
The stack type refers to the type of variable that is being referenced for this Embedded Data. There are two stack types:
- Binary (b): The variable only has two potential values. For example, for the variable “Consideration”, a brand either is considered (1) or is not considered (0).
- Normal (n): The variable has an unlimited number of numeric options, and contains either a computed value or the value that a respondent has selected for a question.
| Stack Type | Example Format | Example Use Cases |
|---|---|---|
| b (binary) | gbt__v1__b__Consideration__QMusic | Favorite, Computed Consideration |
| n (normal) | gbt__v1__n__Share of Wallet__QMusic | Brand Equity, Share of Wallet |
Column Name
The column name is what you want to appear as the embedded data variable in the BTDS.
| Stack Type | Example Format | Example Use Cases |
|---|---|---|
| b (binary) | gbt__v1__b__Consideration__QMusic | Favorite, Computed Consideration |
| n (normal) | gbt__v1__n__Share of Wallet__QMusic | Brand Equity, Share of Wallet |
Brand Name
The brand name indicates which brand the data in the variable is referring to.
Attention: Brand names must match the corresponding brand in the reusable choice list. If the brand names do not match completely, the data will not stack correctly. This includes special characters such as spaces, apostrophes, hyphens, etc.
| Stack Type | Example Format | Example Use Cases |
|---|---|---|
| b (binary) | gbt__v1__b__Consideration__QMusic | Favorite, Computed Consideration |
| n (normal) | gbt__v1__n__Share of Wallet__QMusic | Brand Equity, Share of Wallet |
Autocoded Unaided Awareness
Unaided Awareness measures which brands come to mind when you mention a specific category (e.g., “When you think of [category], which brand comes to mind first?”). Autocoded Unaided Awareness (AUA) ensures that variations in spelling, capitalization, or common acronyms are corrected so that we can properly group the data. This is done by creating a web service in the survey flow.
Qtip: If you are interested in setting up Autocoded Unaided Awareness, reach out to your implementation partner.
The AUA web service looks at the open text data entered and compares it to a Brand Dictionary that you create. If the entry is similar to a brand name within a small number of character deviations, the web service recodes the entry to match the Brand Dictionary.
Example: Let’s say we have a brand list that contains “Qualtrics”. With AUA enabled, any variations of Qualtrics (e.g., “Quatrlics”) will be recoded as “Qualtrics”. However, if a respondent entered “QXM”, this would not be included since it is not a variation of “Qualtrics”.
Qtip: Why use AUA instead of Text iQ?
- AUA is handles proper nouns and names, whereas Text iQ is focused on common language terms and grammatical structures in longer form text entries.
- AUA recodes text responses in real-time during the survey session, so you do not need to wait for any processing to see the values. You can also use the results in survey logic, if needed.
- You can stack AUA results in order to leverage significance testing and other analytic options throughout Qualtrics’ analysis and dashboards.
AUA DETAILS
- Only languages supported by the Qualtrics platform are compatible with AUA. Custom languages are not supported.
- A given brand can have several entries included (e.g., “Qualtrics” could include entries for “Qualtrics”, “Qualtrics Software”, “Qualtrics Research”, and “Qualtrics XM” to ensure variations of all of these are recoded as just “Qualtrics”).
- The length of the brand name influences how far off the respondent’s spelling can be from a brand entry in the Brand Dictionary.
- Responses that are 3 characters or less are not allowed any deviations and must exactly match the Brand entry. For example, “Ivy” would need to be exactly spelled as “Ivy”.
- Responses that are 4 characters are allowed one deviation. For example, “QHub” would accept variations like “Qub” and “QHb”.
- Responses that are 5 characters are allowed two deviations. For example, “Flanel” would accept variations like “Flannel” or “Flnl”.
- Responses that are 6+ characters are allowed three deviations. For example, “BeatDrop” would accept variations like “BeatD” or “BetDrp”.
Qtip: If you would like to review or update your Brand Dictionary, please work with your implementation partner.
Brand Equity, Share of Wallet, and Opportunity Gap
Qtip: If you are interested in setting up Brand Equity, Share of Wallet, or the Opportunity Gap analyses, reach out to your implementation partner.
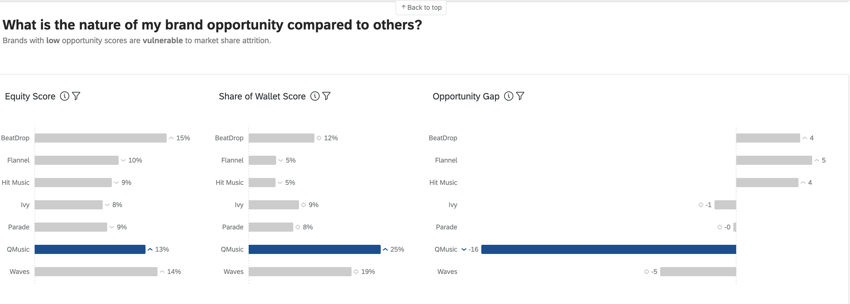
Brand Equity, Share of Wallet, and Opportunity Gap metrics are used in BX Dashboards to provide advanced insights on brand performance.
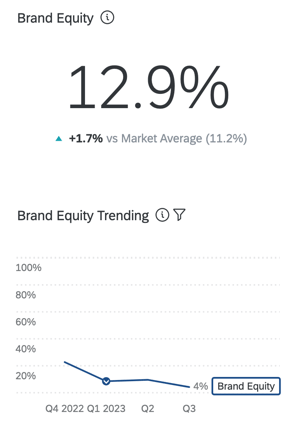
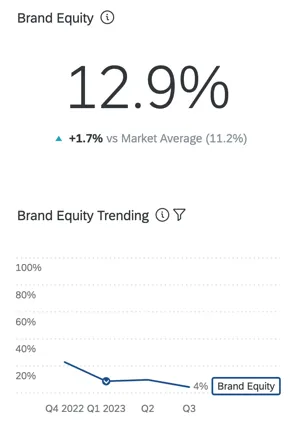
BRAND EQUITY
Brand attitudinal equity measures which brand consumers would choose if there were no barriers to purchasing or using a product. When viewed in aggregate, brand attitudinal equity reflects the expected market share of your brand. This is a percentage that should total 100 (e.g., 75% of consumers would purchase my brand if they could, but 25% would prefer to purchase [x] brand).
Its approach is simple and requires only a few questions (ownership, consideration, and brand rating). Relative brand ratings are transformed into “ranks” and then into “predicted share.” These measures have a strong correlation with behaviors.
Qtip: Brand attitudinal equity is calculated in a BX survey by creating a web service in the survey flow.
Qtip: There are many conceptualizations of brand equity, and the Qualtrics approach is called brand attitudinal equity. This conceptualization is available in the public domain and has been validated extensively.
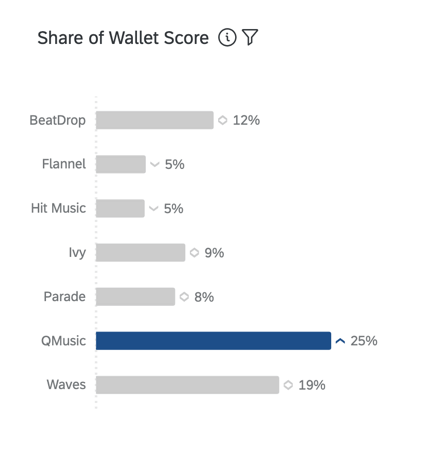
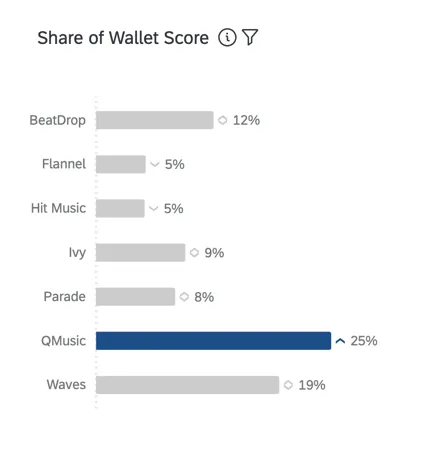
SHARE OF WALLET, OR ESTIMATED MARKET SHARE
Share of wallet, also known as “estimated market share”, measures how much of the respondents’ recent usage is attributed to each brand. This is generally a percentage that should total 100 (e.g., in the last 6 months, 75% of my [category] purchases have been with [x] brand and 25% with [y] brand).
Qtip: Share of wallet is calculated in a BX survey by creating a math operation in the survey flow.
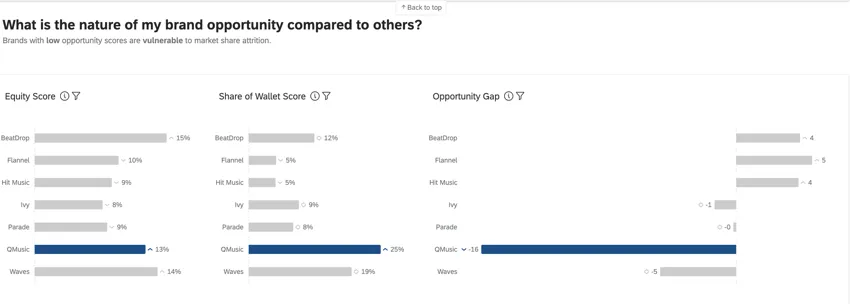
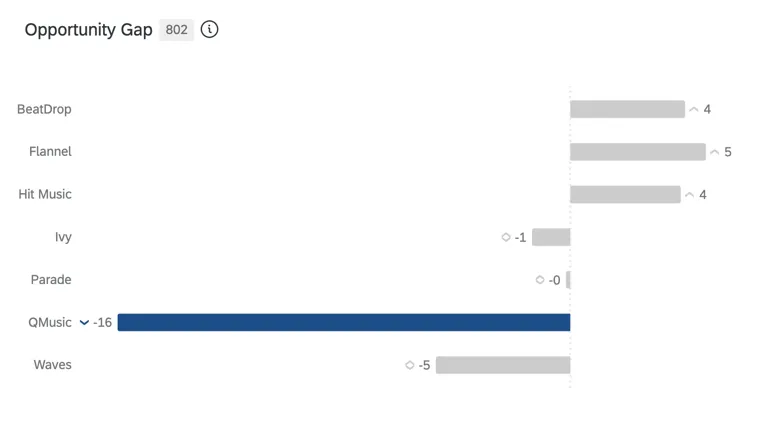
OPPORTUNITY GAP
Opportunity gap is the difference between your brand attitudinal equity and estimated market share—in other words, the gap between the desire for your brand and actual purchase behavior. Opportunity exists when equity is greater than share (positive scores) and vulnerability is present when equity is less than share (negative scores).
Qtip: Opportunity gap is calculated in a BX survey by creating a math operation in the survey flow.
That's great! Thank you for your feedback!
Thank you for your feedback!