
Report Visualizations (Designer)
What's on this page
Attention: Reports in Designer are for exploratory purposes only, and all insights packages have been deprecated. Please use Studio for the most accurate reporting.
About Report Visualizations
Report visualizations determine how your data will be displayed in your report. Some visualizations have additional customization options. For information on report types and which visualization each one is compatible with, see Report Types.
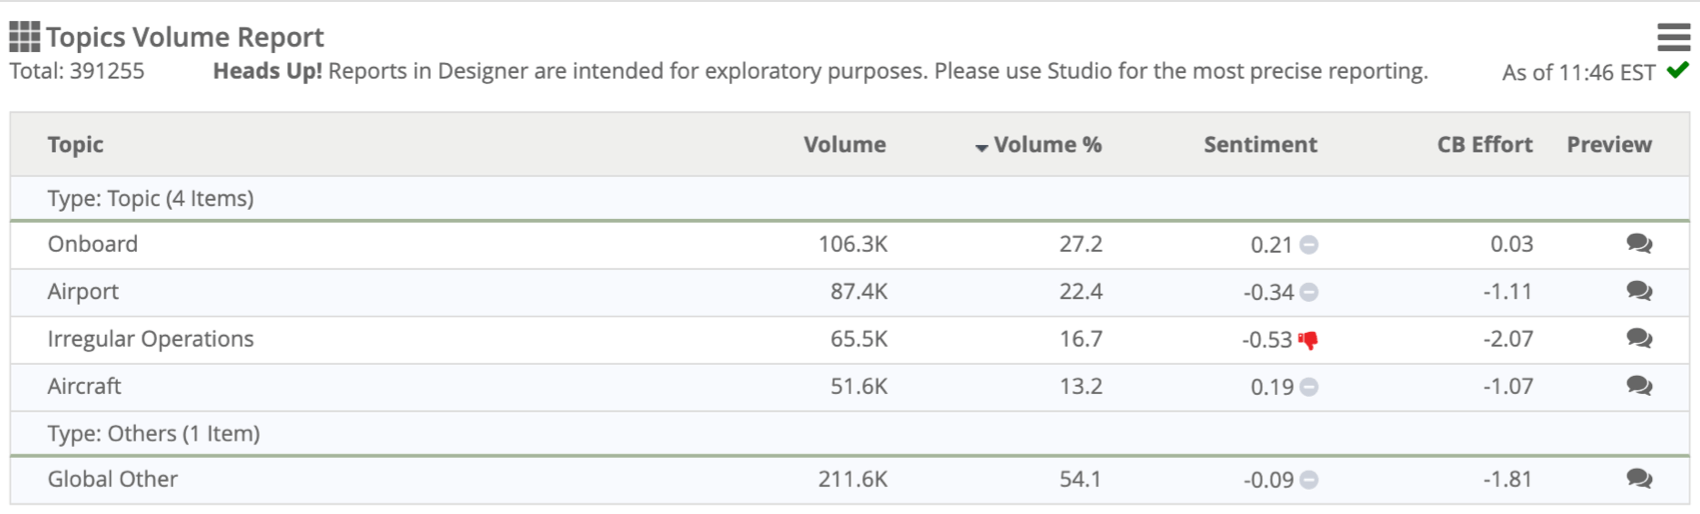
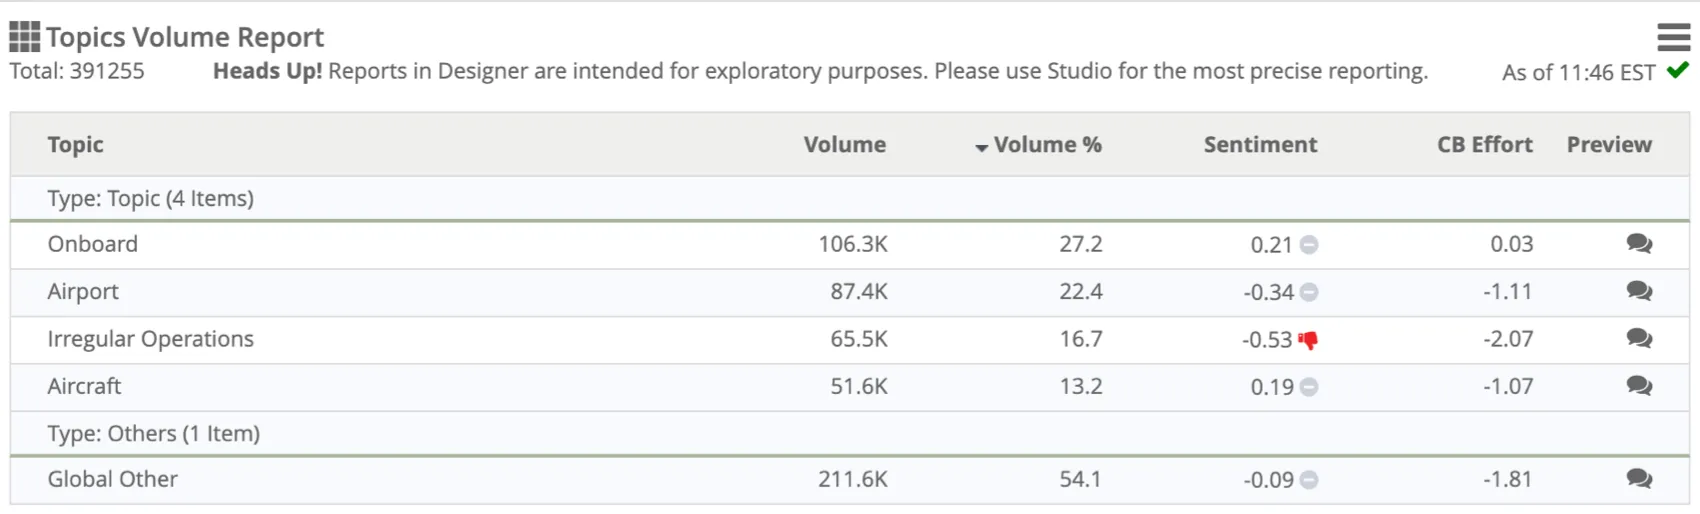
Table Visualization
The Table visualization displays data in a table, where each row represents a certain unit and columns provide related metrics.
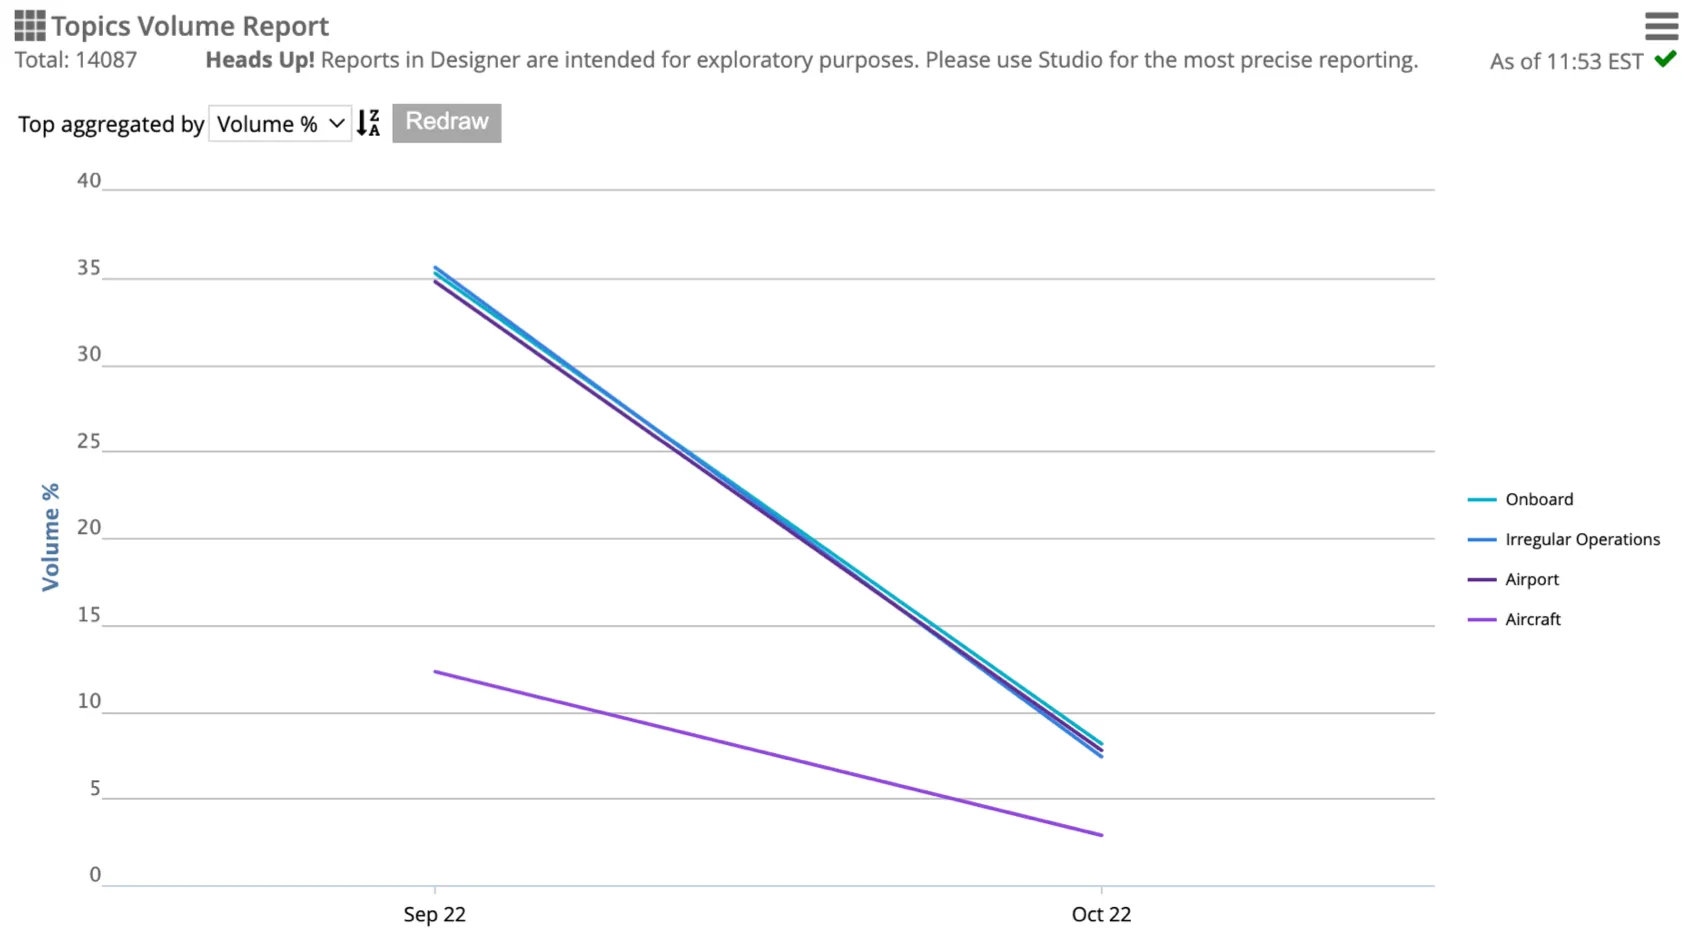
Trend Visualization
The Trend visualization displays data on a timeline to show data trends for a defined time period.
Once you’ve selected Trend as the visualization type for your report, you have to define a time scale. See Creating a Report for step-by-step instructions.
Qtip: When running hourly trend reports, data is categorized based on the hour. For example, comments posted at 9:09 and 9:59 will both be categorized as 9:00. If an hourly trend report is run on a project where time data isn’t available, all data will be assigned a time of midnight (00:00).
Attention: If you define a time scale without specifying a time period, the end date will be the latest data available in the system, while the beginning date will be the earliest data available within the defined time scale, going backwards from the ending date.
After you define a time scale, you can select a specific period of time to analyze by creating a report filter. See Filtering a Report for more information.
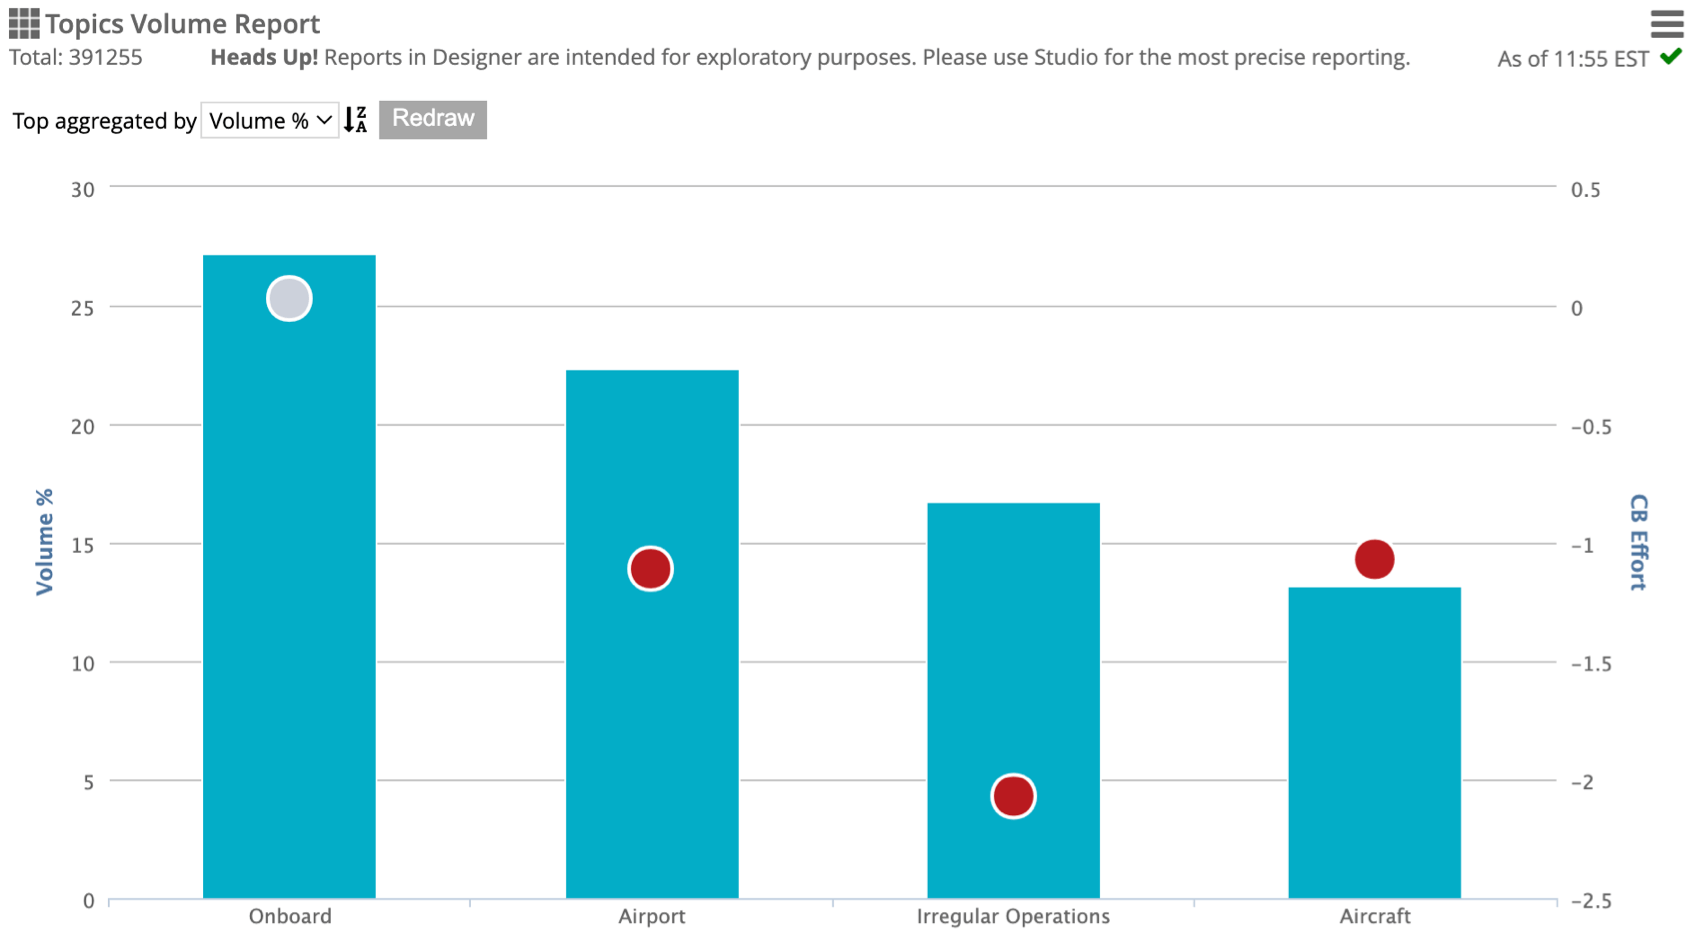
Dual Axis Visualization
The Dual Axis visualization displays data as a column with a secondary vertical axis.

When you select dual axis as the visualization when setting up your report, an additional Column Type dropdown appears where you can select a dual axis view:
- Column: Items are presented as solid columns.
- Stacked column: Columns are broken out into stacks of underlying sentiment bands or satisfaction score ranges.
- Stacked column (100%): Columns are broken out into stacks of underlying sentiment bands or satisfaction score ranges that add up to 100%. With this option it is easier to see the relative difference between stacks in each column, but overall volume is hidden. Attention: Percentage values are rounded, which may cause totals to exceed 100%.

When Stacked column or Stacked column (100%) are selected, an additional Stack Metric dropdown appears in report settings. This determines how the column is divided:
- Sentiment (3 bands): The column is broken out into stacks of positive, neutral, negative, and empty feedback records.
- Sentiment (5 bands): The column is broken out into stacks of strongly positive, positive, neutral, negative, strongly negative, and empty feedback records.
- Satisfaction score: The column is broken out into stacks of Most Loyal, Neutral, and Least Loyal customers.
Qtip: When grouping data by sentiment bands, keep in mind that a record has as many sentiment scores as there are sentences in it. If a record contains 1 positive and 1 negative sentence, it is considered both a positive and a negative record. Hover your mouse over a report element to see the exact sentiment value.
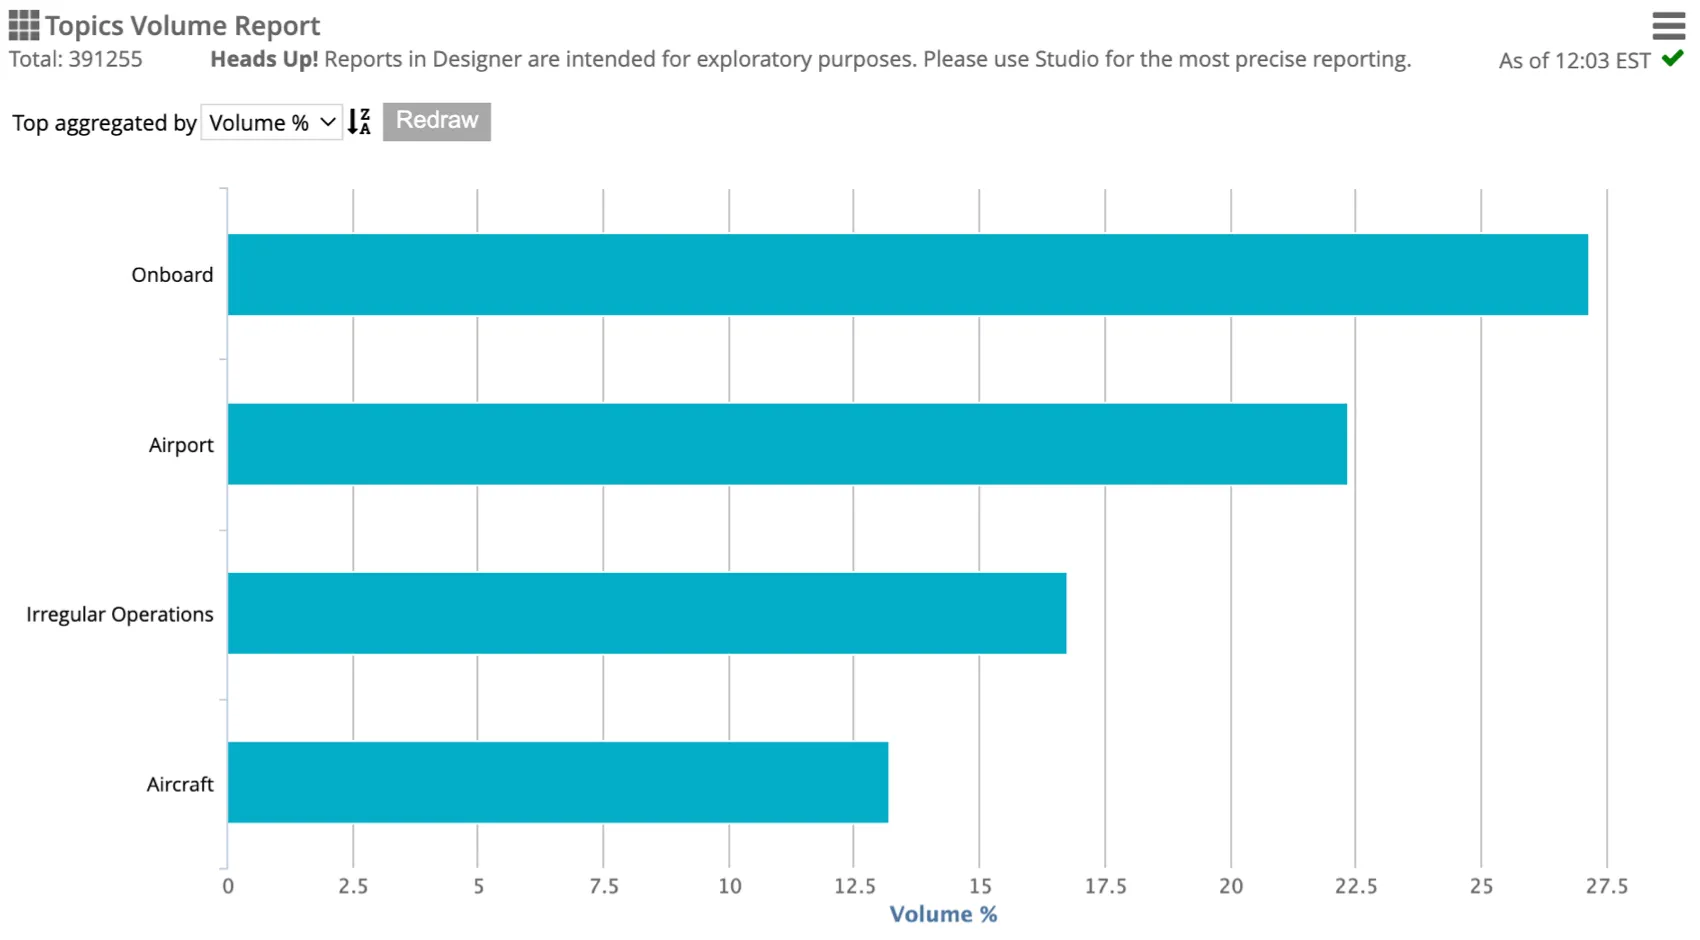
Bar Visualization
The Bar visualization displays data in a bar chart. It shows the top 10 objects aggregated by volume, volume percentage, or sentiment, and is a useful way of comparing items.
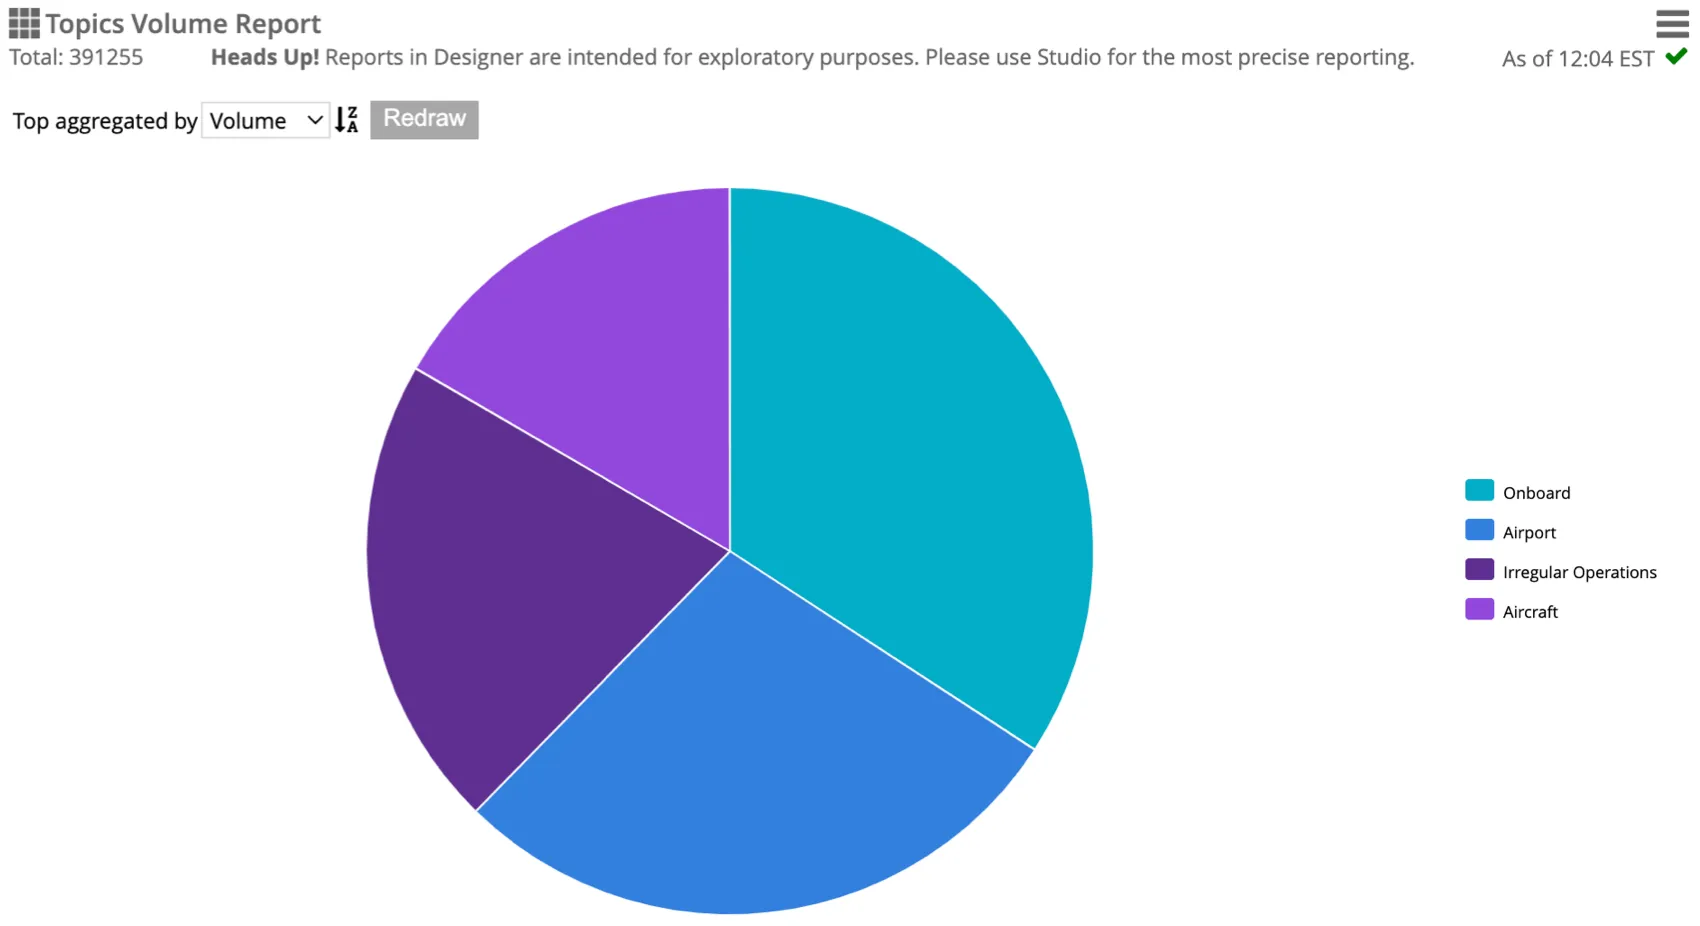
Pie Visualization
The Pie visualization displays data as a pie chart. It shows the top 10 objects aggregated by volume.
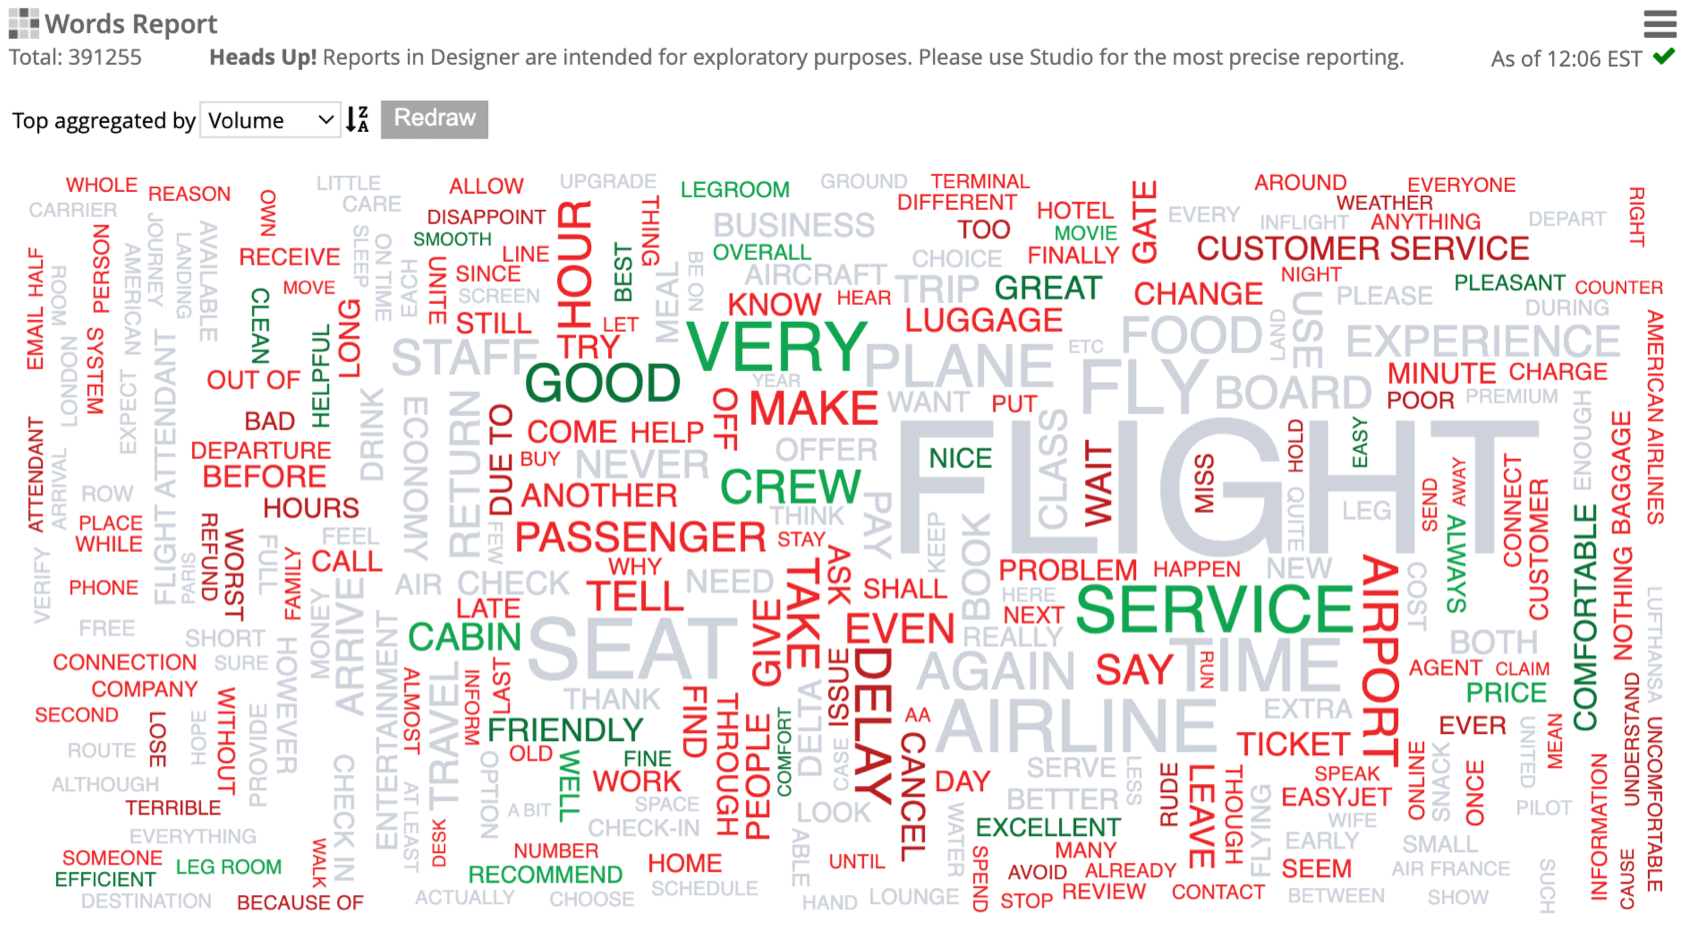
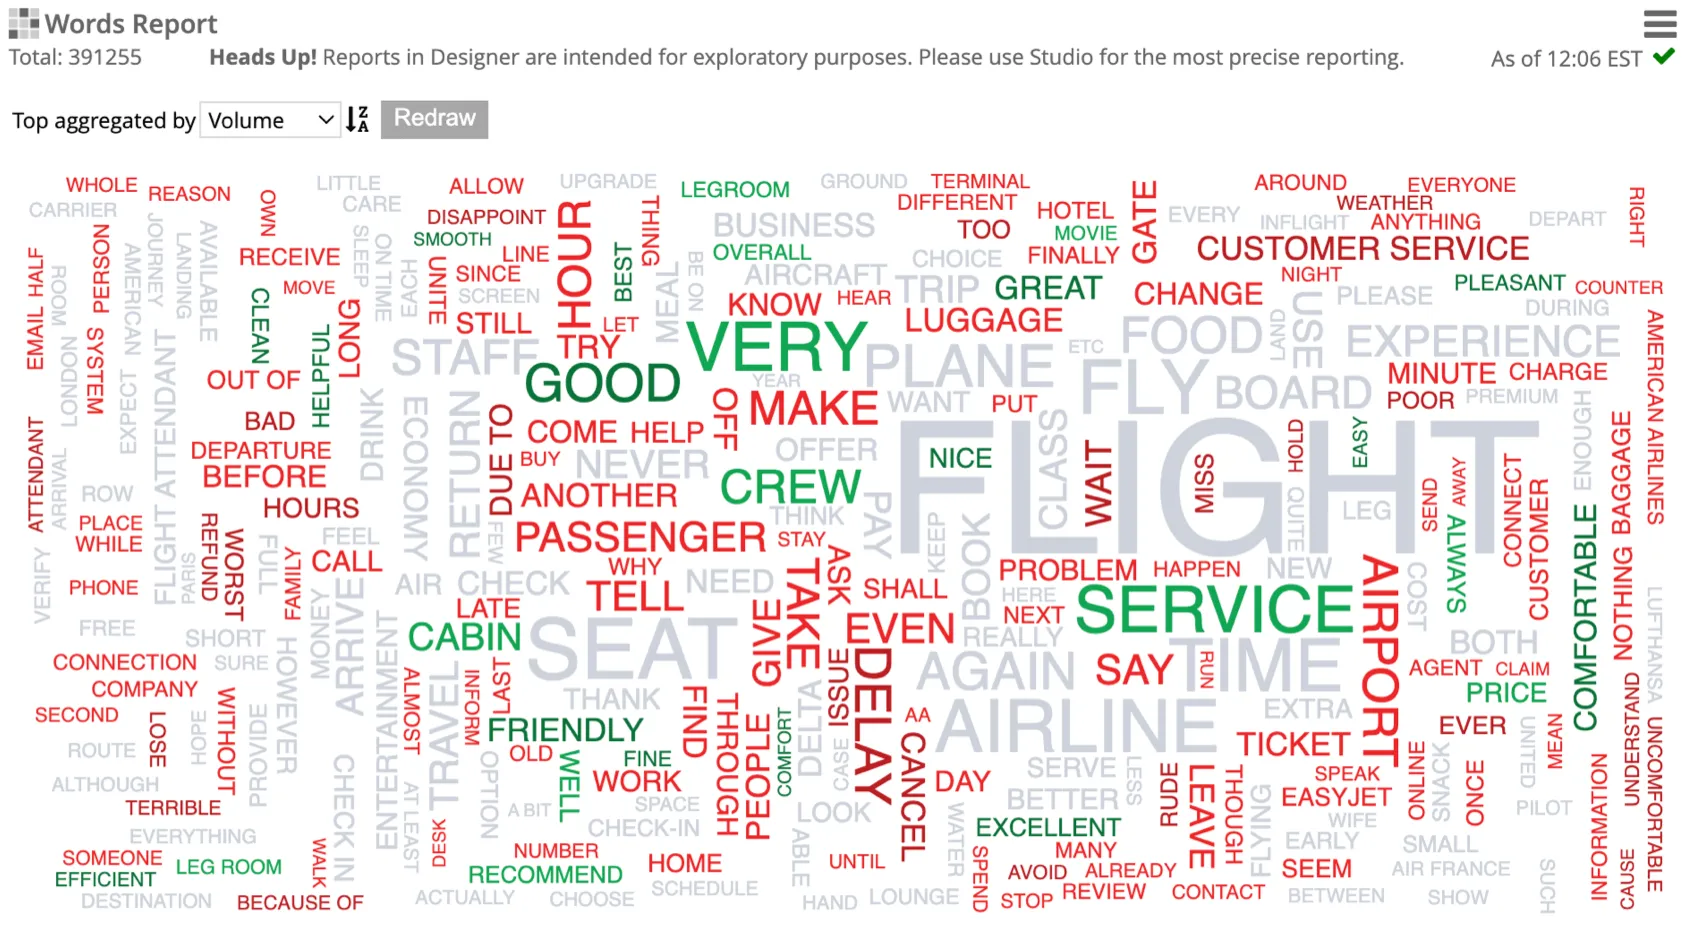
Cloud Visualization
The Cloud visualization displays data in a word cloud. It shows the volume and sentiment of words, associated words, or attributes. The size of each item reflects the number of times it occurred in the specified classification model. The color of each item reflects the average sentiment associated with it.
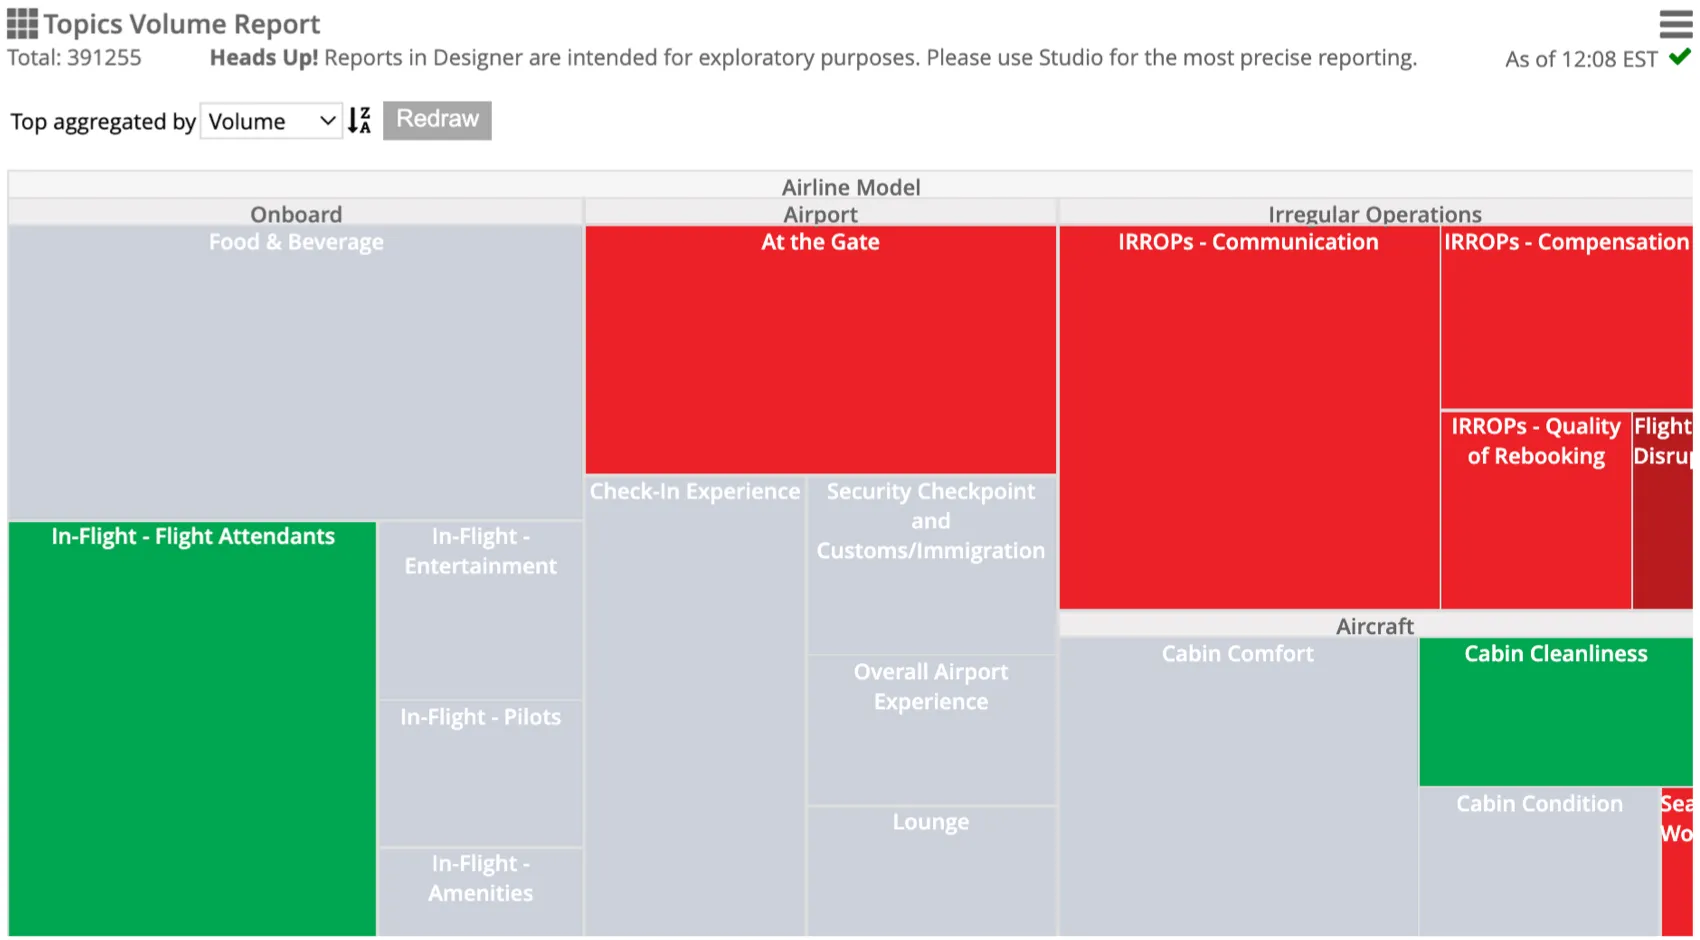
Heat Map Visualization
The Heat Map visualization displays category statistics using blocks of different sizes and colors. Parent categories are represented as gray blocks containing top subcategories. Child categories are represented as segments of different size and color, based on volume and sentiment.
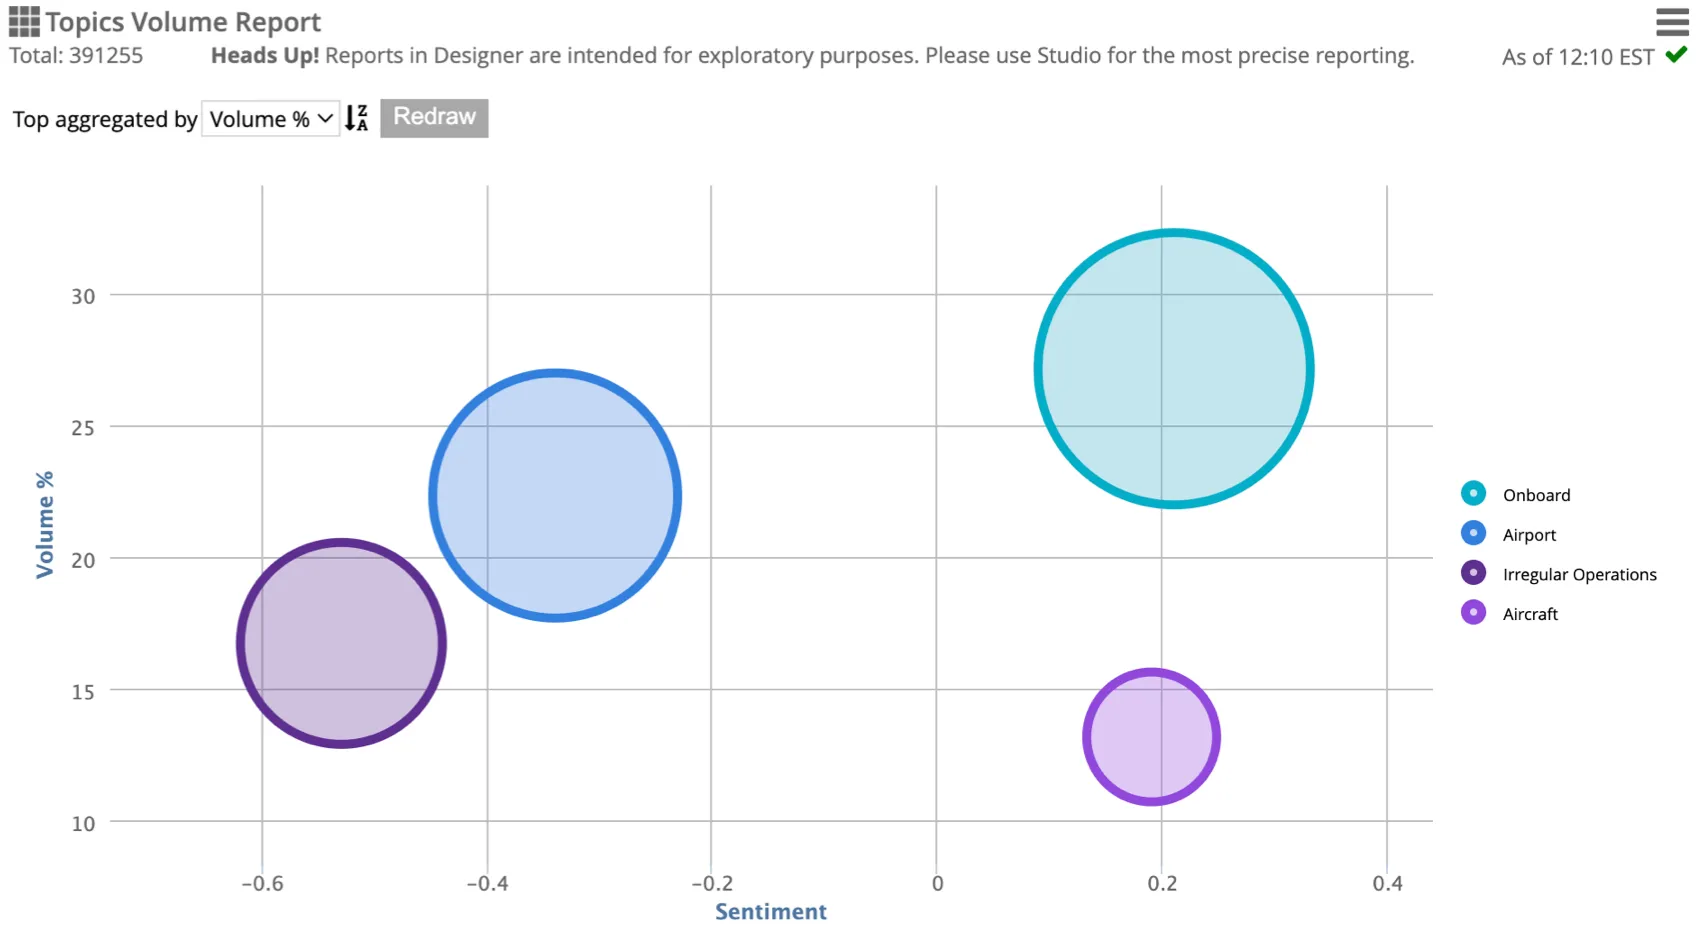
Bubble Visualization
The Bubble visualization displays data in a bubble chart, where the size of each bubble reflects volume.
When you select bubble as the visualization type, a Top aggregated by dropdown appears within the visualization where you can select what metric to use for the y-axis. This will be either an additional metric if one is selected, or volume % if sentiment is used as a performance metric. The x-axis represents sentiment.
That's great! Thank you for your feedback!
Thank you for your feedback!