
Results Dashboards Widgets
What's on this page
Qtip: To opt in to the new version of Results, navigate to the Results tab and select Try it now in the banner. To switch back to the old version of Results, click Settings, then go to the Themes tab and click Revert back.
About Results Dashboards Widgets
Attention: If 2 or more widgets have the same title, this title will only be displayed once in the widget list within the page panel. To have all widgets show up within the widget list, you must change the widget titles to be unique.
Widgets are tables or graphs that display your data. When you generate a report page in the Results section, widgets are created for you automatically, but you can always add more. Each widget varies in its options and settings, however, there are some basic principles that apply to all or most widget types, which are detailed on this page.
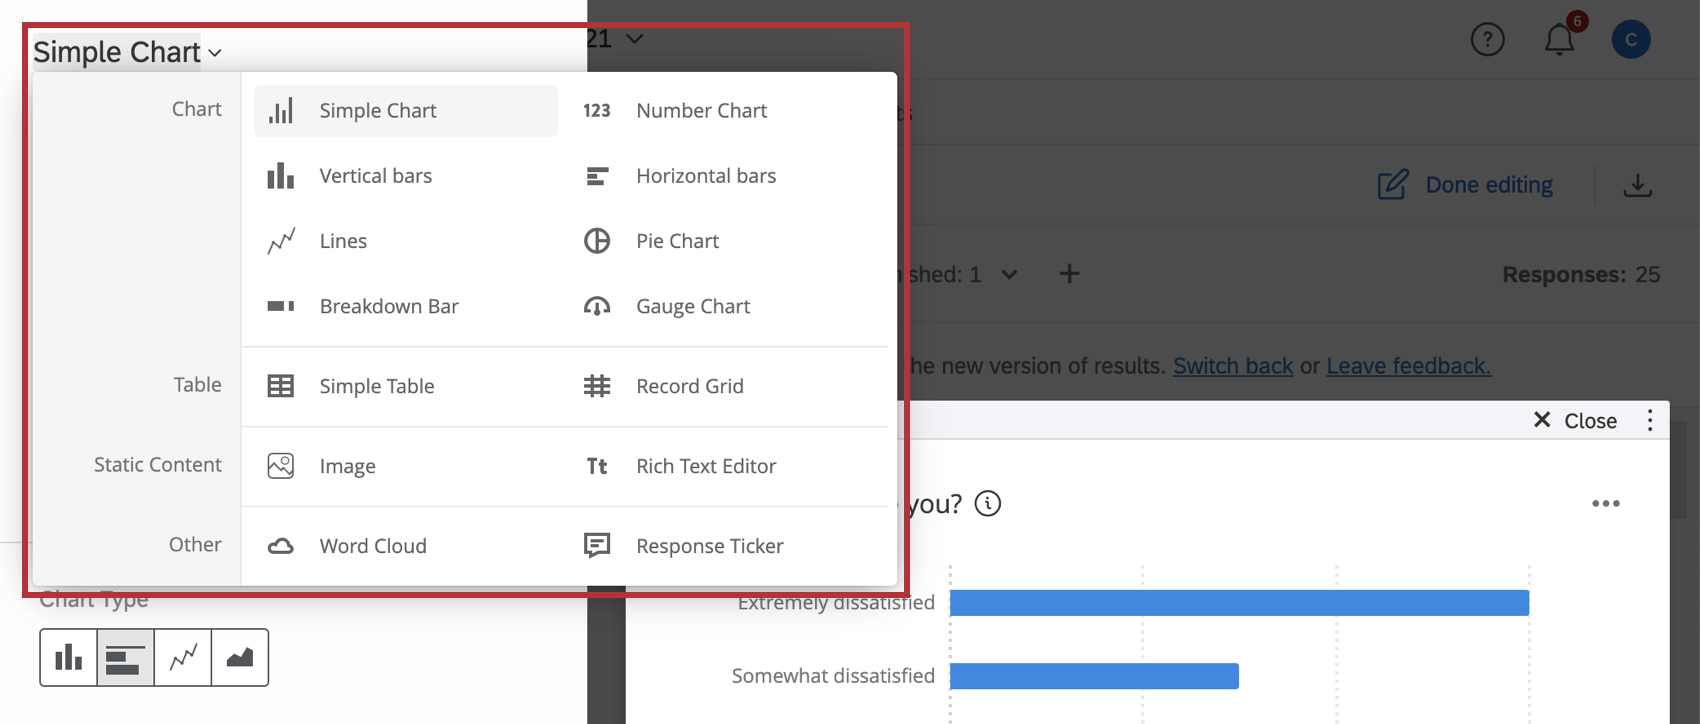
Widget Types
To change the type of an existing widget click Edit. You can change the widget type by clicking on the current widget type and selecting a new type from the dropdown.
Qtip: You must be in editing mode in your dashboard to edit individual widgets.
Each widget varies in its customization options and settings, which you can find detailed on the linked pages.
Attention: Not every question type is compatible with every widget. For example, it doesn’t make sense to have a bar chart option for text entry questions. Only fields that are compatible with a specific widget type will be available when configuring the widget.
Charts
Tables
Static Widgets
Other Widgets
Qtip: These widget types are the same as CX Dashboard widgets, with the exception of the heat map plot and text highlights widget, which are only available in Results Dashboards.
Widget Options
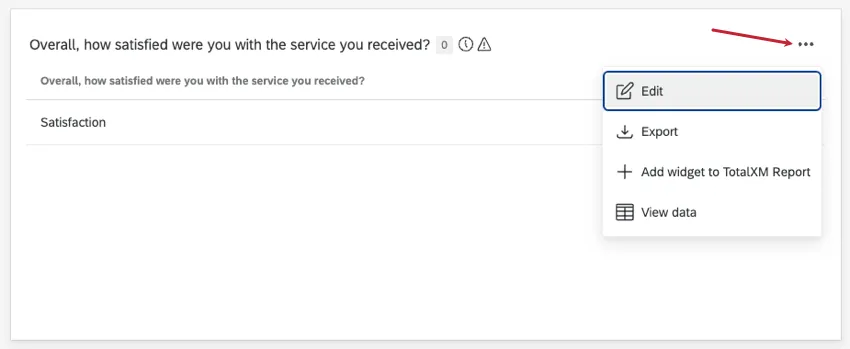
To open widget options, click the 3 dots in the top-right corner of your widget.
The options you have on a widget vary by the type of widget and whether you are editing or viewing your dashboard.
Editing mode options
- Duplicate: Create a copy of your widget. You can choose to place the copy below the original widget, or at the bottom of your dashboard page.
- Remove: Delete your widget. All applied configurations and filters will be lost.
Embed widget: Displays a code snippet you can use to embed your widget in a third party platform.

Qtip: If you want the widget to display data based on the object you’re looking at, select the filter you want to use.
Move to page: Move your widget to an existing page.
Qtip: Widgets cannot be moved from private pages.
Viewing mode options
- Edit: Open the widget editing pane.
- Export: Only certain widgets can be exported. See this page on exporting widgets.
- Add widget to TotalXM Report: TotalXM Reports are not available to all customers. For more information, see TotalXM Reports.
- View data: View widget data as a table or spreadsheet. See Viewing widget data for more details.
Table: Default Field Types for Each Question
When creating a dashboard, every field needs to be assigned a field type. Field types help specify the type of data mapped into the field, which then determines which widgets the field can be added to. The Field Types & Widget Compatibility (CX) page has a guide to all the different widgets and what field types work with them. You can also find this information on each individual widget’s support page. (For example, here is field type compatibility for gauge chart widgets.)
In results dashboards, each type of survey question is assigned a specific field type by default. You cannot edit this field type. For help figuring out which widgets you can use with your survey questions, see the table below for a list of question types and their corresponding fields.
| Question type | Default field type | Important notes |
|---|---|---|
| Multiple choice (single answer) | Text set | This is true for all single answer multiple choice style questions, such as:
|
| Multiple choice (multiple answer) | Multi-answer text set | This is true for all multiple answer multiple choice style questions, such as:
|
| Text entry | Open text | This is true for all text entry style questions, such as:
The only exception are text entry questions with numeric validation. All other variations, including date validation, automatically map as open text fields. |
| Number scale | Number set | Each statement is mapped as a separate dashboard field. |
| Text entry (numeric validation) | Numeric value | |
| Form field | Open text | Each form field is mapped as a separate dashboard field |
| Slider | Numeric value | Each statement of the slider is mapped as a separate dashboard field |
| Rank order | Number set | Each item in the rank order question as a separate dashboard field |
| Constant sum | Numeric value | Each item in the constant sum as a separate dashboard field |
| Pick, group, & rank (groups) | Multi-answer text set | |
| Pick, group, & rank (ranks) | Number set | |
| Hot spot / heat map (regions only) | Text set | |
| Heat map | See right | The clicks from heat map questions can be visualized in a heat map plot. |
| Graphic slider | Text set | |
| Drill down | Drill down | Drill down questions map to drill down fields groups. Each individual category is mapped as a text set within that field group. |
| Net Promoter Score® (NPS) | Number set | |
| Highlight | Multi-answer text set | Each highlight category is mapped as a separate dashboard field. The answers are in the forms of the different words that were marked with those categories. See Downloaded Data Format for more details. |
| Timing | Numeric value | There are separate dashboard fields mapped for clicks, page submit, click count, and so on. See Downloaded Data Format for more details. |
| Meta info | Text set | |
| File Upload / Signature (file name) | Open text | |
| File upload / Signature (size) | Numeric value | |
| File upload / Signature (type) | Text set | |
| Matrix | See right | Each statement is mapped as a different field in the dashboard. The default field type varies based on the format of the matrix table. For example, single answer likert is text set, text entry is open text, and so on. |
| Side by side | See right | Each possible combination of statement and column is mapped as a different field in the dashboard. The default field type varies based on the format of the column. For example, scaled response is text set, open ended text is open text, and so on. |
Qtip: To learn more about mapping fields in results dashboards, see Mapping Results Dashboards Fields.
FAQs
Does Results Dashboards have the same visualizations as Results-Reports?
Does Results Dashboards have the same visualizations as Results-Reports?
Can I create a Statistics Table widget within Results Dashboards?
Can I create a Statistics Table widget within Results Dashboards?
How are tracked events stored?
How are tracked events stored?
That's great! Thank you for your feedback!
Thank you for your feedback!