
Exporting Studio Data
What's on this page
About Exporting Studio Data
Depending on viewer access and permission level, it’s possible to export Studio data from a single report widget to Excel, export Studio data from all reporting widgets of a dashboard to an XLSX file and export and save a dashboard as a PDF file for offline viewing or quick sharing. You can also save most reporting widgets you have access to as a PNG image. It’s also possible to embed widgets in external tools, drill in place on an embedded widget, and export data from all reporting widgets of a current tab to an XLSX file.
Exporting Data From a Widget to Excel
Data exported from widgets will be in XLSX format.
Qtip: You must have the Export Widget Data permission to export data from widgets.
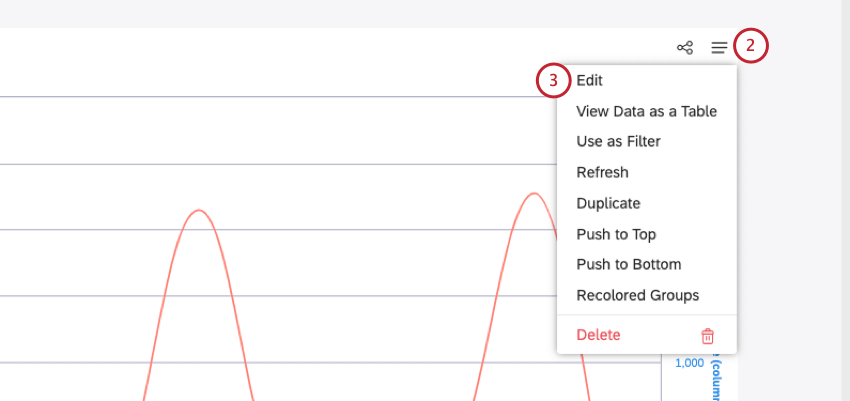
Exporting a Widget to Excel
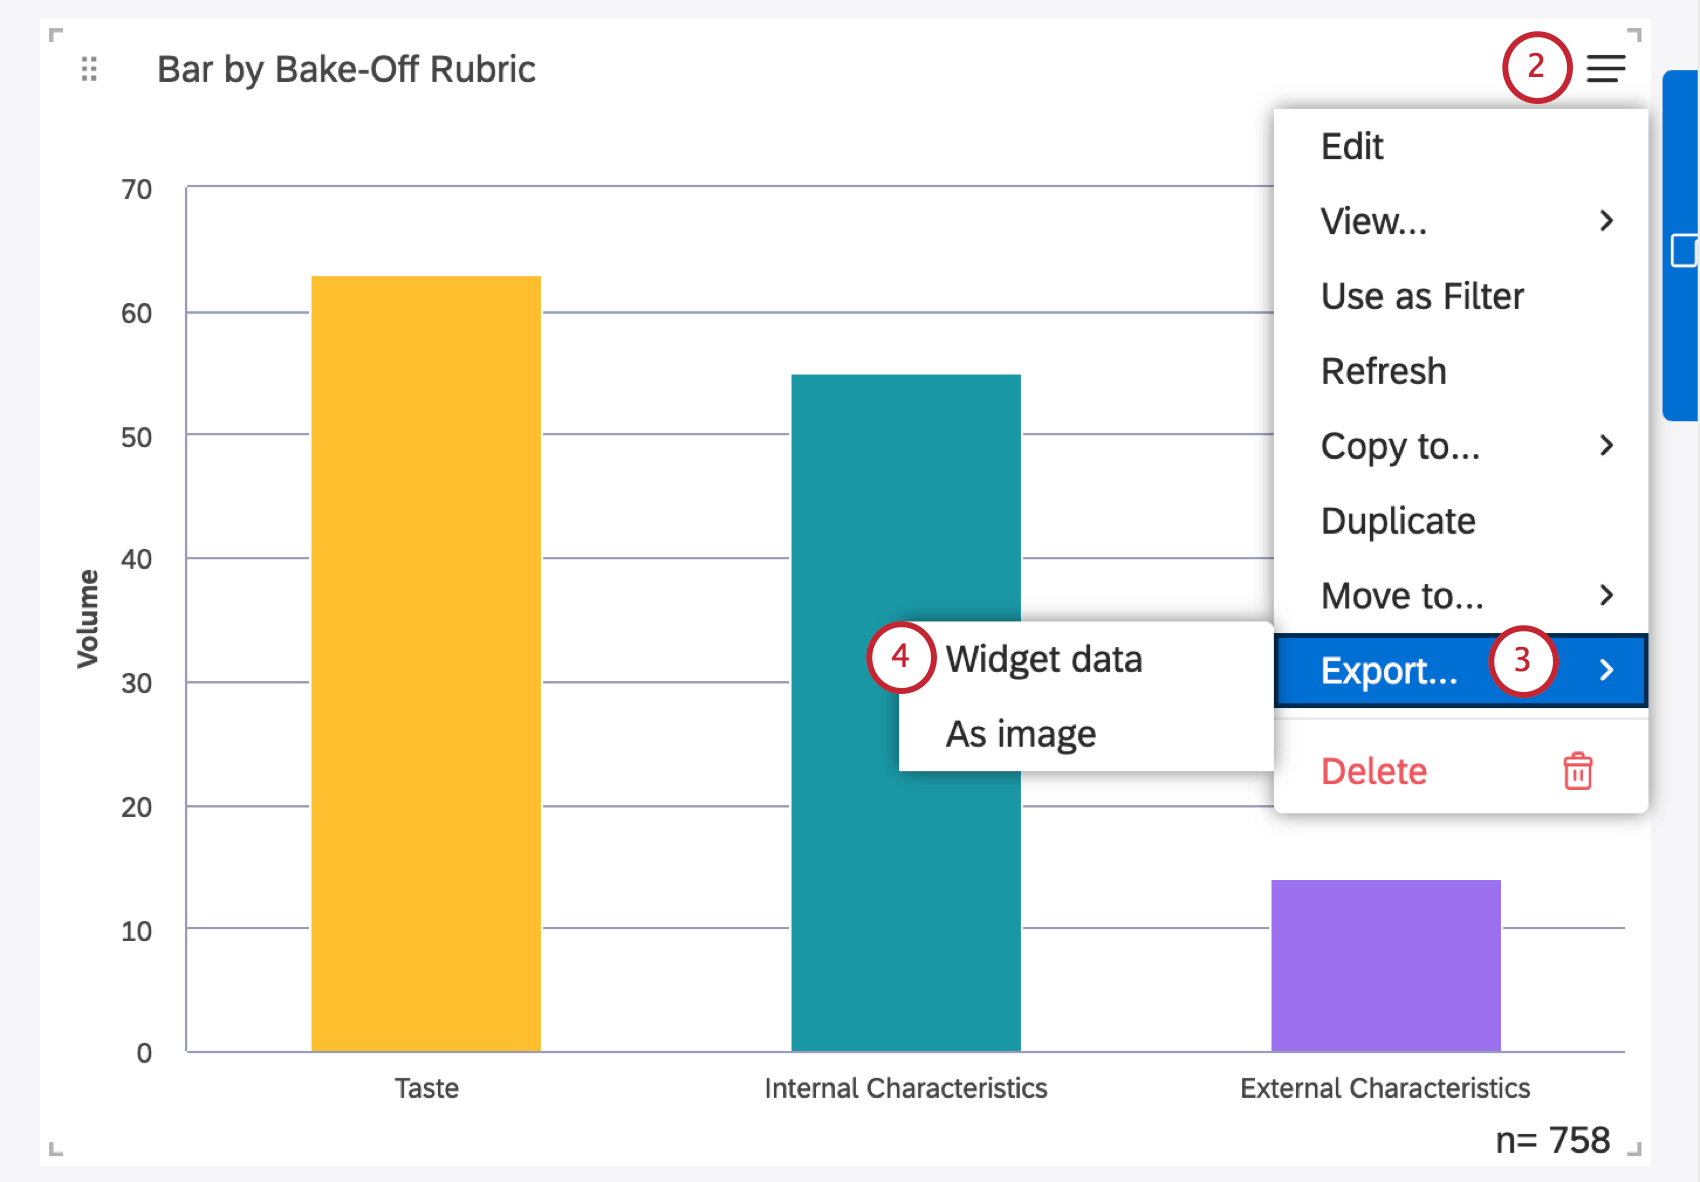
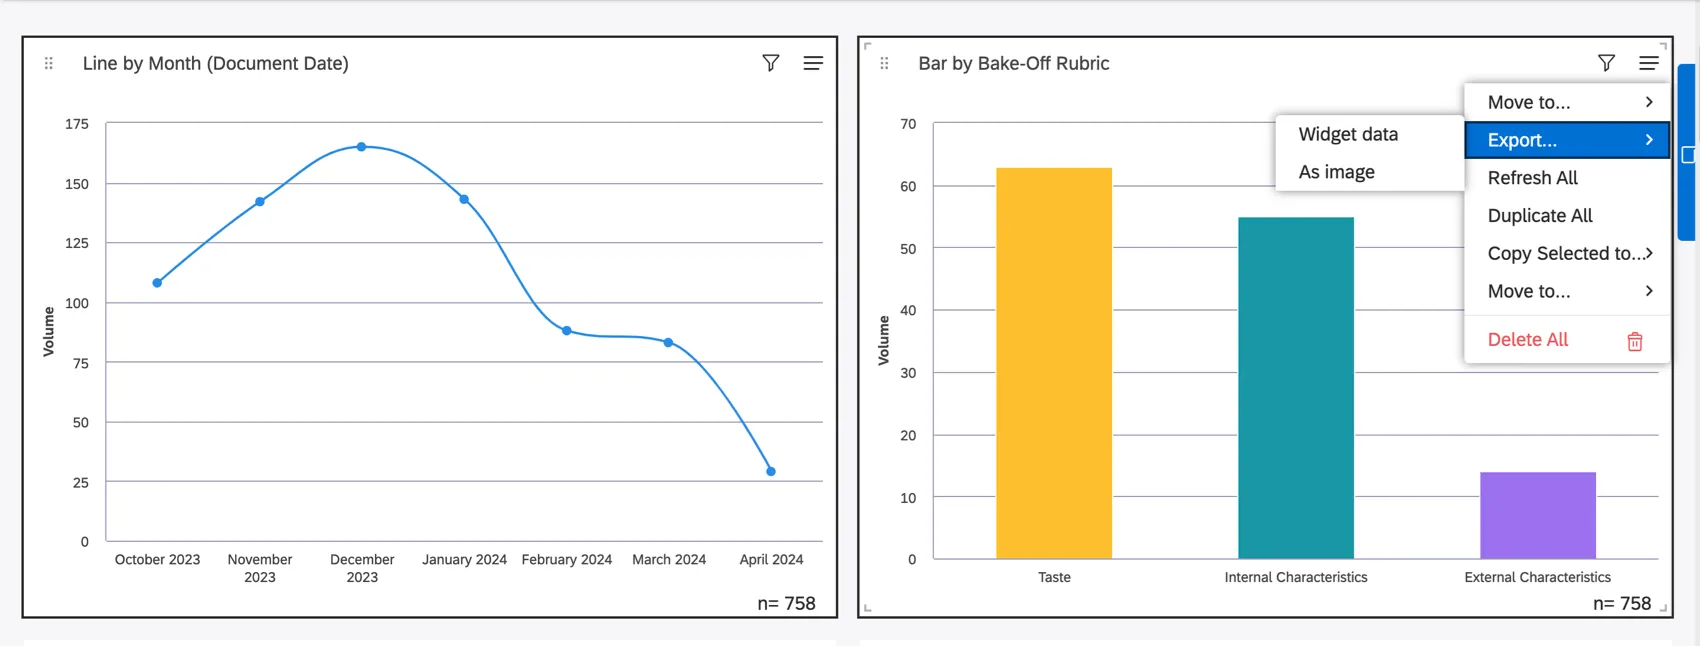
Qtip: You can only export images or Excel data from one widget at a time or from the whole dashboard. If you select multiple widgets, you will only export the data from the widget whose menu you have open. For example, in the screenshot below, while both widgets are selected, you’ll only export the bar chart’s data.
Information Included in the Excel File
The exported file contains the following data:
- Content Provider information
- Widget owner
- Report title
- Report settings
- Sampling level (disregard this field as it has been deprecated)
- Document volume (the total number of documents that match report conditions and filters).
- Applied Organization filters (if a dashboard is personalized)
- Applied dashboard filters (if any)
- Applied widget filters (if any)
- Drill filters (if any)
- Linked filters from parent widgets (if any)
- Run and export date (according to exporting user’s time zone and user preferences)
- Time periods names and definitions
- Report data
Feedback Widget Export
The feedback widget export contains sentences and related documents, dates, sources, sentiment, and effort depending on the granularity and display settings.
Attention: Exports cannot exceed either 5,000 sentences worth of data, 2,000 verbatims, or 1,000 documents.
Qtip: The export does not display Twitter content. Sentences that come from Twitter are represented with IDs and the following text: “Twitter data cannot be exported” instead of the actual content.
Exporting Data From All Widgets to Excel
Qtip: You need the Export Widget Data permission to export widgets to Excel.
You can export data from all reporting widgets of a dashboard to an XLSX file. Text, labels, images, and videos are not exported to XLSX, but can be exported to PDF.
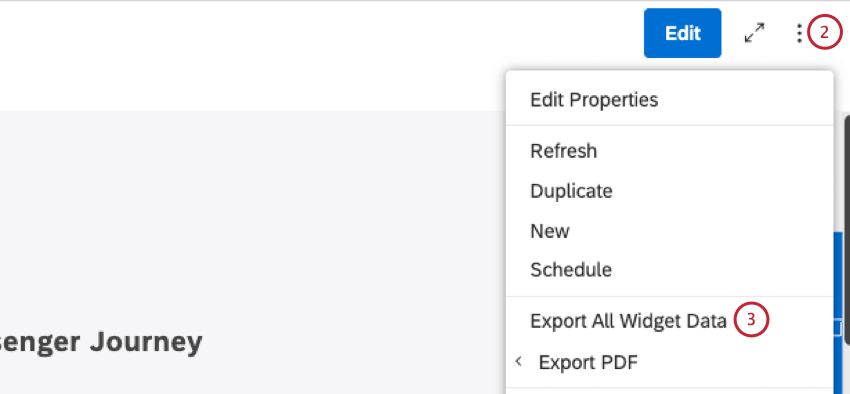
The exported file contains each widget’s data in a separate Excel sheet in the order of their appearance on the dashboard. For each widget, the following data is exported:
- Content Provider information
- Widget owner
- Report title
- Report settings
- Sampling level (disregard this field as it has been deprecated)
- Document volume (the total number of documents that match report conditions and filters).
- Applied Organization filters (if a dashboard is personalized)
- Applied dashboard filters (if any)
- Applied widget filters (if any)
- Drill filters (if any)
- Linked filters from parent widgets (if any)
- Run and export date (according to exporting user’s time zone and user preferences)
- Time periods names and definitions
- Report data
Feedback Widget Export
The feedback widget export contains sentences and related documents, dates, sources, sentiment, and Effort depending on the granularity and display settings. Please note the following limitations:
- A single export cannot exceed 5,000 sentences worth of data.
- Export does not display Twitter content. Sentences that come from Twitter are represented with IDs and the following text: “Twitter data cannot be exported” instead of the actual content.
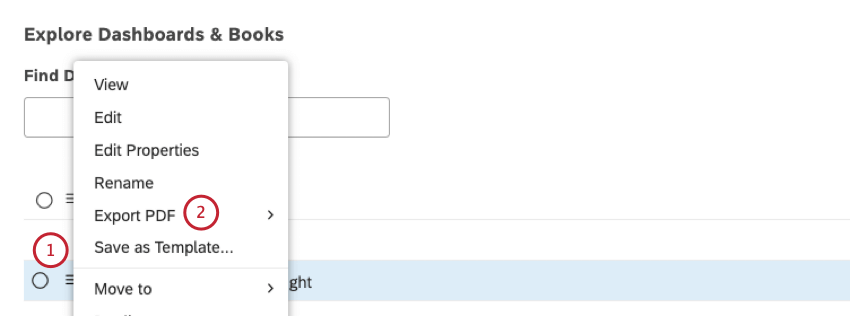
Exporting a Dashboard to PDF
Qtip: Any user with viewer access to the dashboard can export the dashboard to PDF.
Qtip: Map widgets cannot be exported to PDF. Video widgets only show an opening frame in PDF.
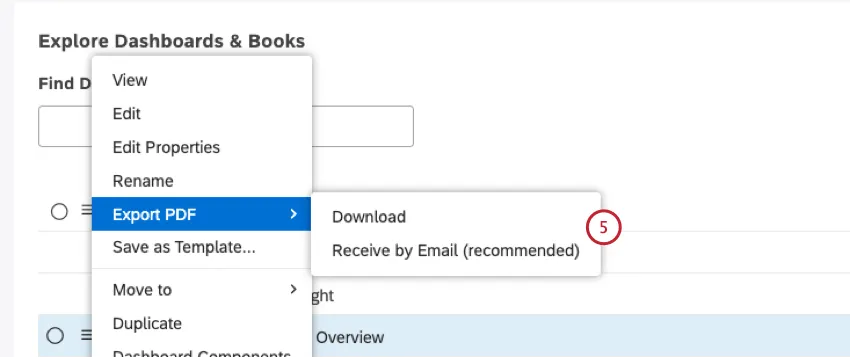
You can export and save an entire dashboard as a PDF file for offline viewing or quick sharing.
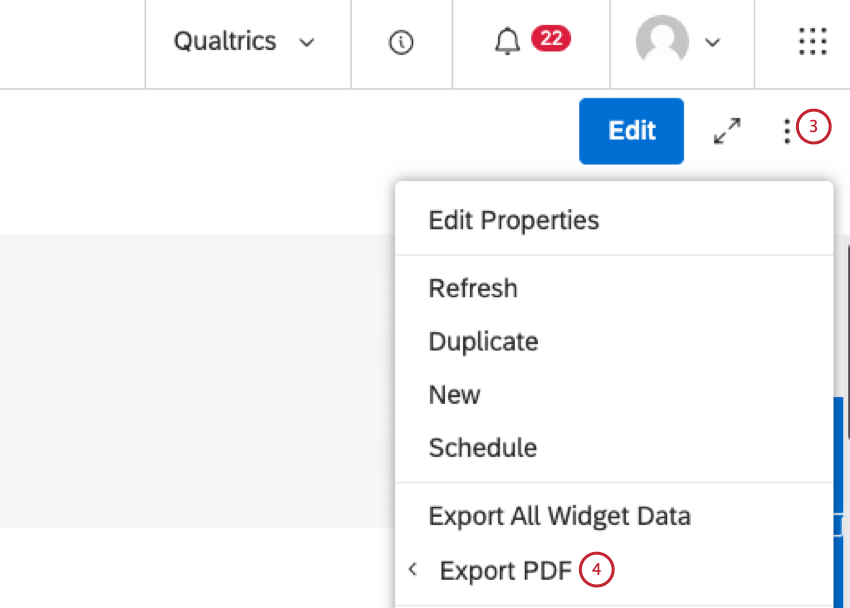
- Select Download to download the file in your browser.
Select Receive by Email (recommended) to receive the file by email, and avoid having to wait for the export to be processed.

Qtip: You can define the size of a PDF page using a page break widget. Otherwise your dashboard will be exported as a single page.
Qtip: Dashboard-to-PDF exports have independent timeout guardrails: 15 minutes for a scheduled export and 8 minutes for a manual export. Please consider these when configuring dashboards. For example, spread widgets across dashboards in a book instead of reaching a maximum limit of 25 reporting widgets.
Data Included in the Report
The exported file contains the following data:
- Dashboard name
- Exported by
- Exported on (according to exporting user’s time zone and user preferences)
- Personalized for (if personalization is enabled)
- Applied filters (if they are applied to an entire dashboard)
- All widgets as they appear on the dashboard (including in-place drilling and parent widget filters)
Saving a Widget as an Image
You can download most of your dashboard widgets as PNG images. This lets you quickly share snapshots of data with colleagues and get images for slide show presentations.
Qtip: You can download an image of almost any widget with data. (For example, rich text and images don’t have data, so you can’t export these as images.) The only reporting widget you cannot export as an image is the map widget.
Qtip: You cannot export a widget as a PNG in stats mode.
When you save a widget as an image, its resolution is doubled to improve image quality.
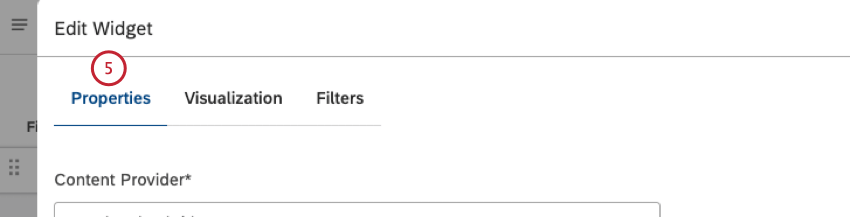
Embedding Widgets in External Tools
Qtip: To embed a widget, you need to have the following:
- Embed Widgets permission
- Embed Widgets for Enterprise permission (for enterprise viewers)
- Edit Dashboard permission
- Can Edit access to a dashboard with the widget.
To increase report visibility, you can embed Studio widgets in external tools via code snippets while retaining Studio security. For more information on embedding widgets, see Embedded Widget Report.
Viewer Tiers
A viewer can be a licensed Studio user who views a widget in Studio or someone who does not have a Studio license who views a widget on, for example, an external website in which a widget is embedded. A viewer who is not a licensed Studio user sees a widget only if it is embedded in Enterprise mode.
When embedding a widget, you can choose whether a Studio license should be required to view it.
- Licensed viewer: A person who can view the embedded widget and interact with it (which includes drilling, exploring documents, and navigating to Studio dashboard). A Licensed viewer requires the following:
- A Studio license.
- At least Can View access to a dashboard with the widget.
- Enterprise viewer: A person who can view the embedded widget but not interact with it. This could be either somebody who does not have a Studio license or, having a license, does not have shared access to the widget. Please note the following caveats:
- Enterprise viewers do not see the widget with real-time data, but a cached version that can be up to 30 minutes old.
- Feedback widgets are not allowed to be embedded for Enterprise viewers.
An Enterprise viewer requires membership of an organization’s single sign-on (SSO) authentication scheme. To support Enterprise viewers, an account requires the following:
- SSO must be configured as the account’s sign-in method for Studio.
- The Embed Widgets for Unlicensed Enterprise Users setting must be enabled in account settings.
Drilling In Place
If you are a Studio user and you have at least viewer-level access to the widget’s dashboard, and an Export Feedback permission, you can drill in place on an embedded widget, export widget data to an Excel file or save an embedded widget as a static image.
If you are a Studio user without access to the widget’s dashboard, or if you don’t have a Studio license, the widget will not allow drilling, exporting data or image, and will not display a dashboard link.
Getting the Widget’s Code
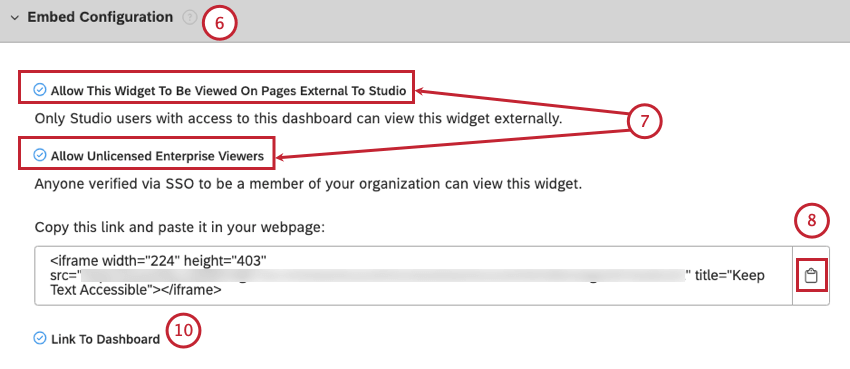
- Allow This Widget To Be Viewed On Pages External To Studio to allow licensed viewers with dashboard access to view and interact with the widget outside of Studio.
Allow Unlicensed Enterprise Viewers to allow Enterprise viewers without dashboard access to view the widget outside of Studio provided they belong to the organization’s SSO authentication scheme.
Qtip: The “Allow Unlicensed Enterprise Viewers to” option will not appear unless you’re using an Enterprise account with SSO enabled.
Using the Embedded Code
Once you have the widget’s code, insert it into any external tool that supports HTML snippets.
Qtip: Embedded widgets have the same browser requirements as Studio.
Drilling works within the boundaries of the iframe. Embedded widgets resize to fit iframes. Resize the width and height of the iframe, and the widget will adjust.
If you modify an embedded widget in Studio, it will be updated in the external tool as well. If you delete a widget or its dashboard, the embedded widget will show an error message: “Graph disabled for viewing outside of Studio.”
Embedding widgets is supported when SSO is enabled and this is preferred for a more seamless experience.
Exporting All Tab Data
Qtip: Only reporting widgets are exported to XLSX.
You can export data from all reporting widgets of a current tab to an XLSX file. This export is identical to exporting all widget data from a dashboard.

The exported file contains each widget’s data in a separate Excel sheet in the order of their appearance on the dashboard.
Exporting a Tab to PDF
Attention: Map widgets cannot be exported to PDF. Exported video widgets will only show the opening frame in the PDF.
You can save an entire tab as a PDF file. This export is identical to exporting a dashboard to a PDF.
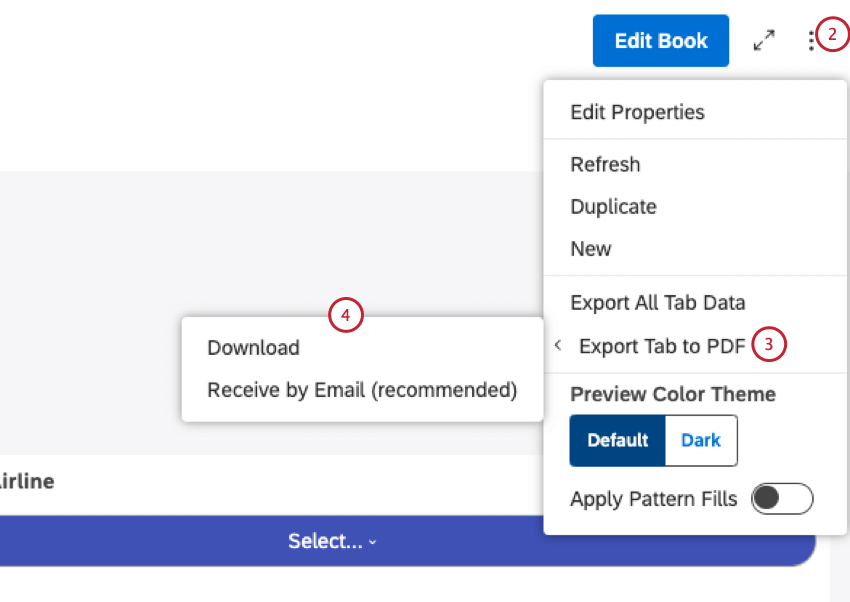
- Select Download to download the file in your browser.
- Select Receive by Email (recommended) to receive the file by email, and avoid having to wait for the export to be processed.
The exported file contains the following data:
- Tab name
- Exported by
- Exported on (according to exporting user’s time zone and user preferences)
- Personalized for (if personalization is enabled)
- Applied filters (if they are applied to an entire dashboard)
- All widgets as they appear on the dashboard (including in-place drilling and parent widget filters)
That's great! Thank you for your feedback!
Thank you for your feedback!