
RN Satisfaction Widget (EX)
What's on this page
About RN Satisfaction Widgets
The RN Satisfaction widget calculates registered nurse satisfaction according to the Magnet Recognition Program® submission requirements and displays it in a table. Survey scores are grouped into 7 categories and compared against a national benchmark. Colors indicate whether the category is under or outperforming the benchmark.
2 table views are available for the widget: Location Summary and Unit Detail.

Attention: Qualtrics recommends that you do not edit RN Satisfaction widgets due to the complexity of their configuration. If you have configuration questions, reach out to your Technical Success Manager.
Qtip: You can use any of the date field options in the RN Satisfaction widget’s setup, (such as discharge date). If the date type needs to be changed, please talk to your Technical Success Manager.
Location Summary View
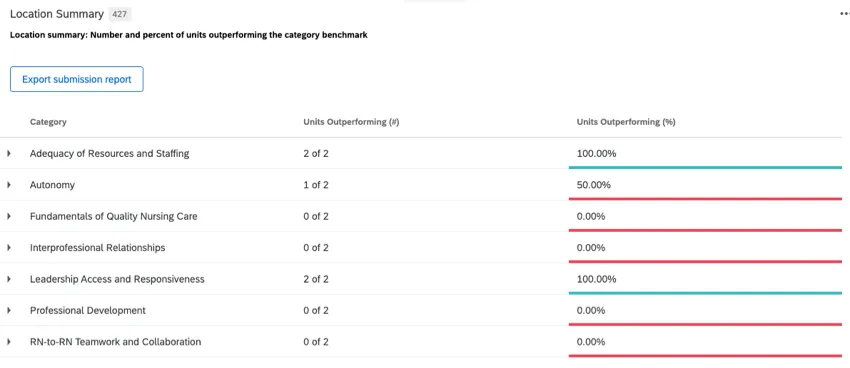
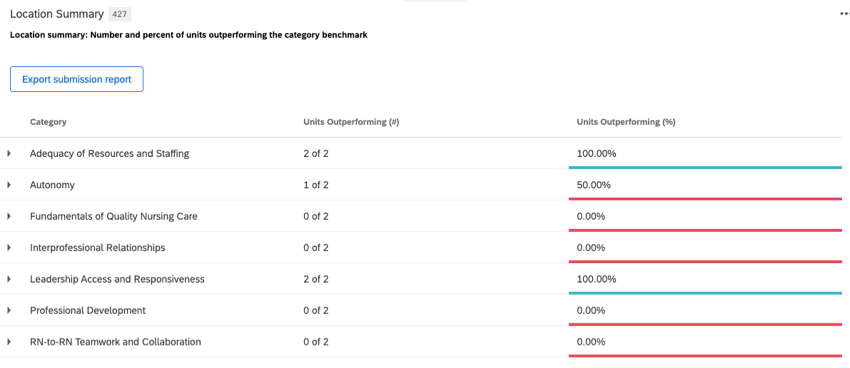
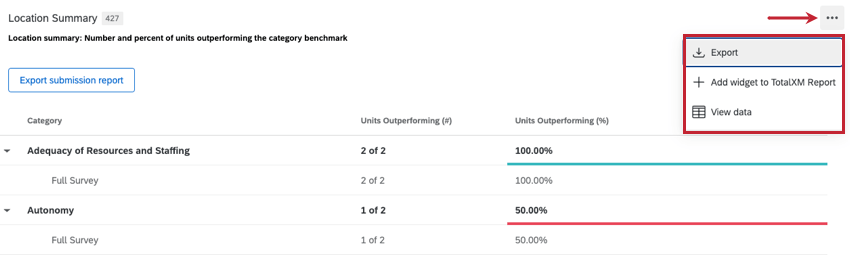
The Location summary table view displays the number and percentage of units in each category outperforming the benchmark.
If the percentage of units outperforming the benchmark in a category is over 50%, the cell value is displayed in green, if it is under 50% it is displayed in red. 51% of units need to outperform the benchmark in at least 4 categories to meet the Magnet Recognition Program® submission requirements
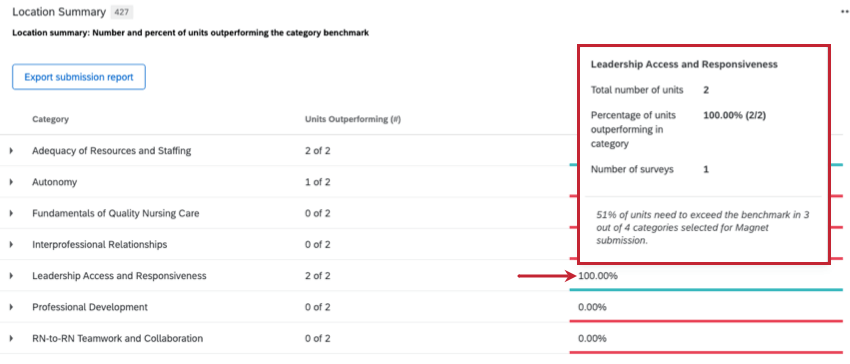
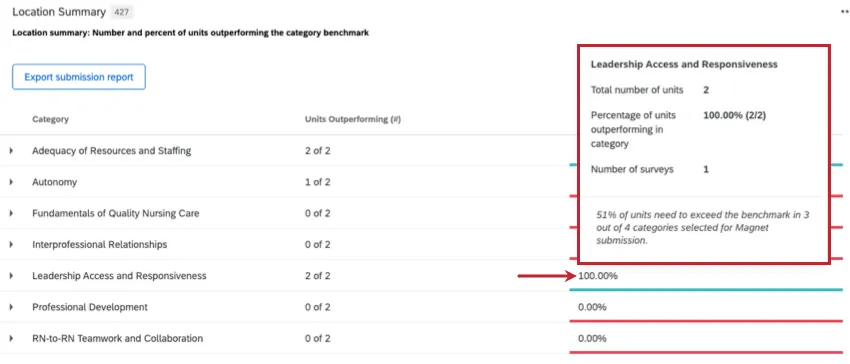
Hover over a specific score to display additional information.
Unit Detail View
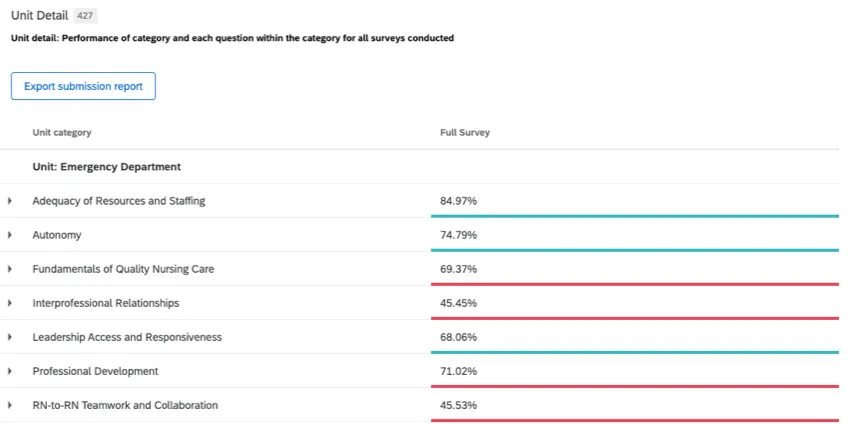
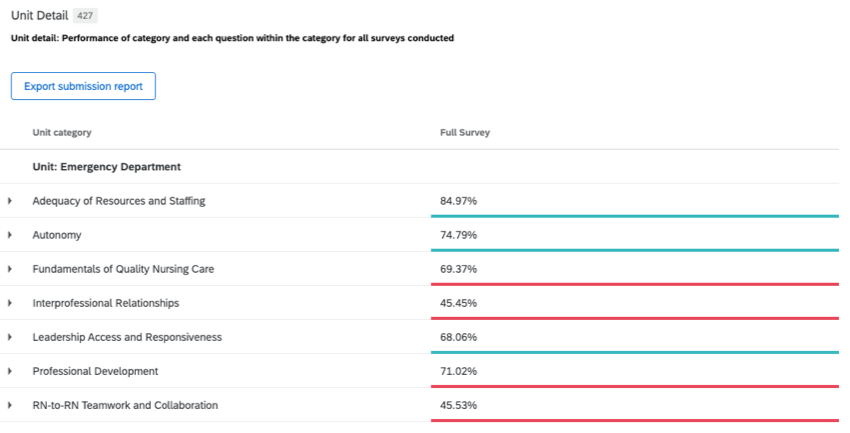
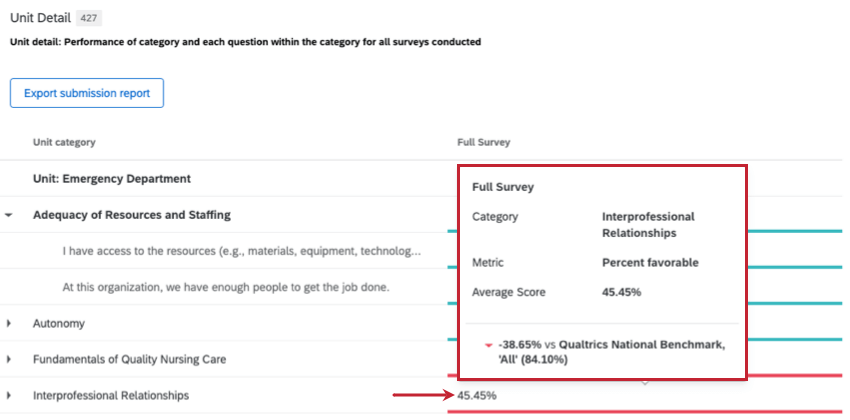
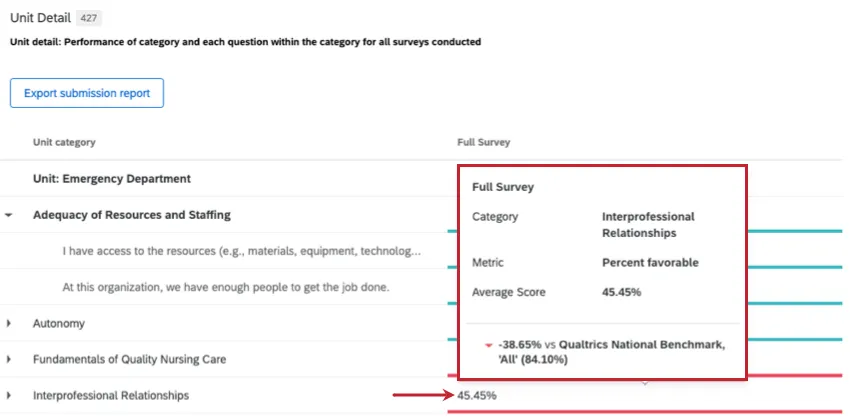
The Unit detail table view displays a list of all questions in each category and performance for each distributed survey. Green indicates the score is outperforming the benchmark, and red indicates it is scoring below the benchmark.
Hover over a specific score to display additional information.
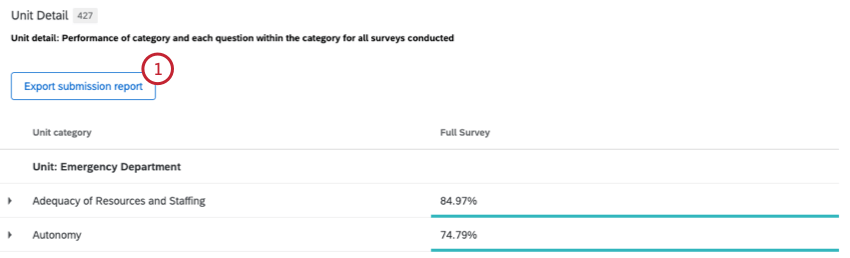
Export Submission Report
You can export a PDF of the RN Satisfaction widget’s data.
The submission report can be exported from both the Location Summary and Unit Detail widget views.
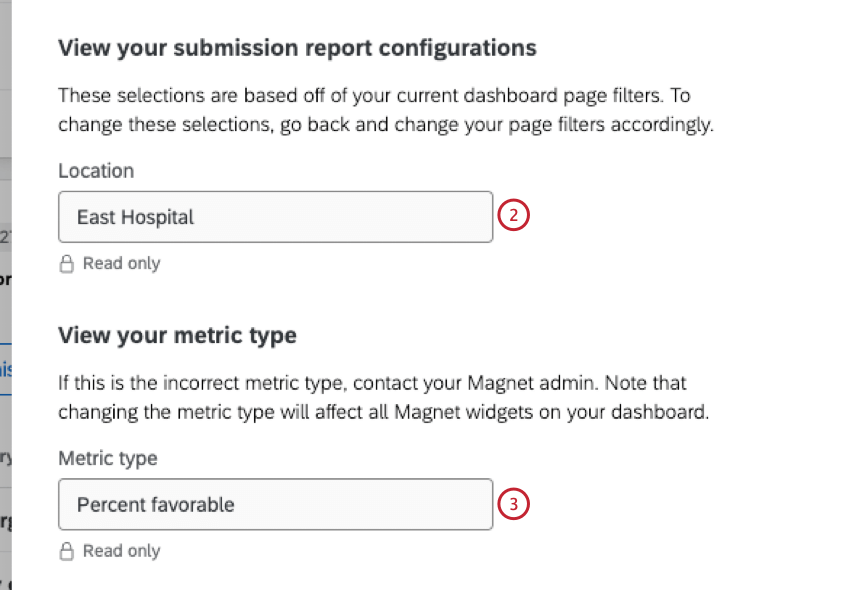
Qtip: If a different metric is preferred, please reach out to your Technical Success Manager. Please keep in mind that changing the metric will change all the values in the widget.
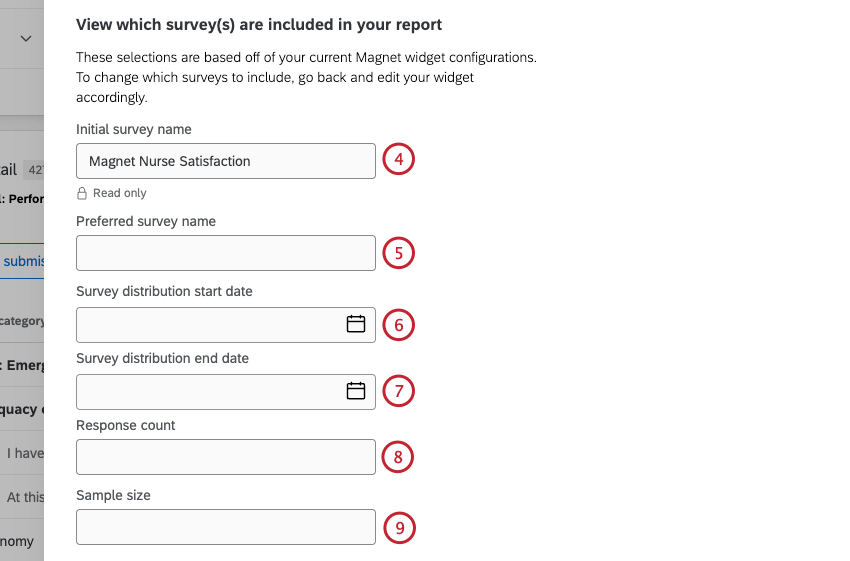
Qtip: The RN Satisfaction widget can display data from multiple surveys, such as an initial RN Satisfaction survey and additional Pulse surveys. Complete steps 4-9 for each survey that will be included in the submission report.
Qtip: If you’d like to switch to a different metric, we recommend reaching out to your Technical Success Manager. Please keep in mind that changing the metric will change all the values in the widget.
Qtip: Including full and pulse survey references within the preferred survey names (e.g. Initial RN Satisfaction Survey_Fall 2023, Pulse RN Satisfaction Survey_Spring 2024) is recommended.
Warning: If there’s ever an issue with the export, the export will stop and display an error message. If you encounter this, please try to export the report again later, or reach out to your Technical Success Manager.
EXAMPLE EXPORT
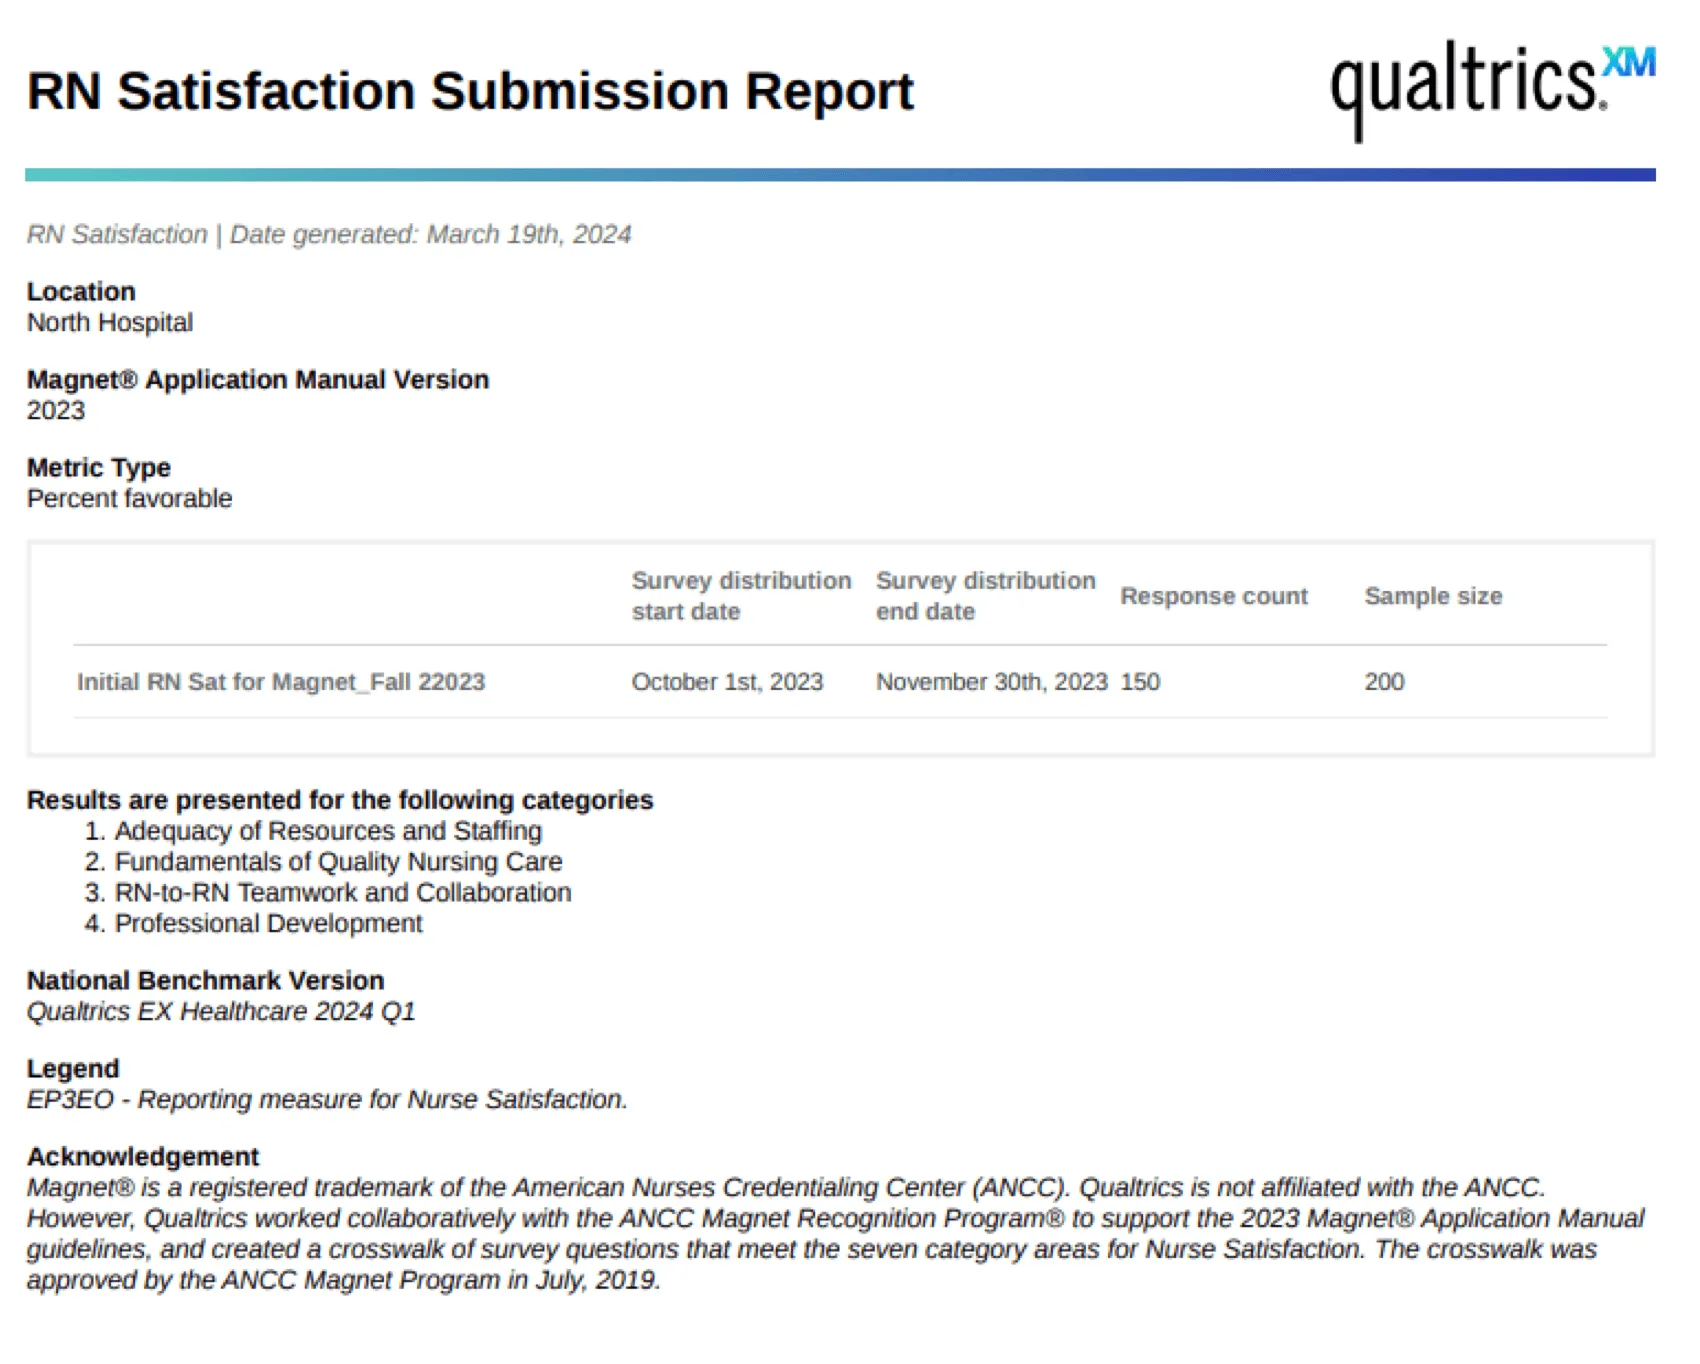
Here is an example of a title page in the export. You will see all the information you confirmed during export, such as location, date range, metrics, and the selected categories.
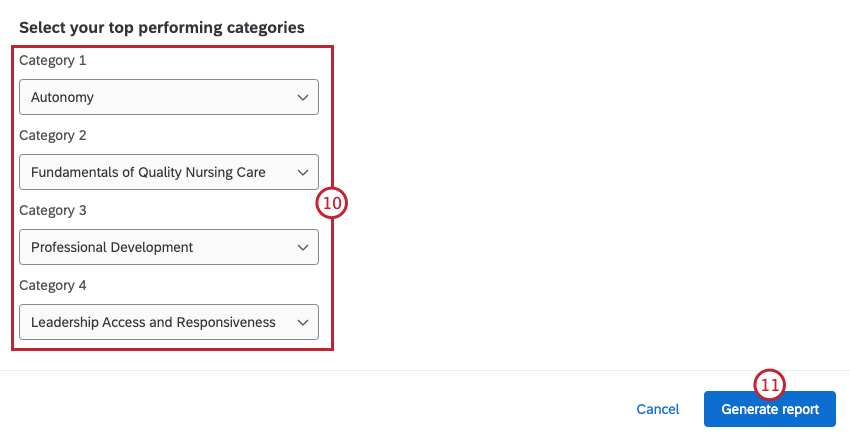
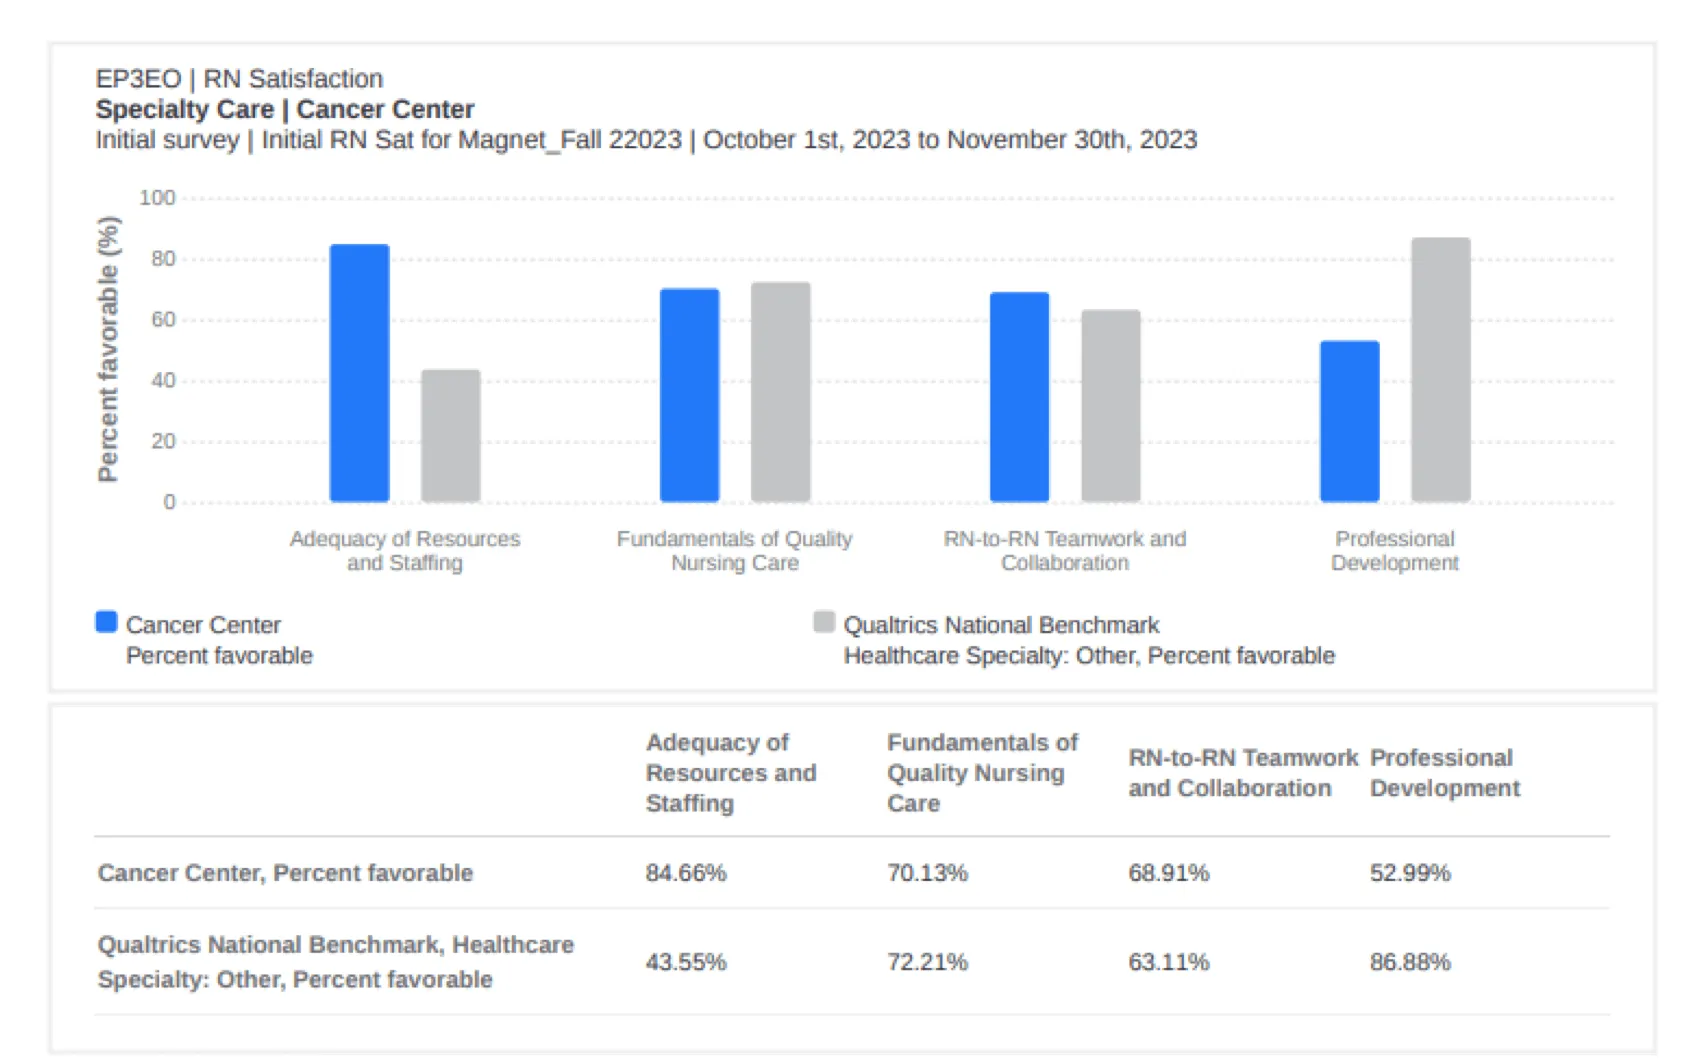
The report includes a graph and table for each unit, organized by the 4 categories selected. Each graph and table reflect the unit’s performance against a national benchmark in the categories selected for each unit and survey within the reporting period.
Qtip: If there is not enough survey data for the category, a notation will be included in the graph and table.
Dashboard Requirements
To successfully display RN Satisfaction reporting data, make sure the dashboard adheres to the following requirements:
- Response minimums: Questions must meet the confidentiality threshold to be displayed in the RN Satisfaction dashboard. The performance score for any question with fewer responses than the confidentiality threshold will not be displayed in the dashboard.
- Filter limits: When filtering the dashboard, make sure only 1 location is selected. RN Satisfaction widgets will not load if more than 1 location is selected.
Methodology: About the Magnet Recognition Program®
The Magnet Recognition Program® designates organizations worldwide where nursing leaders successfully align their nursing strategic goals to improve the organization’s patient outcomes. The Magnet Recognition Program® provides a roadmap to nursing excellence, which benefits the whole of an organization.
A Magnet® designated hospital is stated to be one where nursing delivers excellent patient outcomes, nurses have a high level of job satisfaction, and there is a low staff nurse turnover rate and appropriate grievance resolution.
Attention: Magnet® is a registered trademark of the American Nurses Credentialing Center (ANCC). Qualtrics is not affiliated with ANCC, however Qualtrics worked collaboratively with the ANCC Magnet Recognition Program® to support the 2023 Magnet® Application Manual guidelines and created a crosswalk of survey questions that meet the nine category areas for patient experience with nursing and seven category areas for nurse satisfaction. The crosswalk was approved by the ANCC Magnet Program in July 2019.
Additional Options
Click the 3 horizontal dots in the top-right corner of the widget and select View data to view a table containing all data within the widget.

That's great! Thank you for your feedback!
Thank you for your feedback!