
Enhanced Confidentiality for Filters and Breakouts (EX)
What's on this page
About Confidentiality for Filters and Breakouts
Qtip: Confidentiality used to be called Anonymity.
Enhanced confidentiality adds additional protections that can improve confidentiality under filters and breakouts. By flagging fields as sensitive, you can determine what information can be used to identify participants. Data from sensitive groups that don’t meet the confidentiality threshold is combined with the next smallest group to hide their answers when breaking out data or using filters; this prevents viewers from calculating hidden scores.
Example: If your threshold is 5 and you have 5 responses, and if Gender is an identifiable field, then you could not see that 3 responses are from males and 2 are from females, and you could only see a score for all 5 together.
Qtip: Confidentiality is available in Engagement, Lifecycle, Pulse, and Ad Hoc Employee Research projects. It is included in all EX licenses.
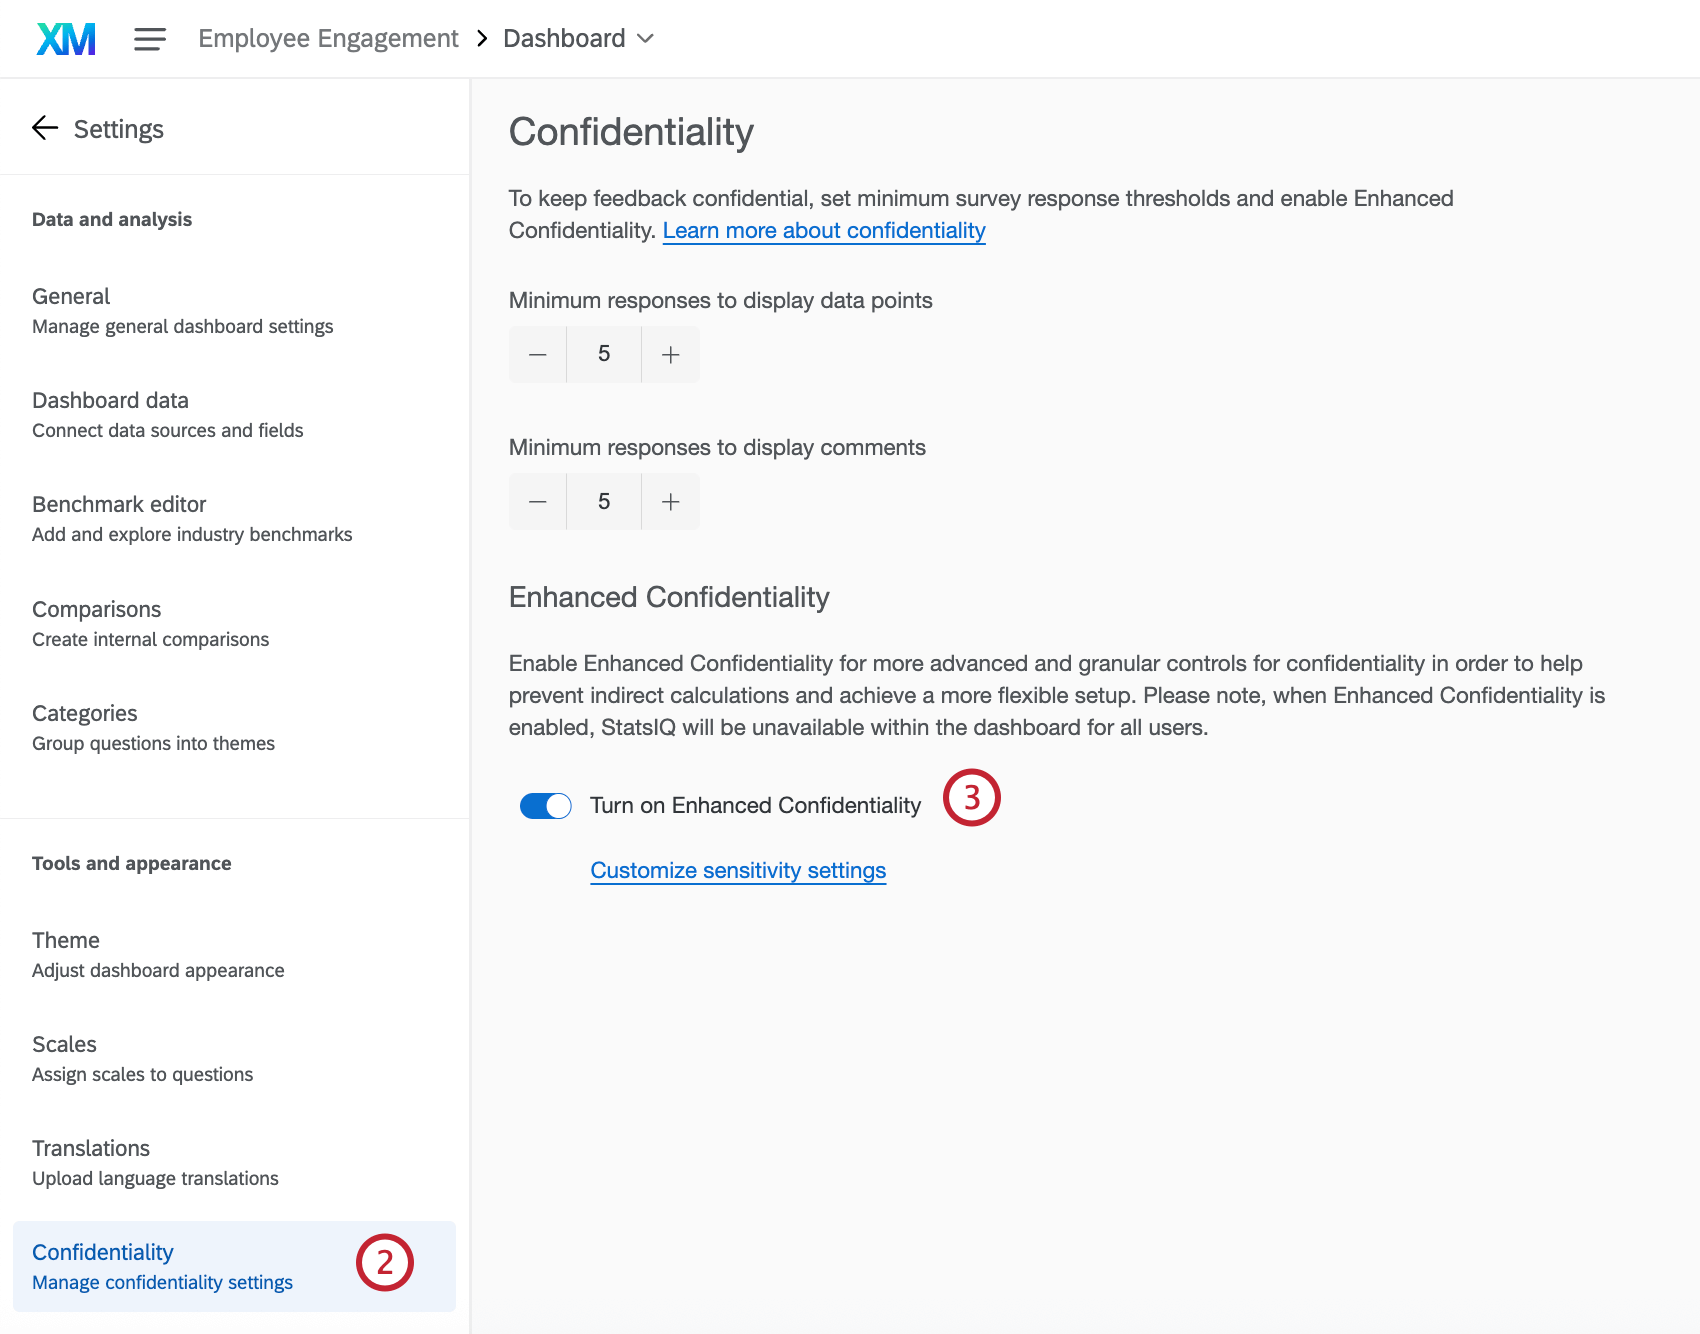
Attention: The Confidentiality tab in dashboard settings is only available for Brand Administrator, EX Administrator, and Employee Insights Admin user types.
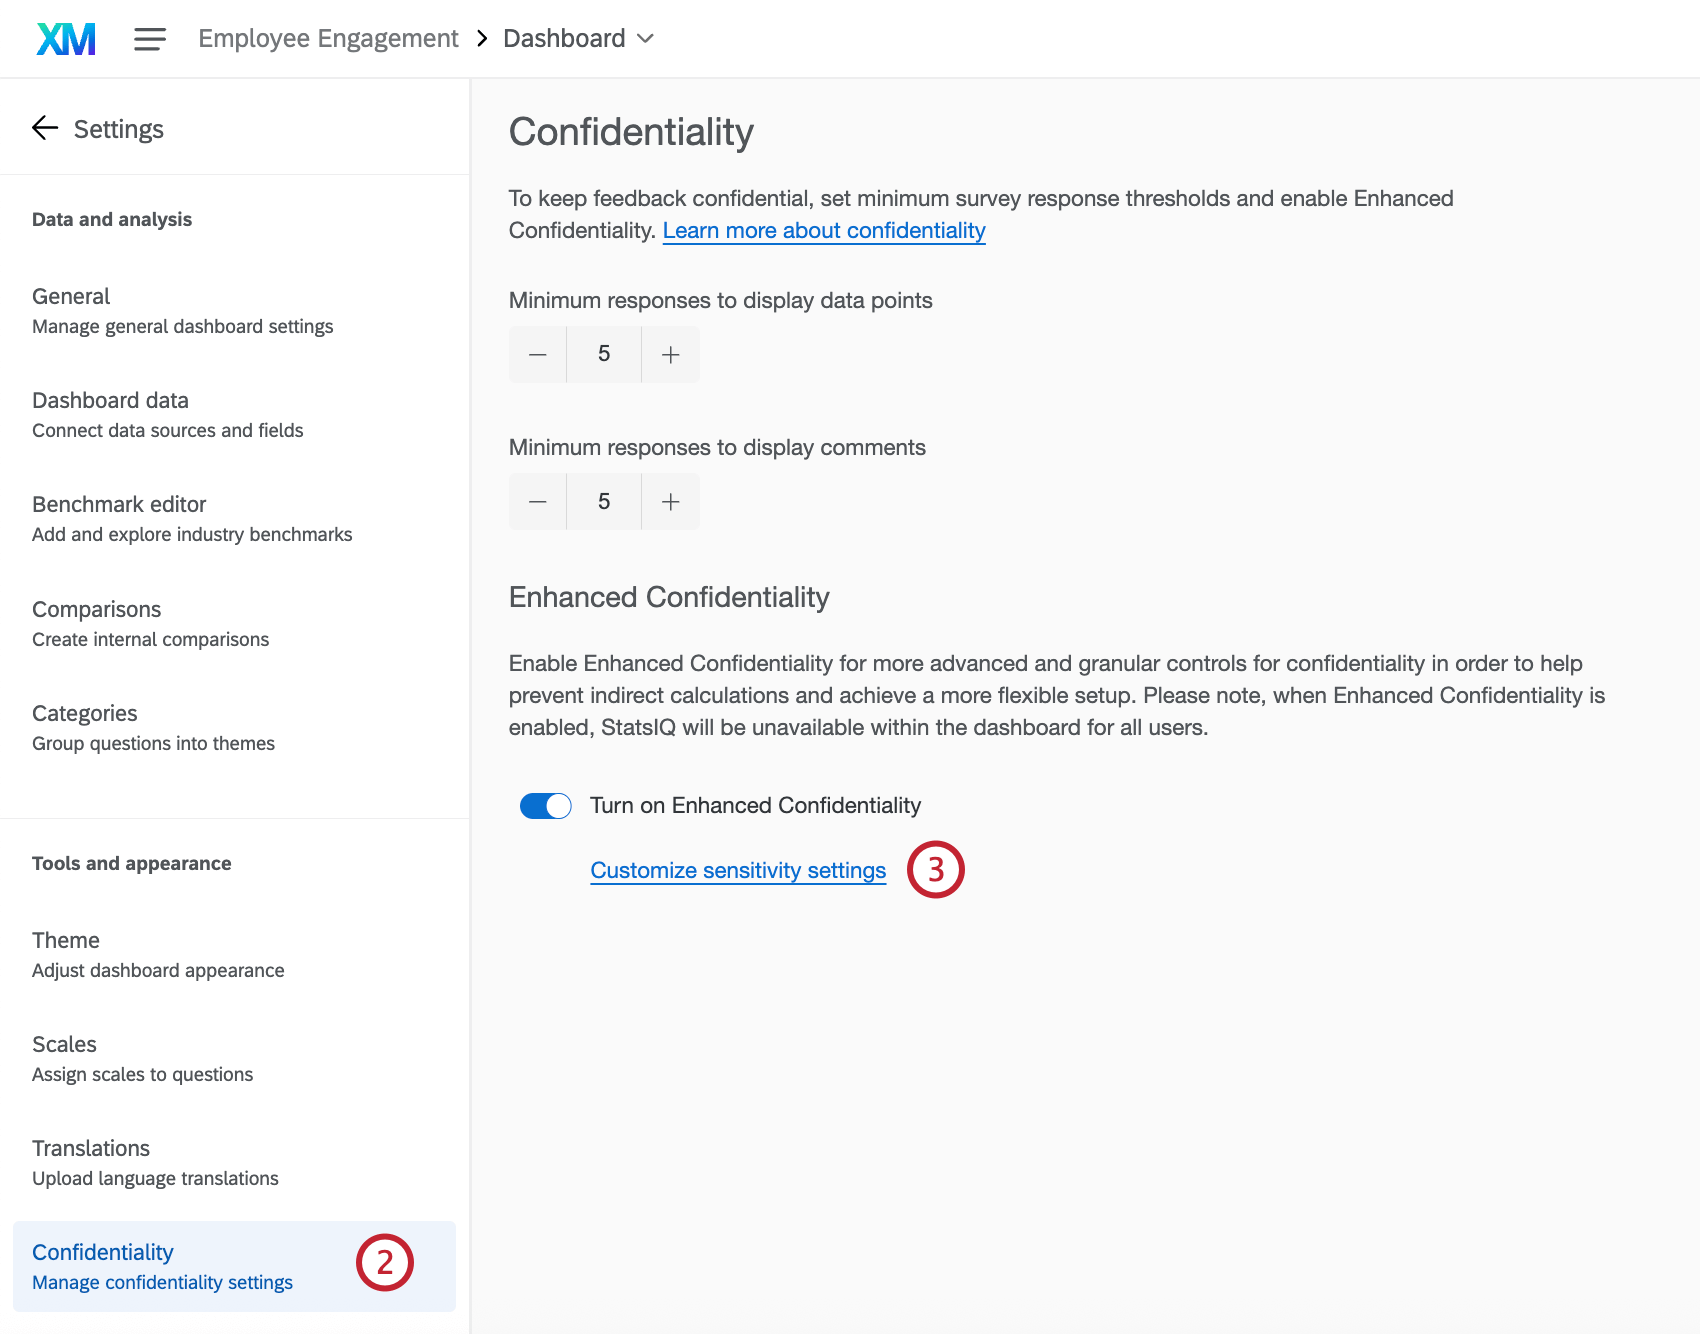
Enabling Enhanced Confidentiality
Enhanced confidentiality can be turned on and off at the level of the dashboard to improve confidentiality.
For example, let’s say Barnaby’s team has 15 people. When we look at the engagement scores for his team, we don’t really know how each team member responded to questions about their manager’s effectiveness. However, let’s say there are only 2 women on his team. Regular confidentiality thresholds will ensure we can’t see the women’s responses directly, however, if we add a gender filter, we can make a pretty good guess what each of the women on his team had to say. Enhanced confidentiality senses disparities of this kind. It ensures that data from groups that don’t meet the confidentiality threshold is combined with the next smallest group to hide their answers when breaking out data or using filters.
Attention: When using multiple filters or breakouts along with filters, enhanced confidentiality will not be able to protect against all indirect-calculation scenarios. This is because enhanced confidentiality cannot predict all possible combinations of filters and breakouts.
Field-Level Settings
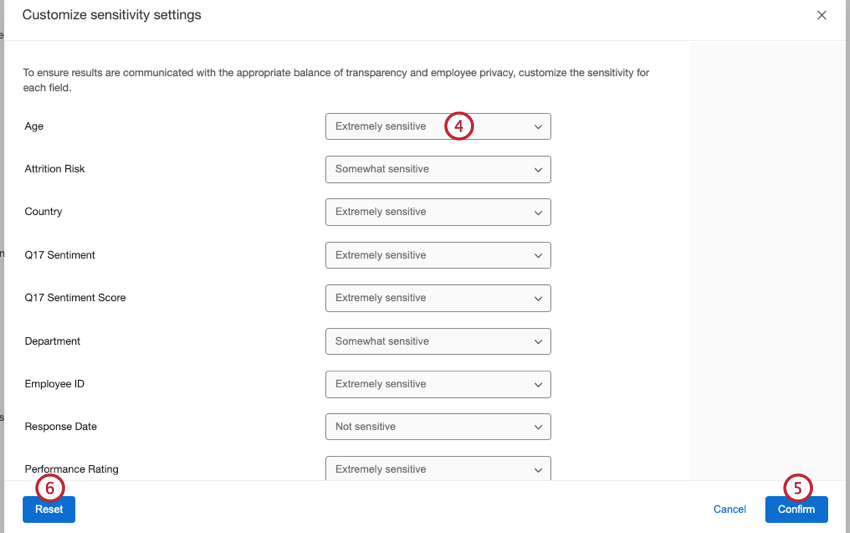
When you have enhanced confidentiality enabled, you can customize the level of confidentiality for each field in your dashboard by marking fields as Extremely sensitive, Somewhat sensitive, or Not sensitive. This changes the way breakouts are treated and displayed in widgets, and allows you to group data points below the response threshold on some fields while hiding data points below the response threshold on others.
There may be some dashboard fields participants can be identified by, which should be considered sensitive and should be marked extremely sensitive or somewhat sensitive, while fields that are not sensitive should be marked not sensitive. For example, tenure, gender, and the team to which someone belongs can all be used to figure out who they are. However, questions asked in an Employee Experience survey are almost always not sensitive, with the exception of demographic questions like language, location of office, and age.
When fields are marked extremely sensitive, the data from groups that do not meet the confidentiality threshold will be combined with the next smallest group in order to protect the identities of the respondents. When fields are marked as somewhat sensitive, their data from groups that do not meet confidentiality anonymity threshold will not be displayed. When fields are marked as not sensitive, grouping will not happen unless you filter or break out by a sensitive field.
Attention: The confidentiality threshold will not apply when breaking out over fields marked as Not sensitive.
Qtip: Open text fields cannot be marked as Extremely sensitive, Somewhat sensitive, or Not sensitive. Instead, open text fields can only be controlled by Minimum responses to display comments.
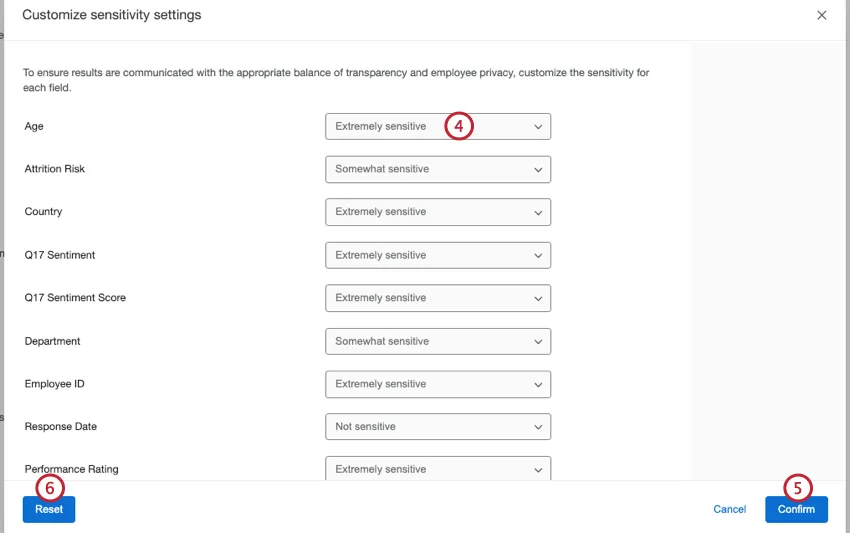
To edit which fields are sensitive and which are not, you will want to do the following:
- Extremely sensitive: These fields contain information that will identify participants. When a data point falls below the response threshold, enhanced confidentiality settings apply and data will be grouped with the next smallest data point(s). These fields were previously called identifiable fields. Qtip: All metadata fields are marked as extremely sensitive by default.

- Somewhat sensitive: These fields contain information that may identify participants. Data points that fall below the response threshold will not be displayed, the same as with basic confidentiality. This option is useful for fields such as dates or time periods. Qtip: With this option it is still possible to figure out which participant provided a certain response; for more sensitivity, fields should be marked as extremely sensitive.
- Not sensitive: These fields do not contain information that can identify participants. All data points are shown even when responses fall below the response threshold. These fields were previously called non-identifiable fields. Qtip: All question fields are marked as not sensitive by default.
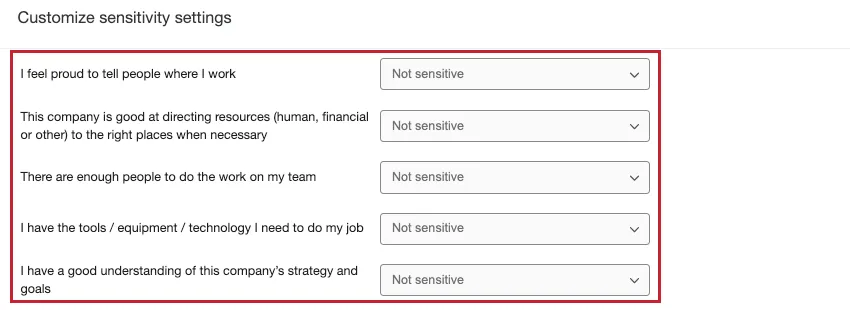
Example: In our dashboard, we did not mark engagement questions as identifiable, because they are not demographic and cannot be used to identify their respondents in any way.
Let’s say the dashboard’s threshold is 5. If we made a table displaying how employees responded to a non-identifiable field like “I feel proud to tell people where I work,” answers will not be grouped. See below how “Strongly Disagree” appears, although it only has 1 response.
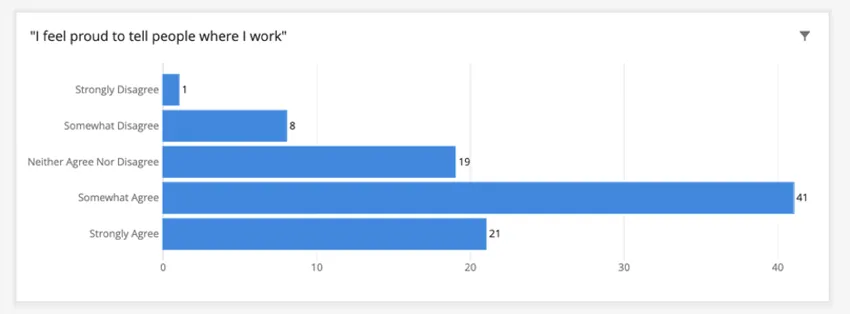
Note that the total number of responses in the widget must still meet the threshold. This graph has a total of 90 responses. If it had fewer than 5, the graph would be blank because the default behavior of the confidentiality threshold is to hide data from widgets that do not meet the threshold.
Field Interactions
If you are using a table or chart to display an extremely sensitive or somewhat sensitive field with a not sensitive field, your data should be grouped the same way either way you transpose the data. Grouping logic is applied consistently based on the field settings, no matter which field is configured as a row or column.
Warning: When you display 2 extremely sensitive fields in the same widget, the data may not transpose symmetrically.
Setting the Dashboard Data Source(s)
When using Enhanced Confidentiality, if you are also using historical sources in your dashboard, it’s important to go to general dashboard settings and limit page filters by the current year’s data.
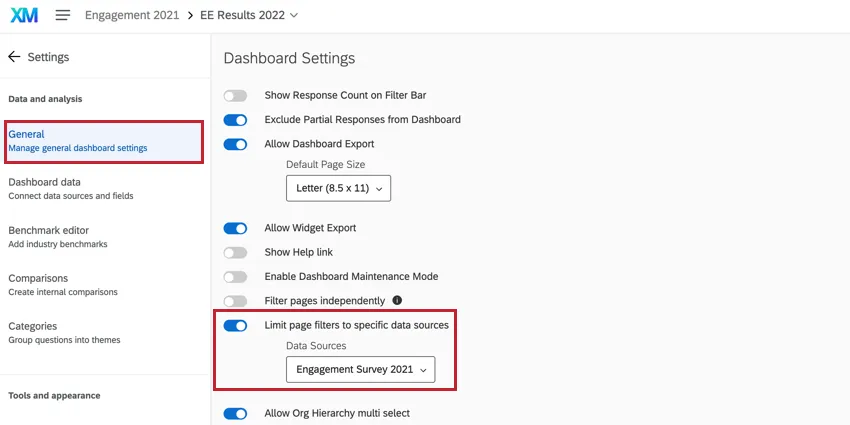
Otherwise, dashboard filters, except the Org Hierarchy filter, which will default to the primary data source, will include data from all data sources in the dashboard data. This means historical data may be included in response counts, and can skew confidentiality groupings. For example, if current and historical results are counted for a small team rather than just the current year’s results, the small team seems bigger than it really is, and may not fall below the confidentiality threshold. Limiting the filters to the primary data source (i.e., the current project or current year’s data) resolves this issue.
Filter Behavior
Qtip: This only applies to enhanced confidentiality.
Once you’ve enabled enhanced confidentiality and added a filter to your dashboard, your confidentiality settings will determine how filters behave.
Page filter behavior depends on the field-level setting for each field:
- Not sensitive fields: These fields allow you to select any value, even if it is below the threshold.
- Somewhat sensitive fields: These fields only allow you to select values that meet or exceed the threshold.
- Extremely sensitive fields: These fields group any values below the threshold. Results below the threshold will be combined with the next smallest option in the filter before any selections are made. If you have just 1 group that falls below the threshold, this will be combined with the next smallest group, regardless of whether the next group meets the threshold or not. This is to ensure that even if only 1 group doesn’t meet the threshold, their data is protected.
As filters are added or removed, enhanced anonymity will take these into account and change the groupings accordingly.
Example: In the screenshot below, we are trying to filter by department. This is a small company, so Finance, Support, and Human Resources have very small teams, below the confidentiality threshold we have set.
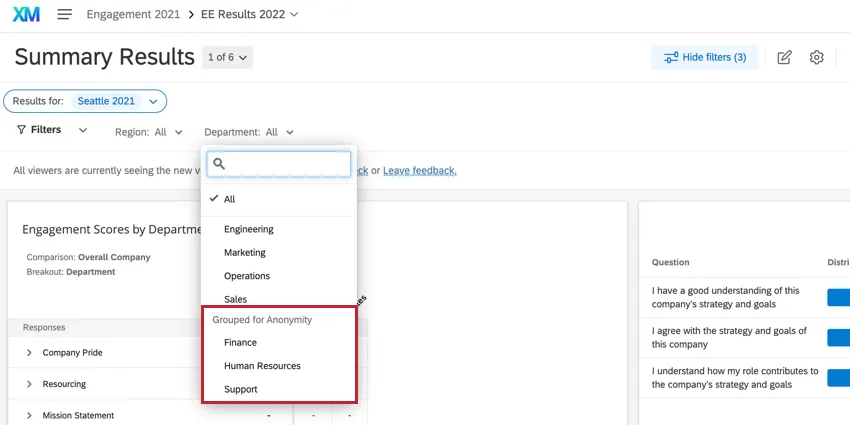
You’ll see that Finance, Support, and Human Resources are under the header Grouped for Anonymity. If I try to select just one, they will both automatically be selected. If I try to deselect one, both are deselected. This prevents users from figuring out the values of below-threshold groups.
Org Hierarchy Filters
Org hierarchy units that do not meet the confidentiality threshold will be grayed-out and have a lock icon next to them. You will not be able to select any units that do not meet the confidentiality threshold. This is to protect the anonymity of respondents.
Qtip: The org hierarchy filter uses the data source setting (if set) to determine which units to gray out. If the data source setting is not set, the default setting will be the primary source (instead of all data sources in the dashboard), which can cause a unit to be grayed out unexpectedly.
Breakout Behavior
Qtip: This only applies to enhanced confidentiality.
When enhanced confidentiality is enabled, the field-level settings for each field determine how data will be displayed in widgets where data has been broken out into certain groups. This includes line widgets where an x-axis dimension has been defined, widgets with comparisons added to them, demographic breakout widgets, heat map widgets, and any other widget configuration that isolates groups that may be smaller than the Confidentiality Threshold.
- Not sensitive fields: These fields will show all data points (metrics and counts), even if they are below the threshold.
- Somewhat sensitive fields: These fields will only show data points (metrics and counts) that meet or exceed the response threshold.
- Extremely sensitive fields: These fields will group any data points (metrics and counts) below the threshold.
The exceptions to this rule include widgets broken out by org hierarchy. Some widgets (heat map, demographic breakout) support a One Level Below breakout that shows data for each child unit of the currently selected unit in the org hierarchy filter. Other widgets (response rates, comparison, bubble chart) support drilling down into the hierarchy, showing data for each unit and allowing the user to select them. For any widget broken out by org hierarchy, Enhanced Anonymity is not applied. This means no units will be grouped for anonymity.
If you were to change the metric to an average engagement score or an NPS, enhanced anonymity would prevent you from figuring out the smallest office’s data by not allowing dashboard users to isolate that office’s data. This is useful in cases where, for example, we do not want the ratings of each member of the smallest office to be easily calculated.
Example:
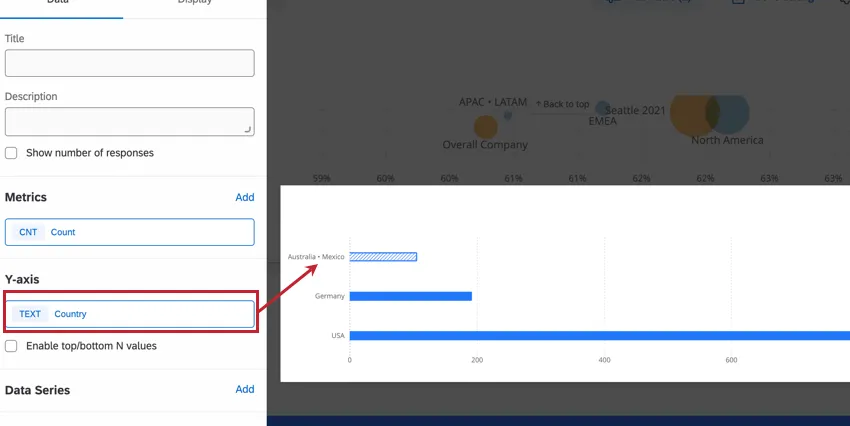
In the following example, our dashboard has an confidentiality threshold set for the “country” field to help protect responses from employees in small offices. In the widget below, we have set the y-axis dimension of a bar chart to be the country where the employee’s office is located. Australia and Mexico have very small offices, below the confidentiality threshold we’ve set. As a result, their responses have been combined.
If you were to change the metric to an average engagement score or an NPS, enhanced confidentiality would prevent you from figuring out the smallest office’s data by not allowing dashboard users to isolate that office’s data. This is useful in cases where, for example, we do not want the ratings of each member of the smallest office to be easily calculated.
Multiple Breakouts
Some widgets break out on multiple dimensions – for example, line and bar widgets let you add both an x-axis value and a data series, and tables let you add both rows and columns.
The more you break out data, the smaller each category can get, and the more categories that get grouped together under confidentiality. And because there are now 2 dimensions to the breakout, there may be different combinations of categories that need to be grouped together for confidentiality. Thus, categories grouped for confidentiality will be labeled Grouped for Anonymity, and you can hover over them to determine what specific categories were grouped.
You’ll also notice that in the legend, confidentiality groups are labeled as Grouped for Anonymity, not a compound name. This is to take into account how groupings might change based on how multiple breakouts interact, and to prevent labels that are too long.
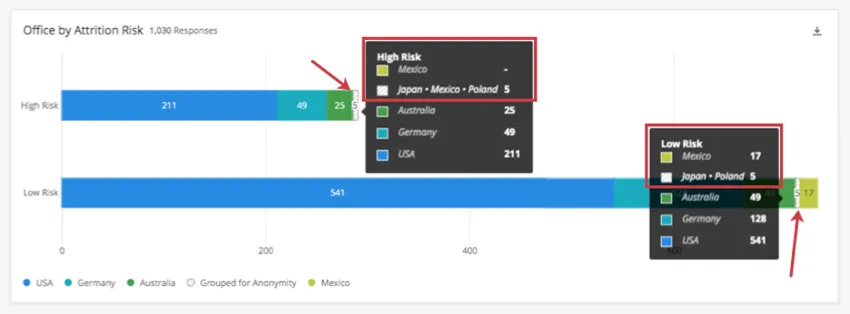
Example: This dashboard has a threshold of 5. In the graph below, we broke out the countries our employees work in by attrition risk. We can see a light green block for Mexico in the Low Risk bar, but not in the High Risk bar.
When we highlight the Grouped for Anonymity blocks for each bar, we discover that there’s a difference: Mexico was grouped with Japan and Poland in the High Risk bar, but only Japan and Poland were grouped in the Low Risk bar.
Look at the screenshot below. In High Risk, Mexico has no individual data ( – ), but Japan + Mexico + Poland shows data, since these are grouped together for anonymity (5). Under Low Risk, Mexico meets the threshold, so it does not need to be grouped, and shows individual data (17), while Japan + Poland are grouped together (5).
Basic Confidentiality
If you’re breaking out data by 2 or more fields with basic anonymity, each of the breakout fields will be considered separately. When breaking out data on multiple fields, metrics and count data points below the threshold will be hidden.
Basic confidentiality will not count responses without value (empty/null) when comparing response count against confidentiality threshold. This is to protect cases where a survey taker who might not be eligible to answer a question (e.g. survey logic says only managers can answer a question) have their responses counted against the confidentiality threshold.
Enhanced Confidentiality
Enhanced confidentiality counts responses without values (empty/null) when comparing response count against confidentiality threshold.
Multi-field breakout behavior depends on the field-level settings for the 2 fields involved. This table shows how data will be hidden for double breakouts between different field types.
| Not Sensitive | Somewhat Sensitive | Extremely Sensitive | |
|---|---|---|---|
| Not Sensitive | All data points (metrics and counts) will be shown. | Values from the somewhat sensitive field will be hidden if they are below the threshold. | Values from the extremely sensitive field will be grouped if they are below the threshold. |
| Somewhat Sensitive | Values from the somewhat sensitive field will be hidden if they are below the threshold. | All data points (metrics and counts) below the response threshold will be hidden. | Values from the somewhat sensitive field will be hidden if they are below the threshold and values from the extremely sensitive field will be grouped if they are below the threshold. |
| Extremely Sensitive | Values from the extremely sensitive field will be grouped if they are below the threshold. | Values from the somewhat sensitive field will be hidden if they are below the threshold and values from the extremely sensitive field will be grouped if they are below the threshold. | Data points below the response threshold will be grouped. |
Response Rates Behavior
Response rates display how many responses you received, and what percentage of your participant list has completed the survey. This kind of data is reported by participation summary and response rate widgets.
By default, the dashboard considers response rates to be sensitive information. This means response rate data can be used to identify participants, and so to protect your participants, response rates are subject to being grouped by confidentiality.
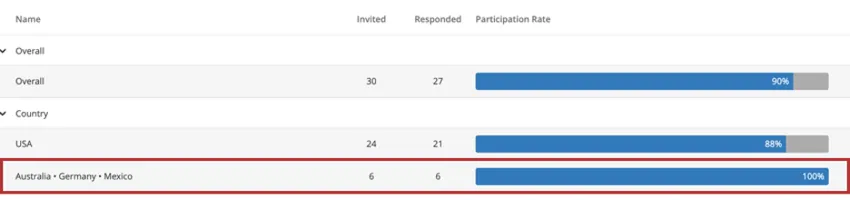
Example: When you create a response rate widget, you can add a field to break out the widget. Below, we have broken out our response rates by country, which has resulted in Australia, Germany, and Mexico being grouped for confidentiality.
Thus, response rate widgets display the same breakout behavior other widgets do. If the response count is below the threshold, you will not see data in the participation summary widget.
Qtip: “Response Rates” is not an available field in the dashboard settings’ Confidentiality page; thus, you cannot turn this behavior off.
Qtip: Confidentiality is based on the responded counts, not the invited counts. Invited counts are known independently – i.e., a manager knows how many direct reports are on their team – and so the invited counts themselves do not need confidentiality protections the way responded counts do. However, enhanced confidentiality does not acknowledge expected count; so if there are anonymous link responses, the count will not adjust.
When enhanced confidentiality is enabled, response rates behavior depends on the field-level setting for each field:
- Not sensitive fields: These fields show all data points, even if they are below the threshold.
- Somewhat sensitive fields: These fields only show data points that meet or exceed the response threshold.
- Extremely sensitive fields: These fields group any data points below the threshold.
Attention: Confidentiality is not applied to response rates when enhanced confidentiality is disabled. This means that any data point, regardless of response count, will be shown.
FAQs
Why aren’t my filters showing “grouped for anonymity?”
Why aren’t my filters showing “grouped for anonymity?”
Why isn’t my widget grouping for anonymity?
Why isn’t my widget grouping for anonymity?
How is action planning affected by confidentiality settings?
How is action planning affected by confidentiality settings?
Action planning-specific fields, including the default ones listed here and any custom fields you create, cannot be marked sensitive.
You can create action plans based on any items you'd like on the action planning page. However, if confidentiality settings are hiding items from a widget, like a question list widget, you won't be able to create action plans for those items from the widget itself.
That's great! Thank you for your feedback!
Thank you for your feedback!