
Filtered Metrics (Studio)
What's on this page
About Filtered Metrics
Filtered metrics let you perform a calculation on a selected subset of data.
Example: You want to know the average number of responses from the city of Boston.
Example: You want to know the maximum satisfaction score for a given topic.
There are tons of calculations you can perform on your filtered data; these are just a few examples.
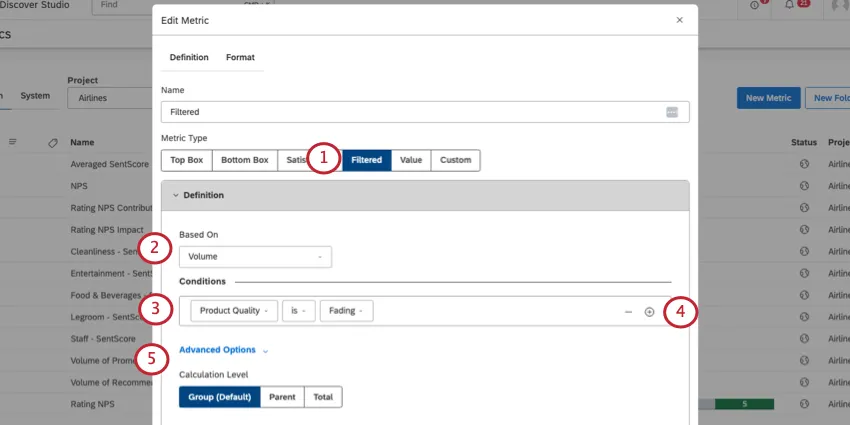
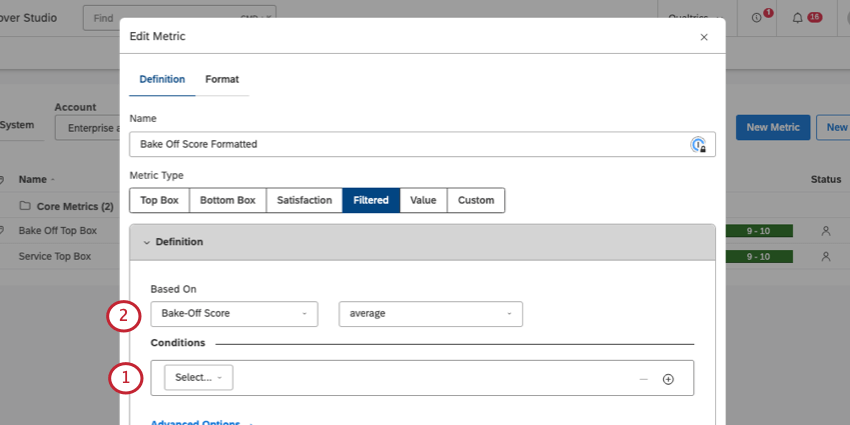
Defining a Filtered Metric
This section describes what you need to fill out in the Definition tab of your filtered metric.
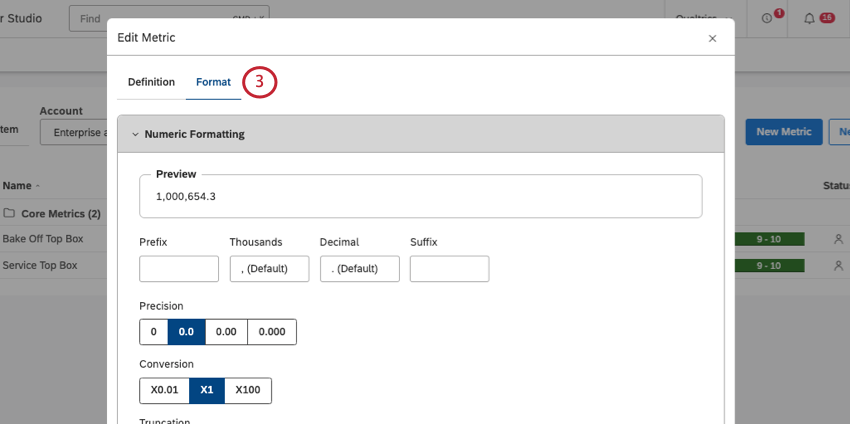
Qtip: For steps to create and format a metric, see Creating Metrics.
Qtip: Conditions work similarly to dashboard filters. Filter conditions have an AND relationship. Filter values in the same condition have an OR relationship.To understand how multiple conditions will be combined, see Applying Dashboard Filters.
- Group (Default): Calculate for the group defined in the Conditions section (step 3-4).
- Parent: Calculate for the defined group’s parent. If there is no parent, this is the same as total, below.
- Total: Calculate for the total number of records that match the widget’s conditions and filters. Qtip: % Parent and % Total calculations do not support Parent and Total calculation levels.

Qtip: For an example of using filtered metrics with different calculation levels, refer to Calculating a Group’s Contribution to Overall Scores (Studio).
Qtip: For examples of how to use filtered metrics, see Other Use Cases.
Calculations
You can choose to base your filtered metric on standard, metric, or attribute calculations.
Standard Calculations
Once you choose Standard, you can select from one of the following:
- Volume: Count the number of records from the dataset.
- Sentiment: Find the average sentiment of sentences from the dataset.
- % Total: Figure out what percent of the total data your filtered subset is. The following formula is used:
Percent Total = (Number of filtered records from the subset) / (Total number of records) - % Parent: Find the subset’s filtered volume percentage to the unfiltered volume of the group. The following formula is used:
Percent Parent = (Number of filtered records from the subset) / (Number of unfiltered records for the group)Example: Let’s say we have a metric that calculates percent parent for feedback from Boston. If we use it in a top 10 topics report, each topic’s value for the filter metric will be calculated as follows:
Percent Parent for Topic A = (Volume where CITY is Boston AND TOPIC is Topic A) / (Volume where TOPIC is Topic A)<./div> - Effort: Find the average effort score of sentences from the dataset.
Qtip: % Total and % Parent can have similar or different values, depending on the grouping applied to widget data. See Percent Parent and Percent Total for more examples and explanations of the differences between the 2.
Metrics
Select an existing metric to apply to your filtered data. You will not be able to select another filtered metric or a custom math metric.
Attributes
See Attributes.
Available Condition Types
You can create conditions for your filtered metrics based on the following kinds of data:
- Date Range
- Date Range (Pinned)
- Topics
- Attributes
- Saved Filters
To learn more about Date Range, Topic, Attribute, and Saved Filters, see Available Filter Types. You cannot create filtered metrics based on Text Filters.
Unlike the regular Date Range option, Date Range (Pinned) is not affected by the widget and dashboard date filters. The metric is calculated for a date range you specify here. The only exception is trend reports, where the metric is calculated for the intersection of the metric’s pinned date range and grouping date intervals.
Pinned date range metrics use the Document Date, the primary date field used in reports, trends, alerts, and so on. To use a date field other than Document Date, make a condition based on attributes instead.
Qtip: Only one date range condition can be used per filtered metric.
Other Use Cases
When you create a filtered metric, you’re not required to fill out the conditions. By leaving the conditions blank, you can use filtered metrics to adjust widgets in a number of ways you might not expect.
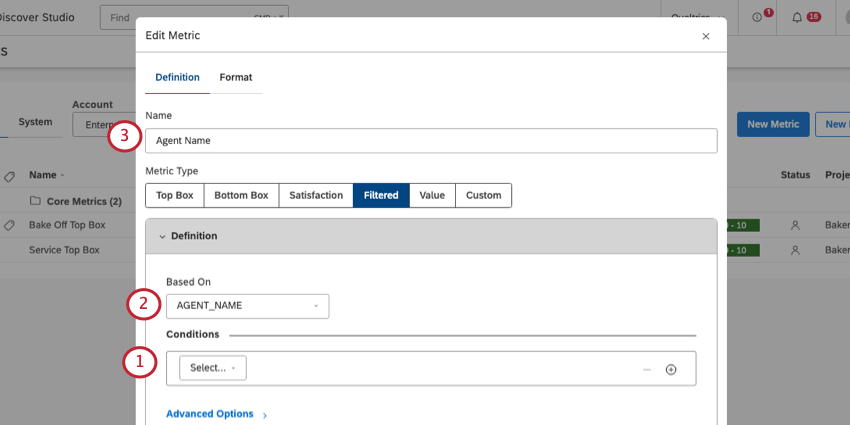
Renaming an Attribute
Sometimes you may want to label an attribute in a particular way in your dashboards. It’s easiest to rename the attribute, but if you don’t have project-level access in Designer, you can use a filtered metric instead.
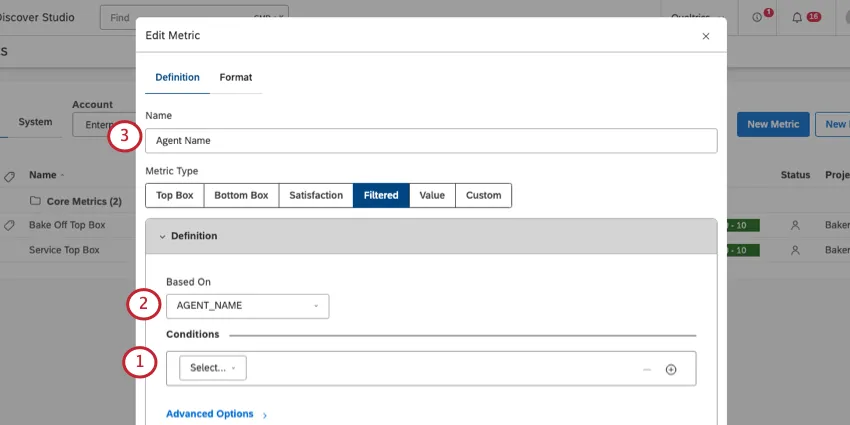
Example: Here, we rename the attribute AGENT_NAME to the more easily readable Agent Name.
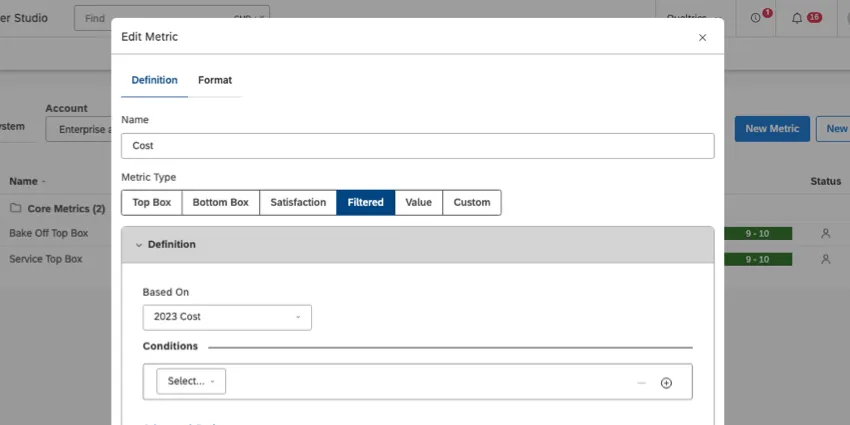
Creating a Placeholder for an Attribute
You can use a filtered metric as a placeholder for attributes and swap them out without having to directly edit your dashboards or widgets.
Example: You want to build reports based on the cost of a product, but this cost could change year to year. You create a placeholder filtered metric named Cost, and as the cost changes, you base it on the most updated version (e.g., 2023 Cost, 2024 Cost, etc.). This lets you update reports every year without having to remake dashboards or heavily edit them.
Changing the Default Formatting for an Attribute
You can use the Filtered metric to define default formatting for an attribute, so that you don’t have to adjust it in every widget you add it to.
Make sure to use the filtered metric in your widgets, not the original attribute!
FAQs
What is considered a "parent" when your Calculation Levels are set to Parent?
What is considered a "parent" when your Calculation Levels are set to Parent?
For examples and additional information, see Percent Parent and Percent Total.
That's great! Thank you for your feedback!
Thank you for your feedback!