
Text iQ Bubble Chart Widget (CX & EX)
What's on this page
About the Text iQ Bubble Chart Widget
Attention: This page is about the use of Text iQ bubble chart widgets directly inside a CX or EX Dashboard. While it works almost exactly like the Text iQ feature, the setup and location is different. You must have access to Text iQ in CX Dashboards to use it in CX Dashboards.
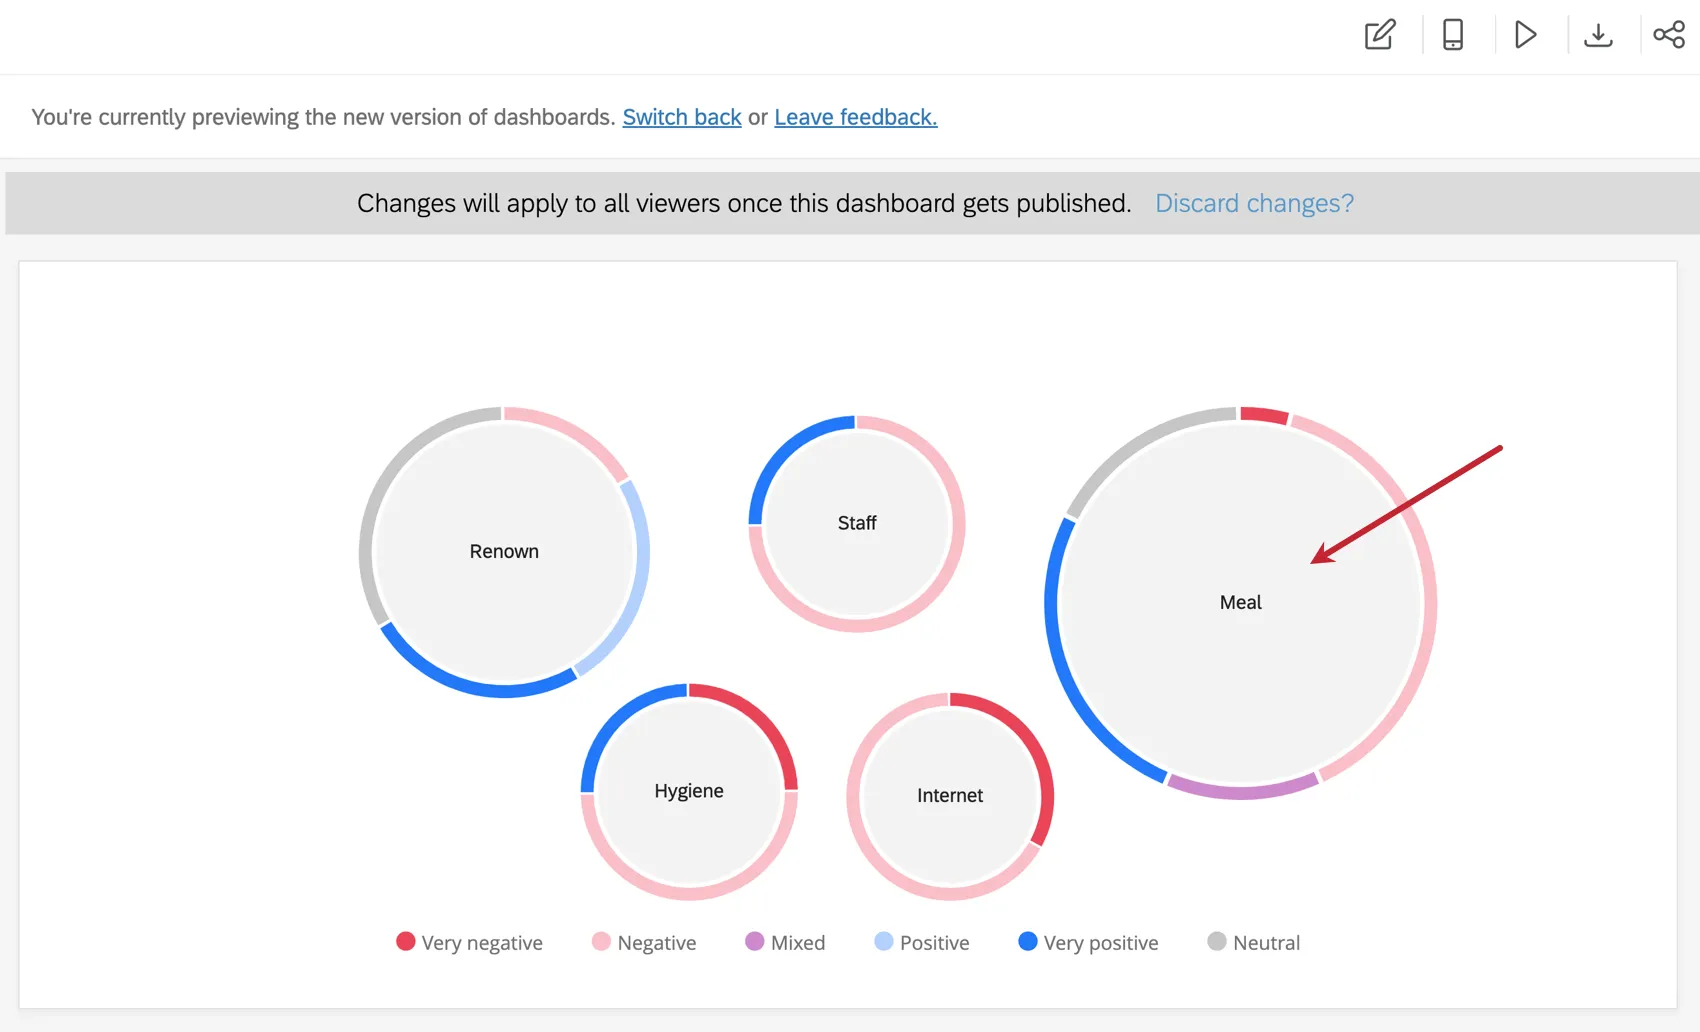
Text iQ bubble chart widgets provide a way to visualize the sentiment breakdown of each of the text topics you have analyzed. In CX Dashboards, these pull from the dashboard Text iQ tool; in EX dashboards, these pull from text analysis performed in the survey. Text iQ bubble chart widgets provide a great way to display common topics of feedback and customers’ feelings on those topics.
This page goes over the setup necessary to create a Text iQ bubble chart in your CX or EX Dashboard. To understand how to read a Text iQ bubble chart, see the Bubble Chart page from the Survey Platform. The interpretation of data is similar across all areas of the platform.
In-Dashboard Text iQ Setup
Before you use the Text iQ bubble chart, make sure you have the appropriate Text iQ data set up in your dashboard.
Qtip: This is how you set up the widget for CX Dashboards and Pulse projects.
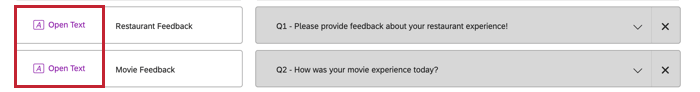
Step 1: Mapping Open Text
When adding a feedback source, whether it’s survey data or an imported CSV, make sure you change the feedback questions to the Open Text field type. For more information about field types, see Field Types & Widget Compatibility.

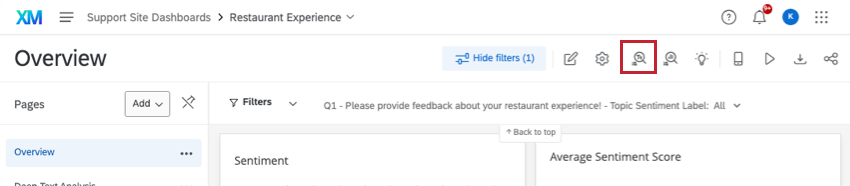
Step 2: Perform Text iQ in Dashboard
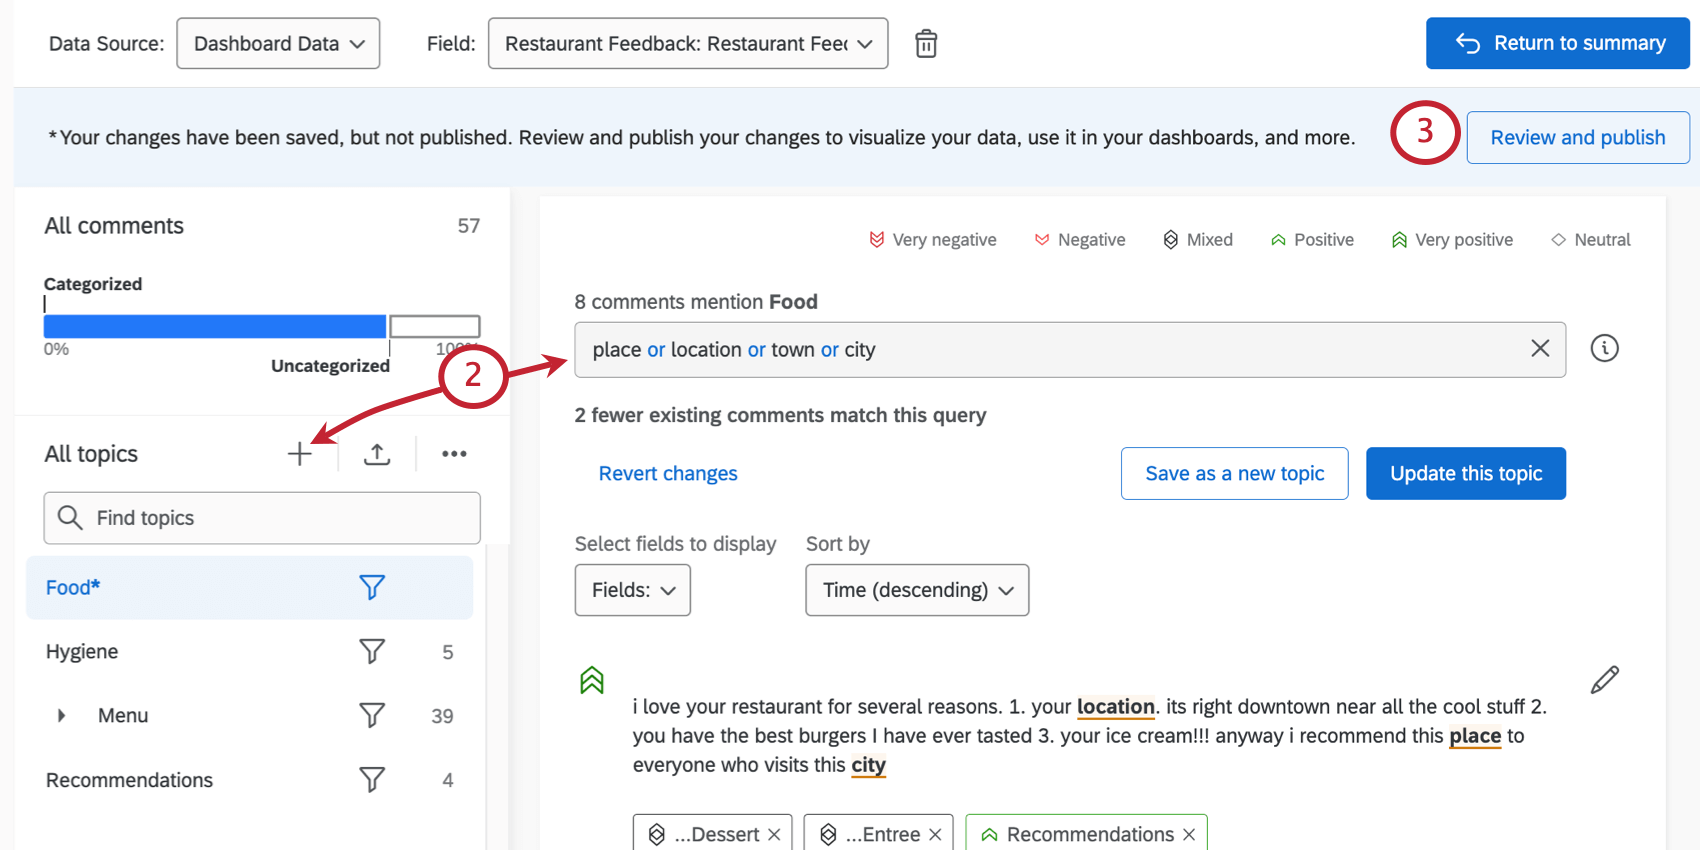
Before a Text iQ bubble chart can be generated in a CX Dashboard, it needs to have dashboard Text iQ data.
This will automatically create and map your Text iQ fields. Before you create a Text iQ bubble chart, you need topics, sentiment labels, and sentiment score to be mapped as multi-value text sets.
Qtip: Text iQ bubble chart widgets are only compatible with text analysis performed in the dashboard. Even if you have mapped survey text analysis to your dashboard, it cannot be used in these widgets.
EX Dashboard Text iQ Setup
Before you use the Text iQ bubble chart, make sure you have the appropriate Text iQ data set up for your project. Please note that Text iQ bubble charts only support basic confidentiality, not enhanced confidentiality.
Follow the below steps for dashboards in Engagement, Lifecycle, Ad Hoc Employee Research, and Employee Journey Analytics projects.
Attention: This is not how you set up this widget for a Pulse project. See previous section instead.
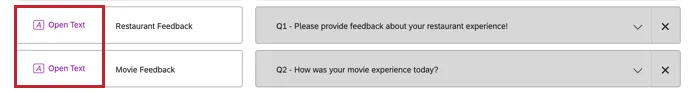
Step 1: Mapping Open Text
When adding a feedback source, make sure you change the field type to Open Text. For more information about field types, see Field Types & Widget Compatibility.
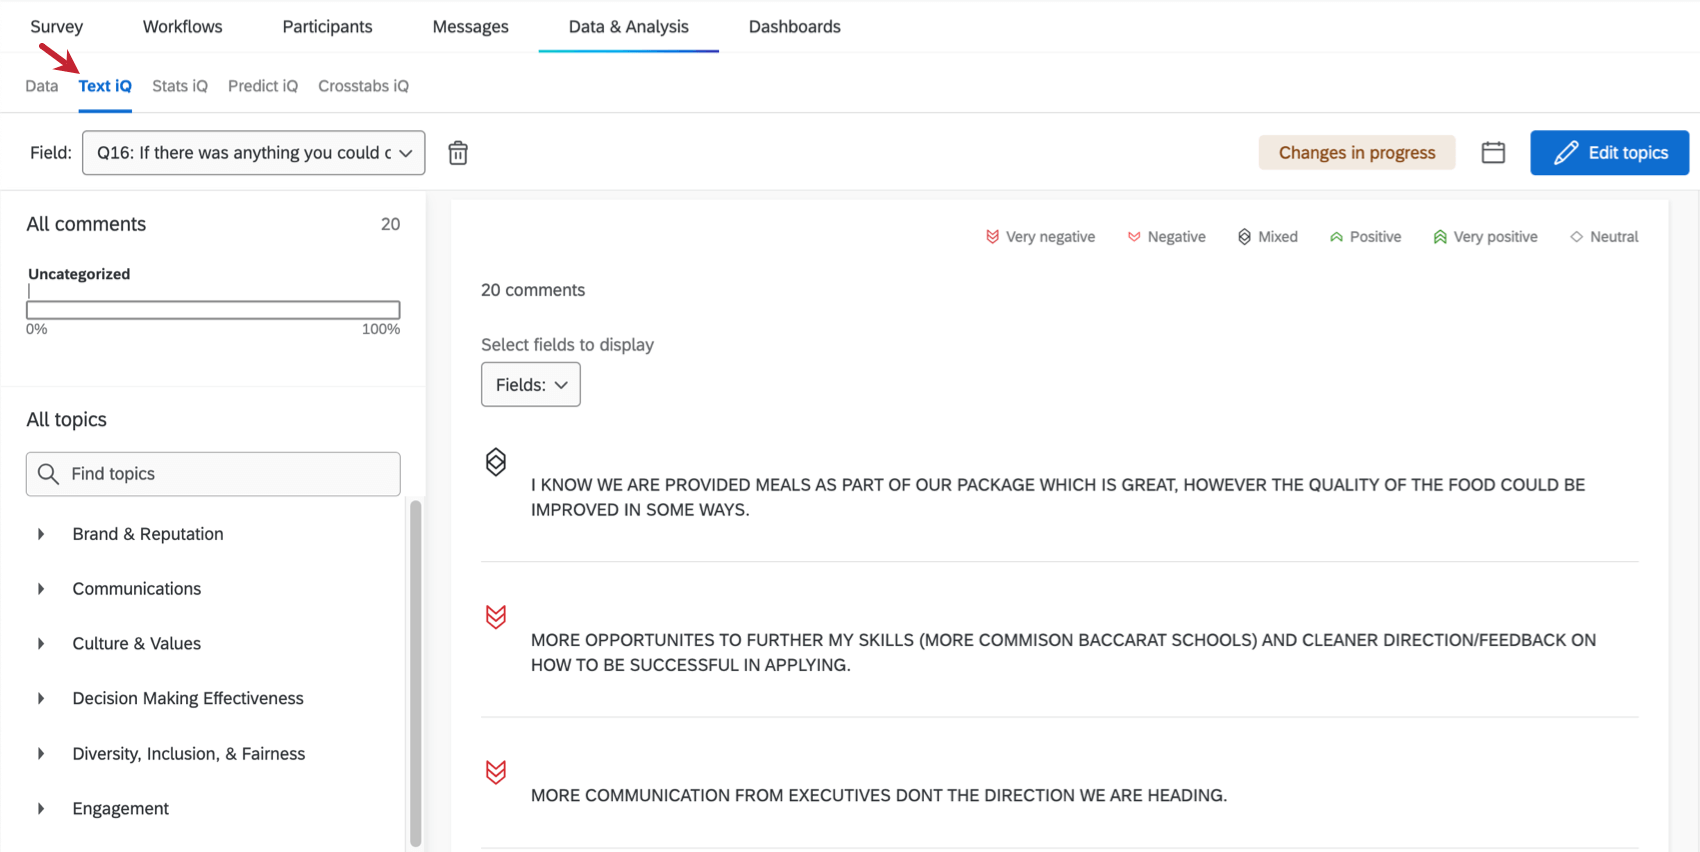
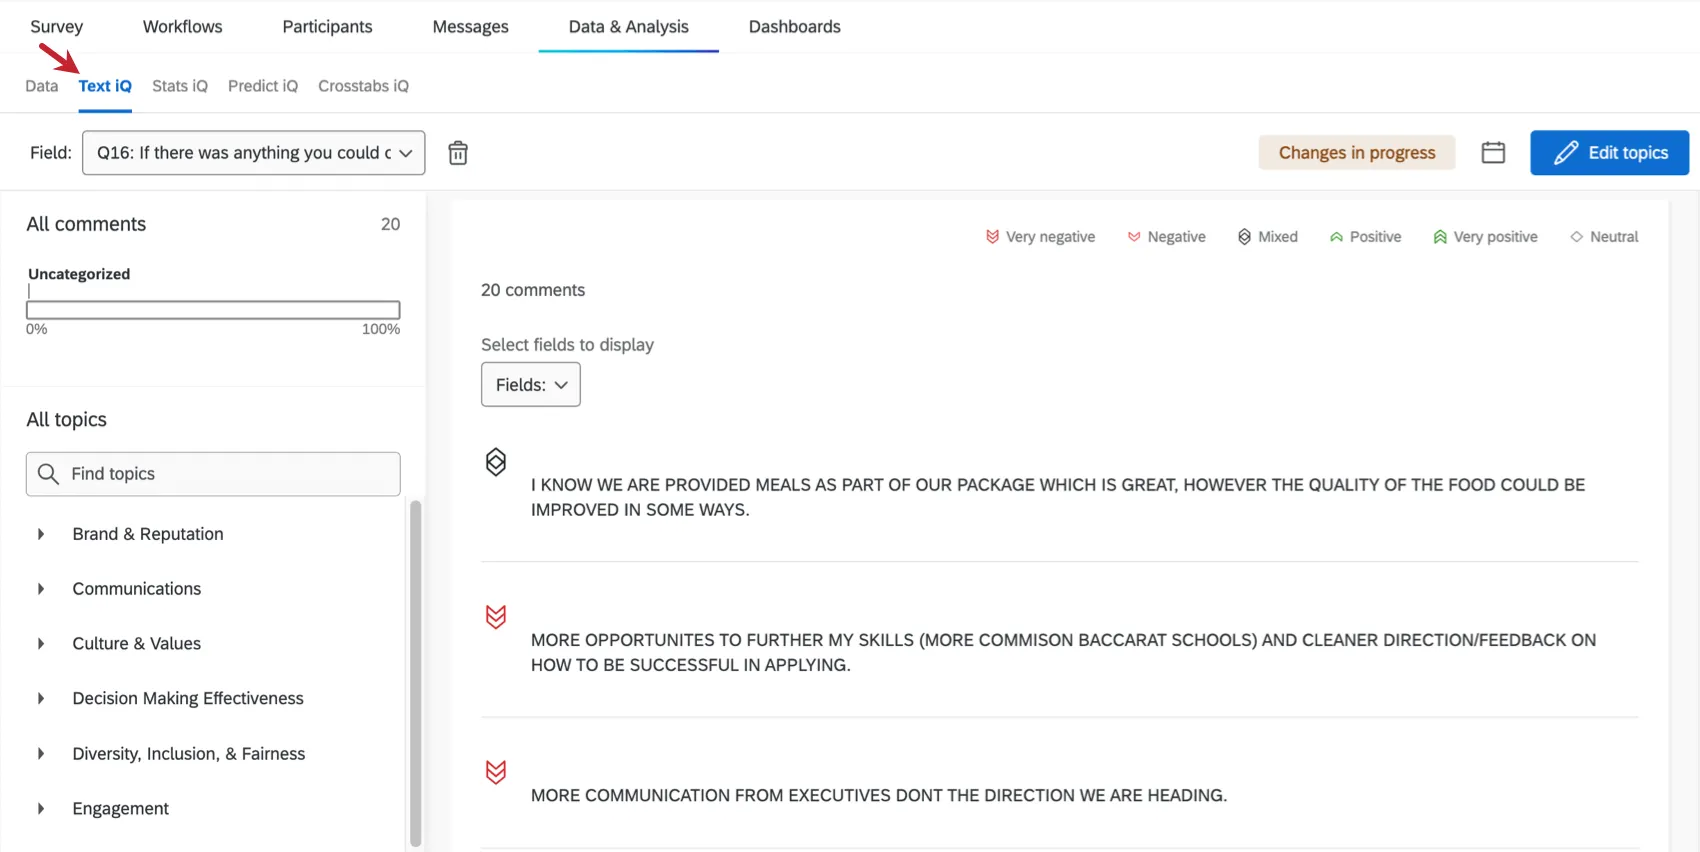
Step 2: Perform Text iQ in Engagement Survey
Perform text analysis in the Text iQ section of the Data & Analysis tab in your survey.
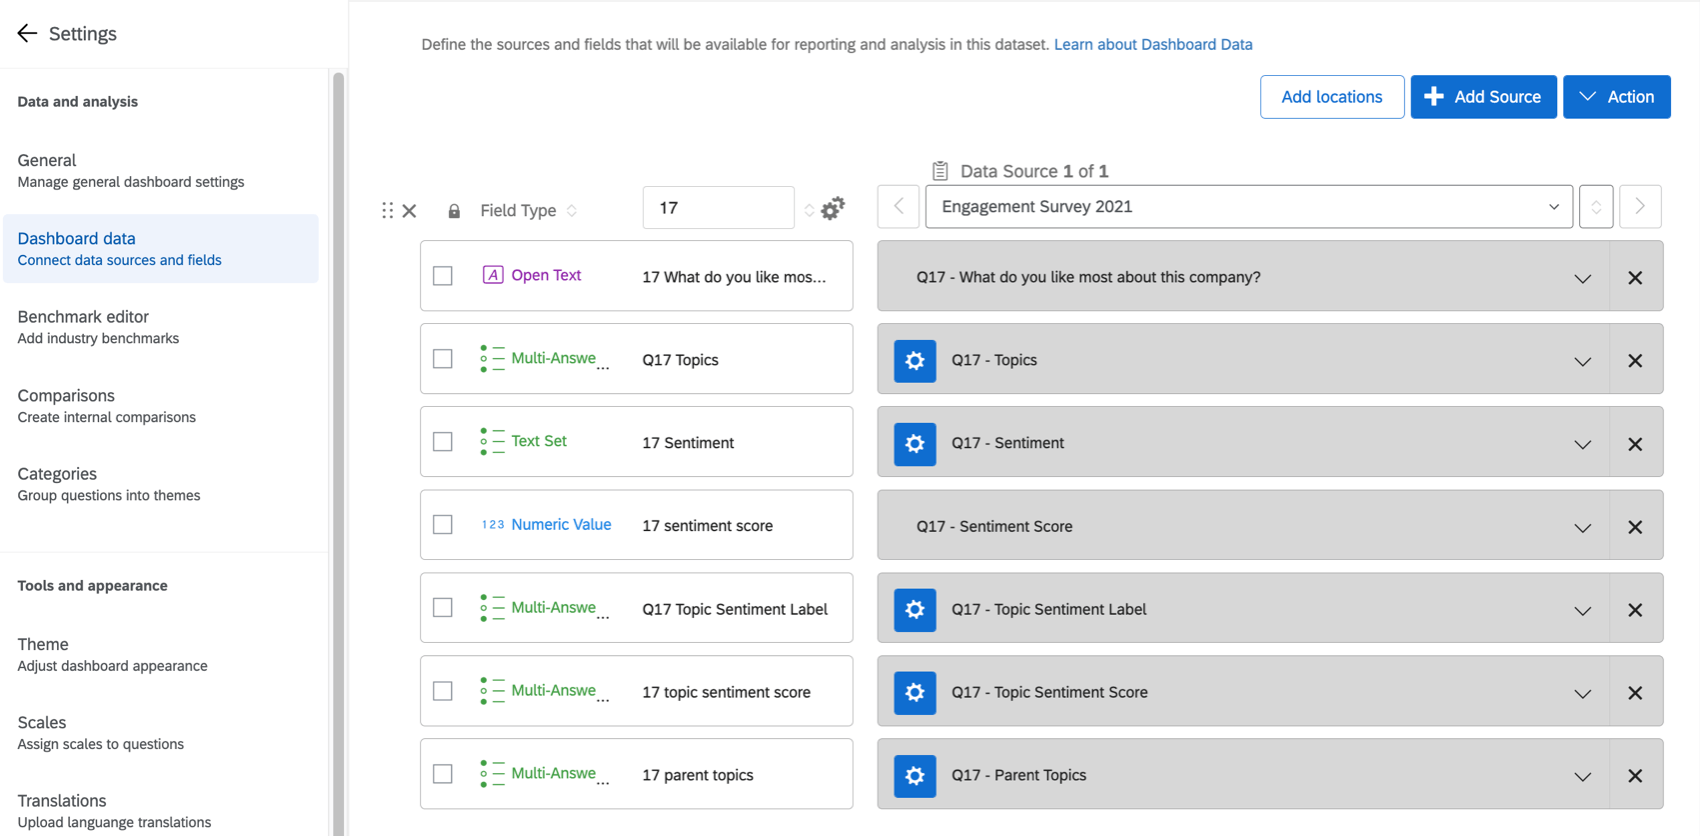
Step 3: Map fields to the dashboard
Next, you must map all possible Text iQ fields to the correct field types in your dashboard. For a list of fields and their types, see Mapping Text Topics to Dashboards.

Attention: Make sure none of these fields are missing or duplicated, or the widget might not work.
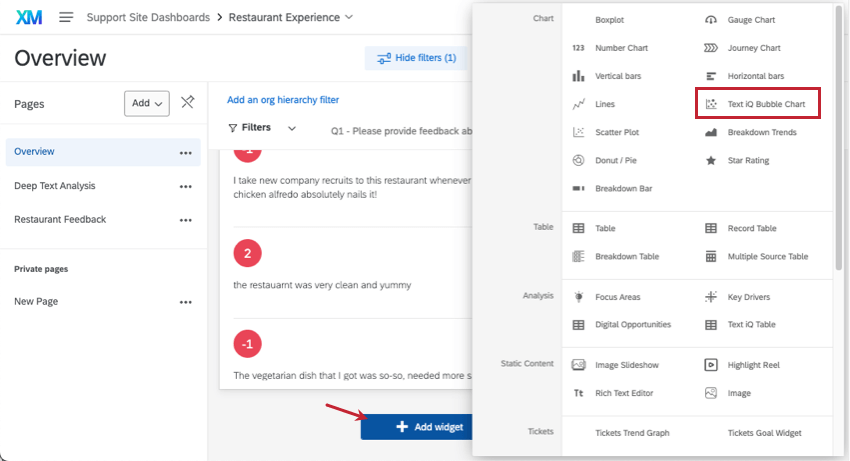
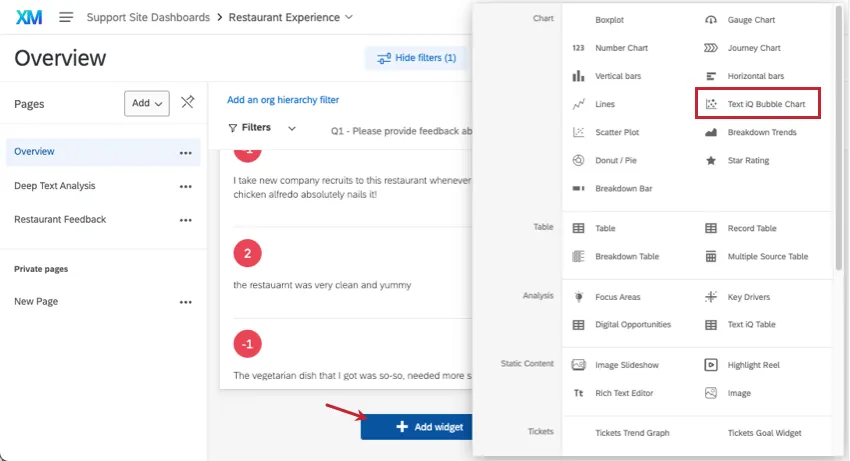
Widget Customization
Exit Text iQ and return to a page of the dashboard to add a Text iQ bubble chart widget.
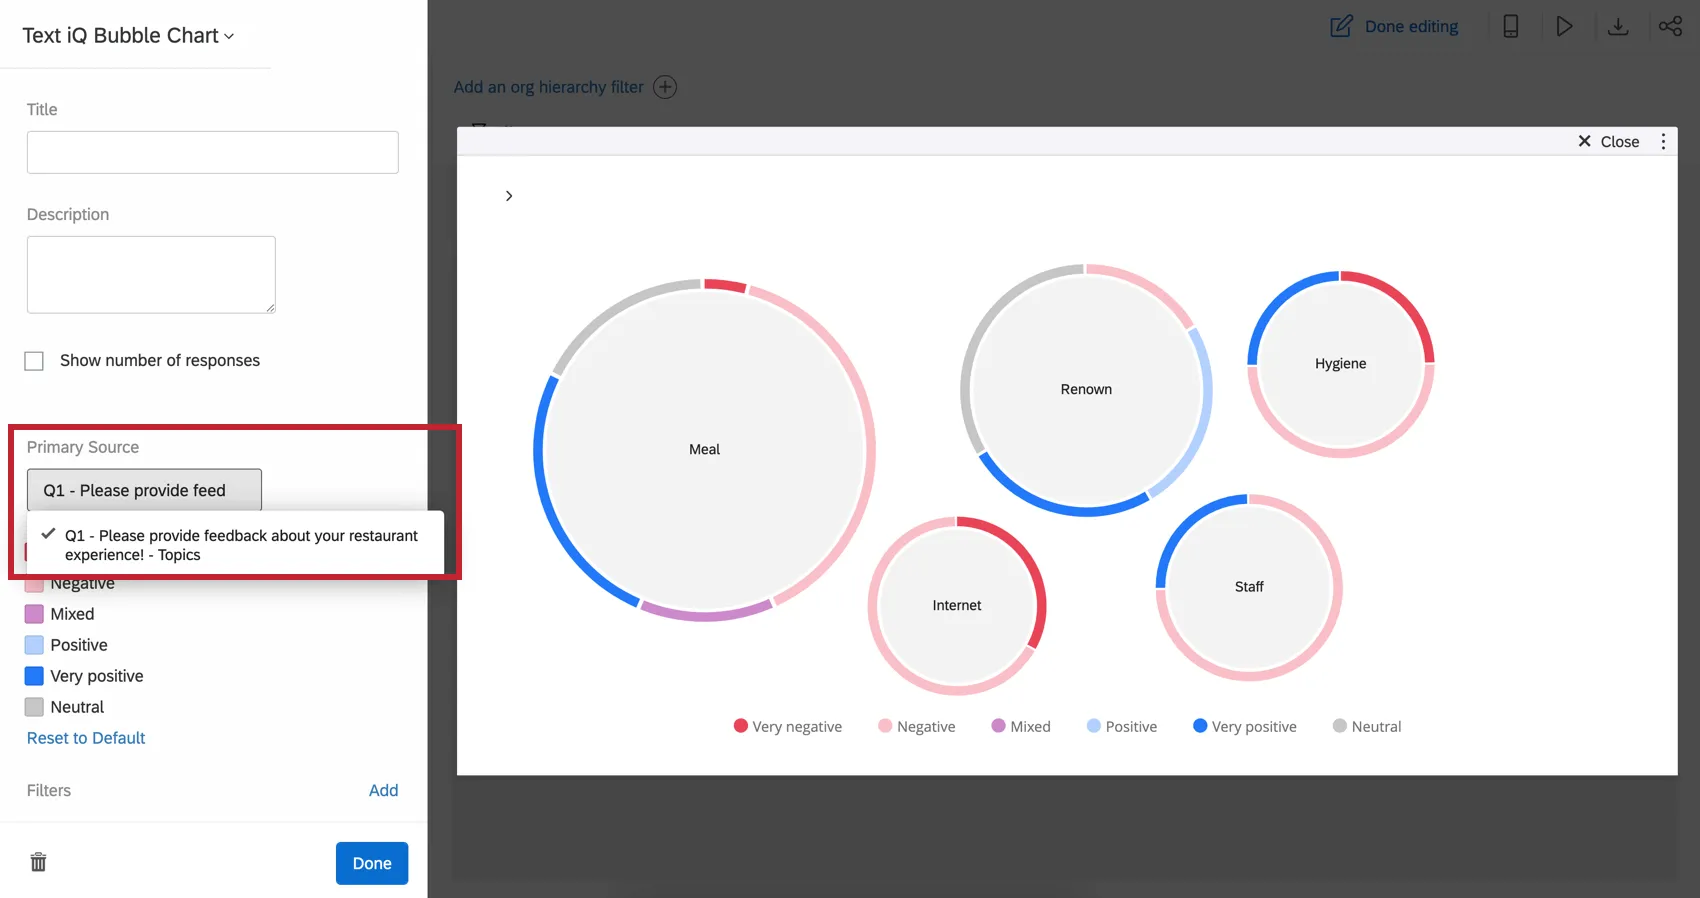
Source
Select the topic you would like to visualize in the widget. If you haven’t added topics to this field yet, no data will appear in the widget.
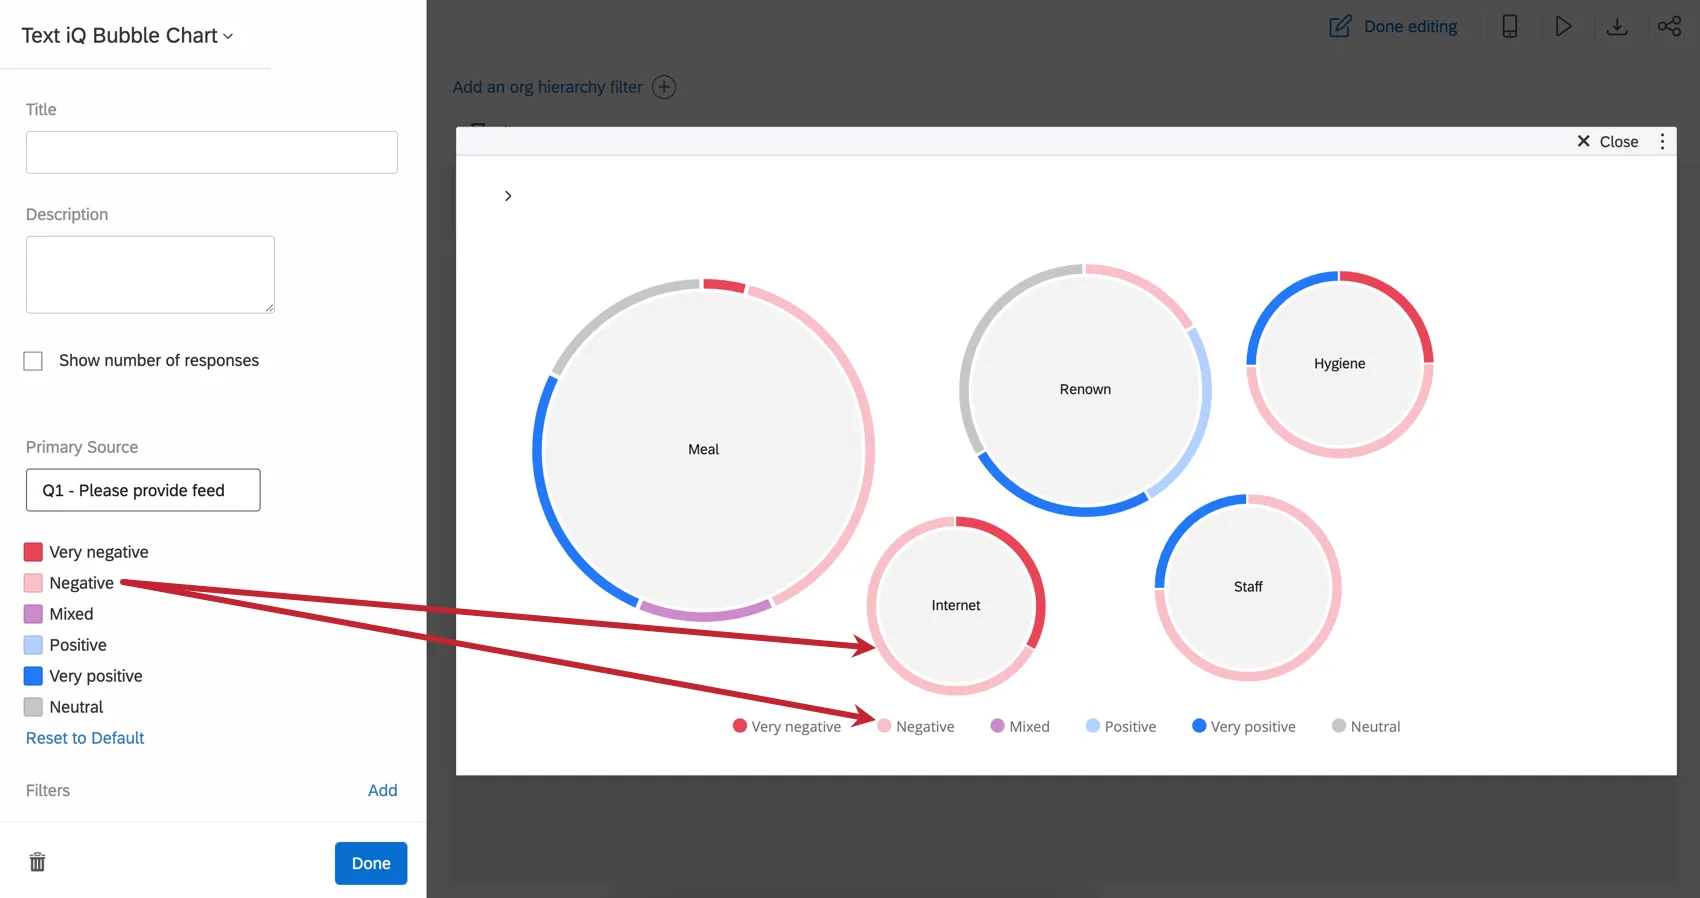
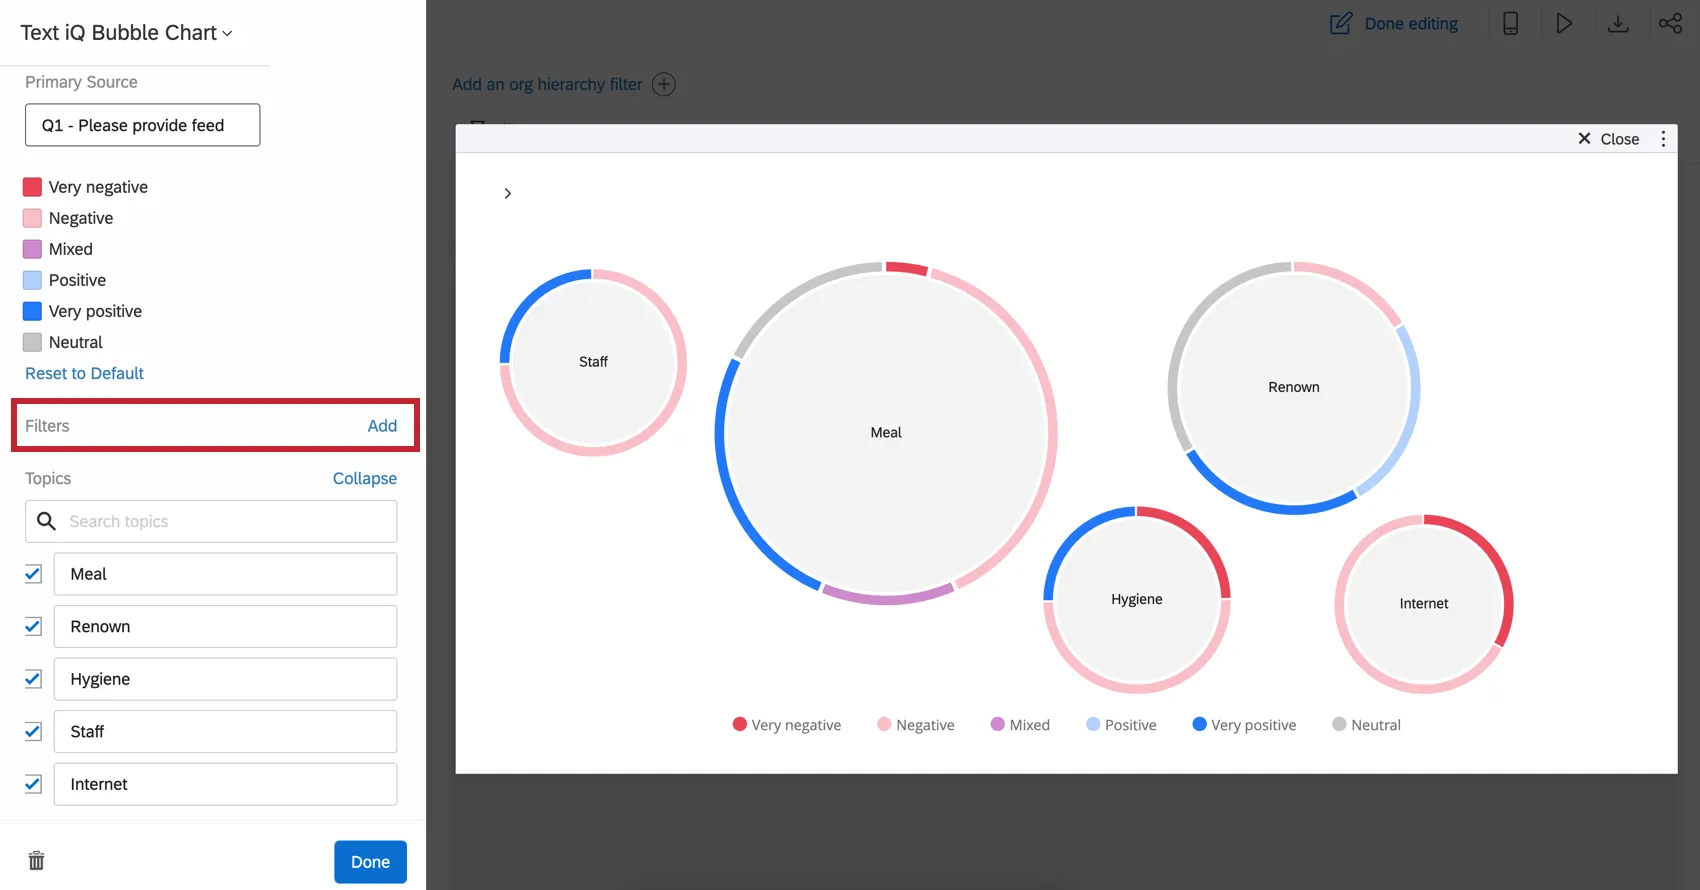
Sentiment Colors
Click the color next to a sentiment to choose a new color. To remove your changes, click Reset to Default.
Customizing the Topics Displayed
You can customize which topics are displayed or hidden in your bubble chart. Scroll down in the editor until you find the Topics header.
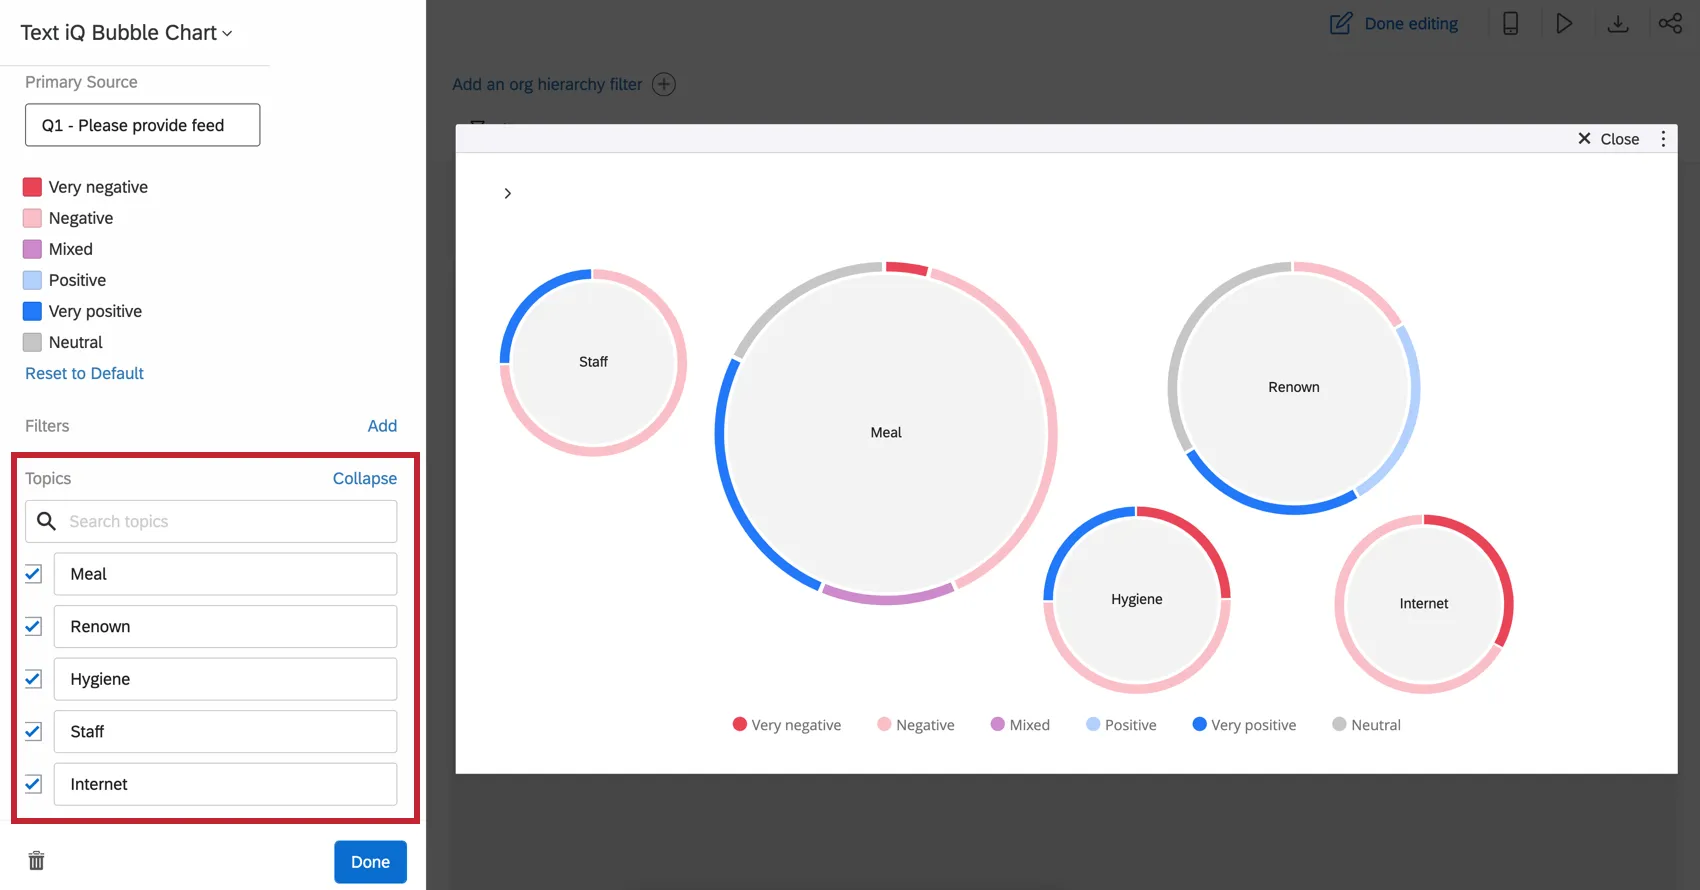
You can use search to locate topics. Edit the names of topics as needed. Select topics you want to display and deselect those you do not want to display.
Qtip: Any topics you display in your widget can be translated.
Filters
Filtering by Topic
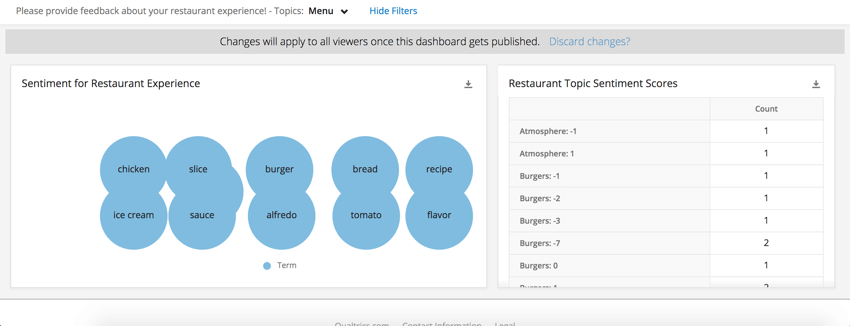
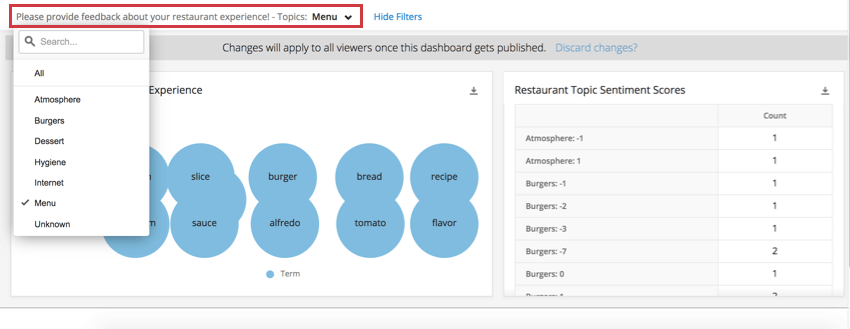
As you click on topics in your Text iQ bubble chart widget, you filter down the rest of the dashboard page. Therefore, it can be incredibly valuable to pair other demographic or scoring information on the same page as this widget. That way, when you select different topics, you can narrow down data on the people who discussed these topics.
FAQs
Why does my Text iQ Bubble Chart widget show different sentiments than my other widgets?
Why does my Text iQ Bubble Chart widget show different sentiments than my other widgets?
I want to use survey Text iQ in my dashboard instead. How do I make that work?
I want to use survey Text iQ in my dashboard instead. How do I make that work?
See Using Survey Text iQ in a CX Dashboard for more details.
I have multiple datasets on my dashboard. Can I use this feature with all of my widgets?
I have multiple datasets on my dashboard. Can I use this feature with all of my widgets?
- Changing which dataset your widget shows: Not all widgets can have their referenced dataset switched. Some can only use the default dataset. For a compatible list, see this section.
- Showing multiple datasets in the same widget: Not all widgets can show multiple datasets’ results at the same time. For a compatible list, see this section.
That's great! Thank you for your feedback!
Thank you for your feedback!