
BX Programs
What's on this page
Qtip: BX programs are typically conducted by the Qualtrics Implementations team or a third-party implementations partner. If you have questions about your implementation, please reach out to your Technical Success Manager.
About BX Programs
BX Programs, including Brand Health Trackers, let you conduct a comprehensive, ongoing assessment of the health of your brand compared with your key competitors. These programs are created for you by Qualtrics services teams informed by subject matter expertise, so you don’t have to build or edit them on your own.
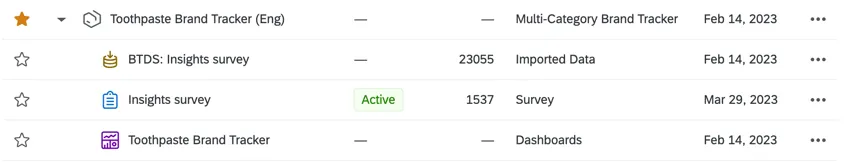
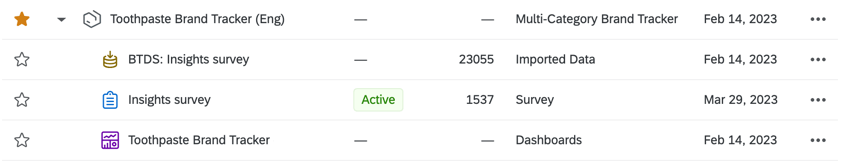
A Qualtrics BX Program is a program comprised of three primary components:
- Brand Survey: Pre-built survey with questions developed by subject-matter-experts. This is where the respondent answers are collected.
- Brand Tracker Data Source (BTDS): A transformed version of your respondents’ answers for easier analysis.
- Brand Dashboard: Respondent data visualized in a report, using BTDS as its source and updated as new data is collected.
Managing BX Programs
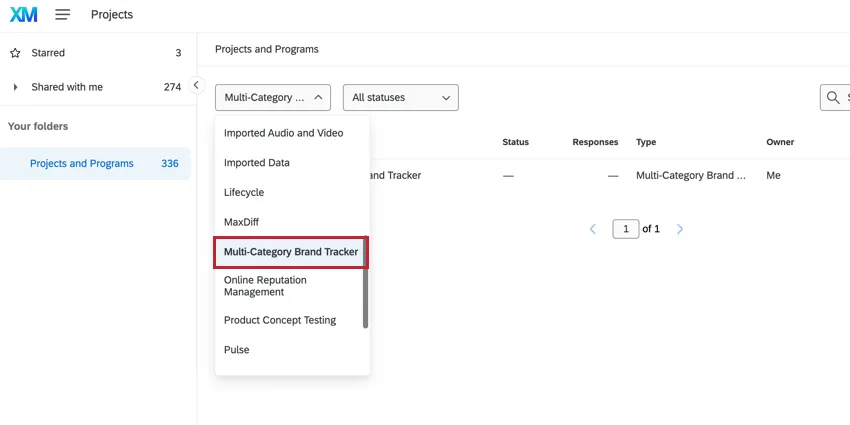
To find your brand program, navigate to the projects page and filter for the Multi-Category Brand Tracker project type.
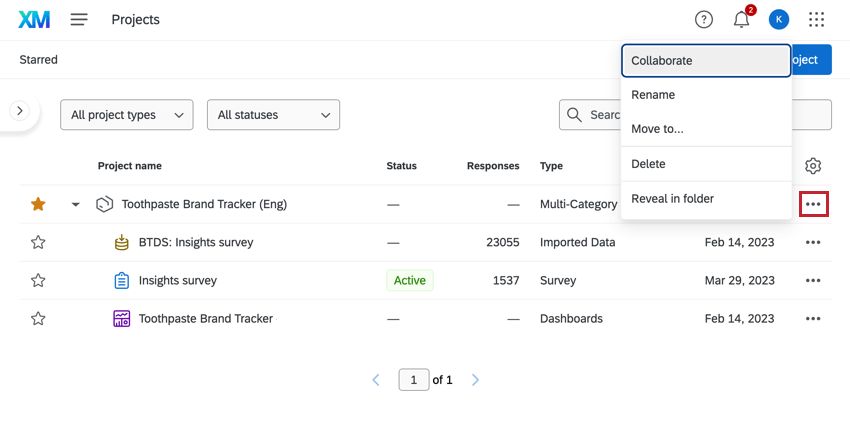
You cannot copy a brand program. However, you can do the following:
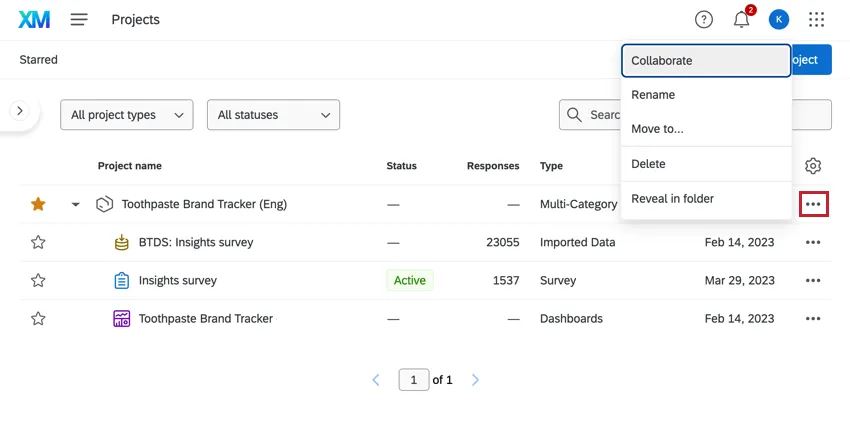
- Collaborate: Invite someone from your organization to collaborate on this program with you. This includes both the survey and the dashboard project. You can only share with other Qualtrics users in the same organization.
- Can edit/delete: This is the same level of access you have as the creator of the project, meaning users with this permission can edit the survey and dashboard, delete the program, view the data, invite other users to collaborate on the program, and more.
- Remove this user: Stop sharing this program with this user.
- Rename: Rename the project.
- Move to: Move the program to another folder on the Projects page.
- Delete: Delete the project. Once a Brand Health Tracker is deleted, it cannot be retrieved, so be absolutely sure before you do this!
Brand Surveys
If you want to see the questions in your survey or edit them, click the survey project. You can do this either on the Projects page, or from inside the program. For more information on editing BX surveys, see BX Program Best Practices.
Attention: If you are using a BX study built by the Qualtrics Implementation team or a third party implementation team, do not make any unauthorized changes to the survey builder or the survey flow, as this can invalidate the data collected.
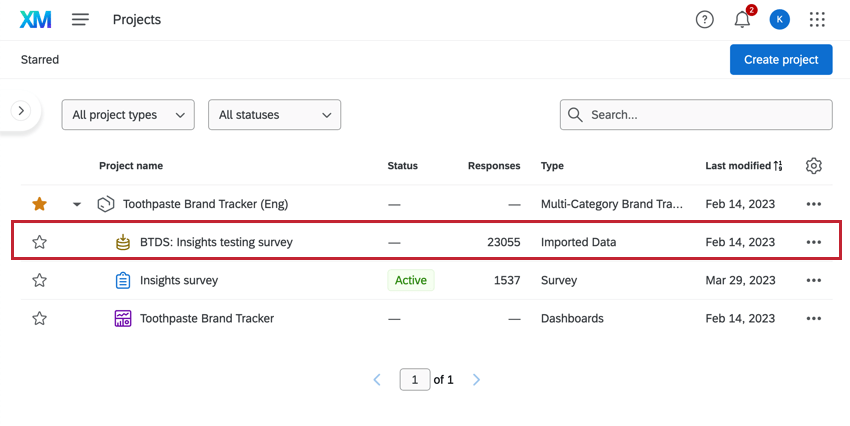
Brand Tracker Data Source
BX projects collect data on your brand in addition to competitive brands and the larger market, which can result in a large and complex dataset. In BX Programs, you have the ability to generate a “stacked” dataset (BTDS) in addition to the standard one, which will help you determine insights from your data more easily. For more information, see Using and Editing your Brand Tracker Data Source.

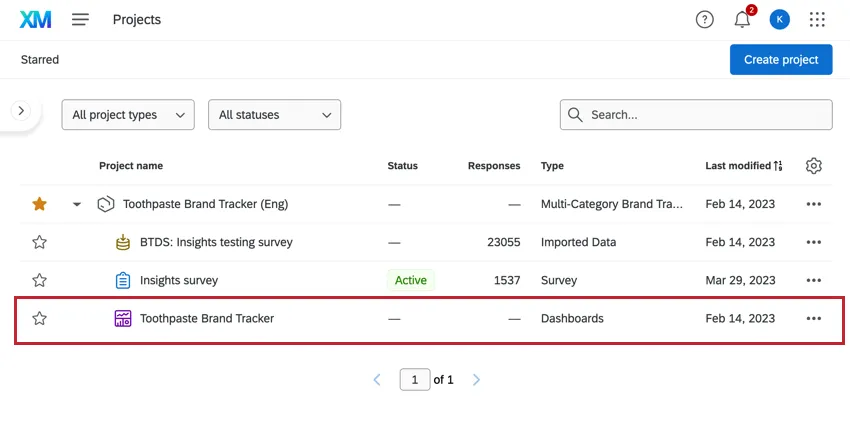
Dashboards
Brand programs include a dashboard developed by subject matter experts. If you want to see the dashboard or create a new one, click the dashboards project. You can do this either on the Projects page, or from inside the program.
For more information on building and using brand tracker dashboards, see BX Dashboards Overview.
FAQs
How do custom metric filters interact with page filters in BX dashboards?
How do custom metric filters interact with page filters in BX dashboards?
That's great! Thank you for your feedback!
Thank you for your feedback!