-

Qualtrics Platform -

Customer Journey Optimizer -

XM Discover -

Qualtrics Social Connect
XM Discover Basic Overview
About XM Discover
You can use XM Discover to analyze your customer feedback taking place in conversations across different channels, including cases, chat, voice transcriptions, emails, surveys, ratings, and reviews on third party websites, social media, and online communities. Topic models and machine learning algorithms enable you to gain actionable insights into the root cause of customer problems so that you can act quickly to solve these problems.XM Discover consists of 3 applications: Connectors, Designer and Studio. Access to these applications is based on your user license, permissions and contract.
Connectors
XM Discover comes with a set of integrations referred to as “connectors” that enable you to upload feedback and interaction data into XM Discover from a wide variety of sources, including contact center calls, chat and messaging platforms, CRM platforms, surveys, social media, online communities, digital aggregators, and review sites.
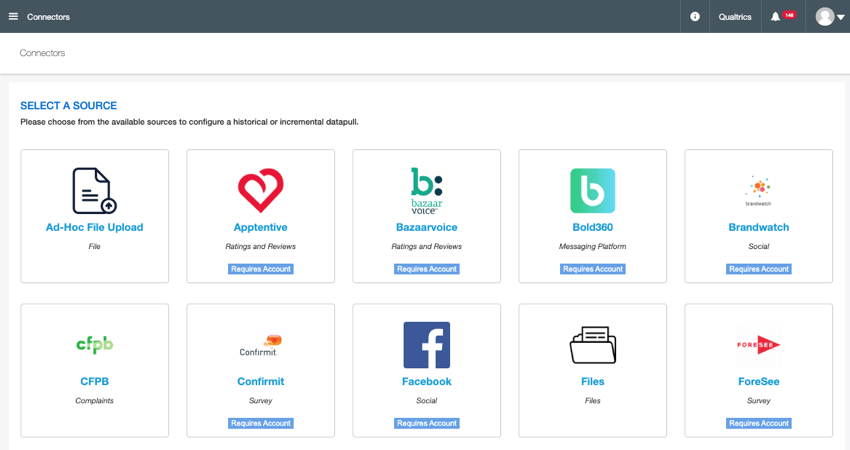
You can use Connectors to do the following:
- Upload data from a variety of sources.
- Map source fields to your project’s attributes.
- Leverage XM Discover enrichments.
- Apply filters and transformations.
- Run one-time data uploads and schedule incremental data pulls.
- Monitor job status.
- Manage account-level connectors and credentials.
For more information on Connectors, see Connectors Basic Overview.
Designer
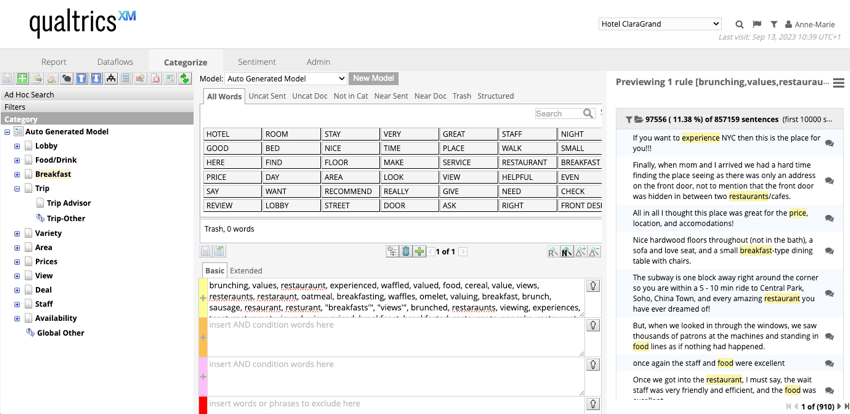
You can use the industry and vertical specific categorization templates provided in Designer to easily and quickly capture themes and topics your customers are talking about in different channels, enabling you to understand and action customer feedback. Natural Language Understanding is used to uncover the intent of why a customer made a comment, the emotion buried in their words, and how much effort (amongst other enrichments) was required by the customer to address a problem.
Designer enables you to achieve the following goals:
- Categorize data: Sort data into topics using classification models to understand major issues.
- Tune sentiment: Adjust sentiment settings to better suit your data.
- Adjust dictionaries: Manage custom lexicons, intelligent entities, and taxonomies to enhance data processing.
- Define alerts: Configure alerts to be notified any time XM Discover detects notable customer feedback.
On the administrative side, Designer allows you to manage projects, users, and accounts:
- Manage projects: A project brings together all of the related pieces of data for analysis, including customer feedback, classification models, and sentiment settings.
- Manage users: A user account is required to access projects in Designer. Users may be granted different permissions that control which segments of data they can access and what actions they can perform.
- Manage accounts: An account groups together projects and users. Account settings are shared by all projects within the account.
For more information about Designer, see Designer Basic Overview.
Studio
Studio is an XM Discover application for creating customizable dashboards and sharing them with users across the organization. Dashboards can be configured to display a variety of XM reports, as well as custom content including text, images, and videos.
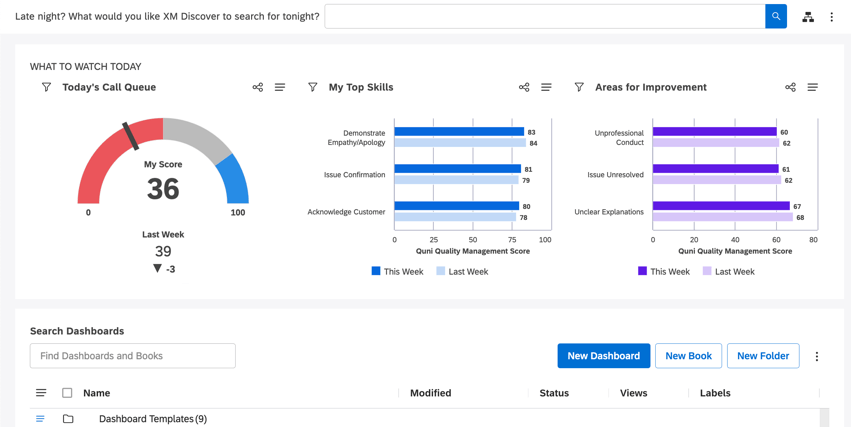
After you have categorized your unstructured data (for example, call transcriptions and chats) and adjusted sentiment settings in Designer, you can visualize data for specific use cases and showcase customer insights in interactive dashboards in Studio.
Studio is also where administrators can create and manage users and groups.
Key Studio Features
- Multiple Dashboards: A dashboard is a custom collection of reporting and content widgets. Studio enables you to create virtually unlimited dashboards for different business needs. For example, a new product launch team can use a dashboard to monitor hot topics emerging from social media, a customer care team can use a dashboard to monitor drivers of calls into the support center, or an XM professional can use a dashboard to lay out the steps of an analysis leading to a certain insight.
- Versatile Widgets: Widgets are the building blocks of dashboards. They can display a variety of content, including XM reports using different visualizations, text blocks, images, and videos. Once configured, reporting widgets will display up-to-date results obtained from the connected Designer instance, which serves as a content provider.
- Custom Metrics: Studio enables you to define your own metrics based on reportable numeric attributes from content providers. Out of the box, Studio supports the following metrics: Top Box, Bottom Box, Satisfaction, Filtered, Custom Math and Value.
- Alerts: You can leverage verbatim alerts that enable you to define topics on which you wish to be notified automatically. Each time a certain topic is mentioned in customer feedback, an alert is triggered, letting you investigate the issue and act on it. You can also use metric alerts that enable you to check various XM metrics against a user-defined threshold on your preferred cadence and trigger in-app or email notifications to key users when the alert conditions are met.
- Customizable Layout: You can easily resize and move widgets around the dashboard to create visually appealing presentations.
- Dashboard Sharing: You can share dashboards with individual users or groups of users, and with people who are not yet registered in Studio using their email. As the owner of a dashboard, you can grant either view or modify permissions to others.
- Content Creators and Content Consumers: Studio permissions divide users into content creators and content consumers. Content creators are power users who can create and configure dashboards. Content consumers are users who need reports and metrics tailored to them without having to set up customer feedback extraction, classification, and sentiment tuning.
For more information about Studio, see Studio Basic Overview.
Contacting XM Discover Support
If you ever need support for Studio, Connectors, or Designer, you can contact the support team from the product.
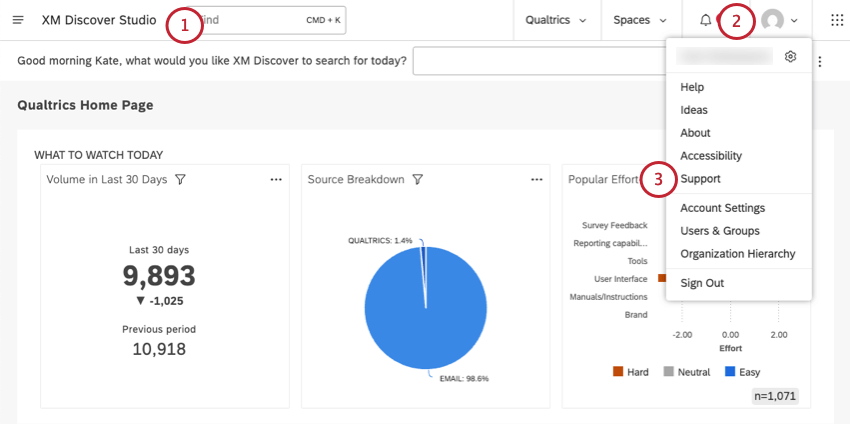
- Make sure you are in Studio.
Qtip: See how to switch from Designer or Connectors to Studio.
- Click your profile icon.
- Select Support.