-

Qualtrics Platform -

Customer Journey Optimizer -

XM Discover -

Qualtrics Social Connect
Milestone Analysis
About Milestone Analysis
The Milestone analysis section of a Milestone helps you visualize CX data alongside your milestones. You can connect your Qualtrics survey data to milestones, allowing you to see the Customer Effort Scores (CES), Customer Satisfaction Scores (CSAT), or Net Promoter Scores (NPS) associated with each milestone. You can also connect your Text iQ data to visualize text topics and sentiment insights you gain from customers feedback.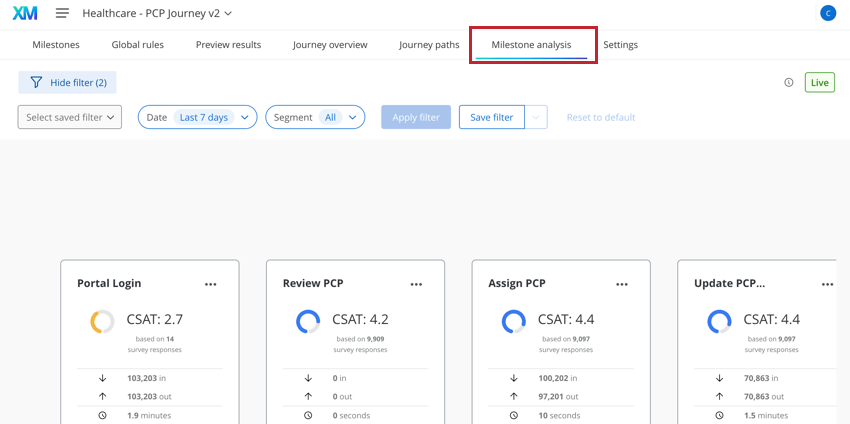
Setup in the Qualtrics Survey Platform
Before you can visualize CX data in the Customer Journey Optimizer, you must make sure you have a Qualtrics survey that collects the correct CX data. This section covers the survey and Text iQ setup required to use milestone analysis.
Survey Question Setup
Visit the Creating Questions support page for an overview of building survey questions.
You can display 3 different types of questions in a milestone analysis:
- Customer Satisfaction (CSAT): Displays customer satisfaction about a product or service. It can be on a scale of 1-5 or 1-7 (with 1 being “very unsatisfied” and 5/7 being “very satisfied”). More information about CSAT methodology can be found on this page.
- Customer Effort (CES): Displays the effort required by a customer to use a product or services. It can be on a scale of 1-5 or 1-7 (with 1 being “very difficult” and 5/7 being “very easy”). More information about CES methodology can be found on this page.
- Net Promoter Score (NPS): Displays customers’ loyalty to your company by measuring how likely they are to recommend the product or services to others. NPS is measured on a scale of 0-10 with 0 being “not at all likely to recommend” and 10 being “extremely likely to recommend”. More information about NPS methodology can be found on this page.
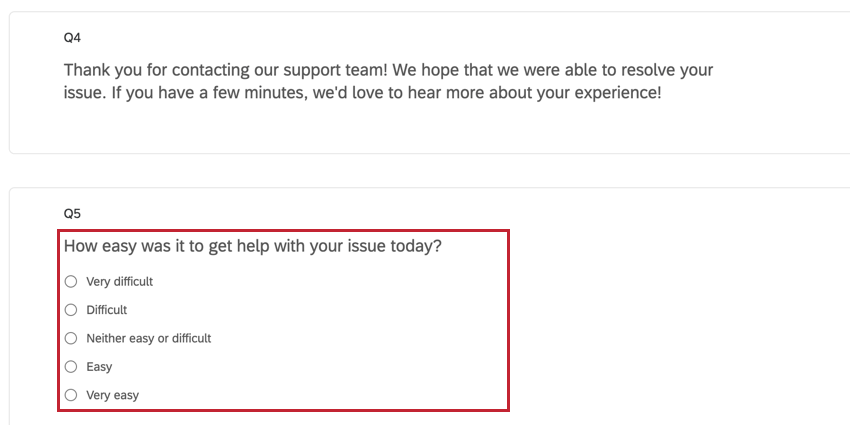
If you’d like to display CES or CSAT data, build a multiple choice question. Then, add answer choices depending on your chosen scale:
- CSAT (1-5): 1 – very unsatisfied, 2 – unsatisfied, 3 – neutral, 4 – satisfied, 5 – very satisfied.
- CSAT (1-7): 1 – very unsatisfied, 2 – unsatisfied, 3 – somewhat unsatisfied, 4 – neutral, 5 – somewhat satisfied, 6 – satisfied, 7 – very satisfied.
- CES (1-5): 1 – very difficult, 2 – difficult, 3 – neutral, 4 – easy, 5 – very easy.
- CES (1-7): 1 – very difficult, 2 – difficult, 3 – somewhat difficult, 4 – neutral, 5 – somewhat easy, 6 – easy, 7 – very easy.
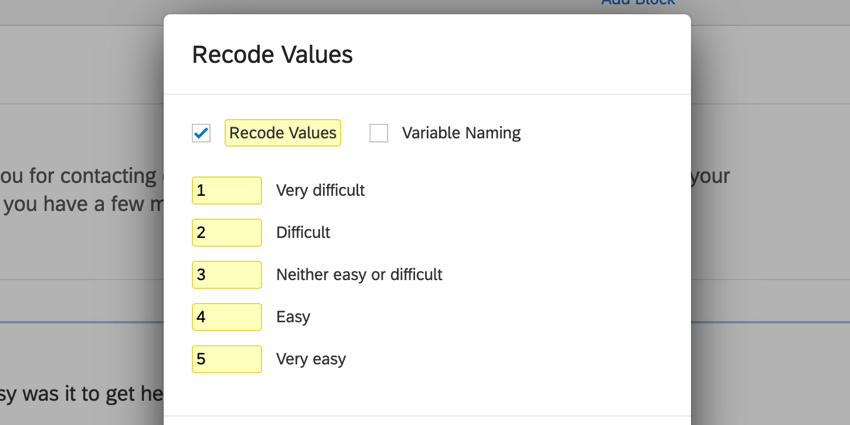
Qtip: The number scale values for the multiple choice questions are taken from the question’s recode values. Make sure the recode values match the scale numbers so the data displays correctly in your milestones.
If you’d like to display NPS data, make sure you build an NPS question. The question’s scale will be automatically configured for you.
Text iQ Setup
To collect open-ended feedback, your survey must have a text entry question.
Once you’ve collected responses, navigate to Text iQ in your survey to begin processing your text data. You’ll need to add topics for any questions you want to visualize in the Customer Journey Optimizer. Sentiment scores will be automatically applied to your text responses as long as the responses are loaded into Text iQ.
Connecting Qualtrics Survey Data
This section covers how to connect your Qualtrics survey data to the Customer Journey Optimizer. If you plan on ingesting Text iQ data, do not connect your Qualtrics survey data until Text iQ has finished processing your responses.
- Navigate to Integrations.
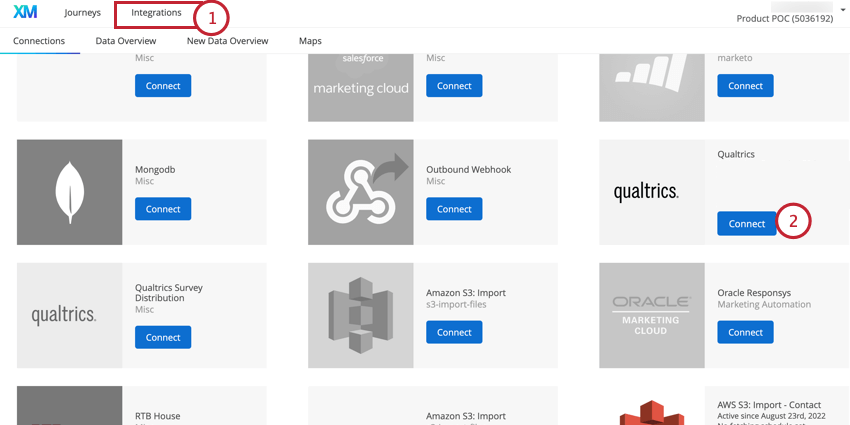
- Find Qualtrics in the list of integrations and click Connect.
- Enter the Data Center for your Qualtrics account. See Locating the Datacenter ID for more information.
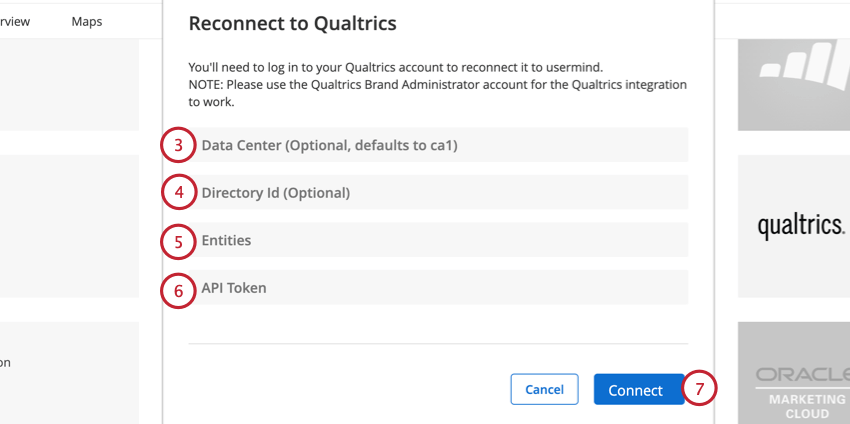
- Leave the Directory Id field empty.
- Enter [] for the Entities.
- Paste the API Token for your Qualtrics account. See Generating an API Token for more information.
- Click Connect.
- Click the dropdown arrow next to the Edit button.
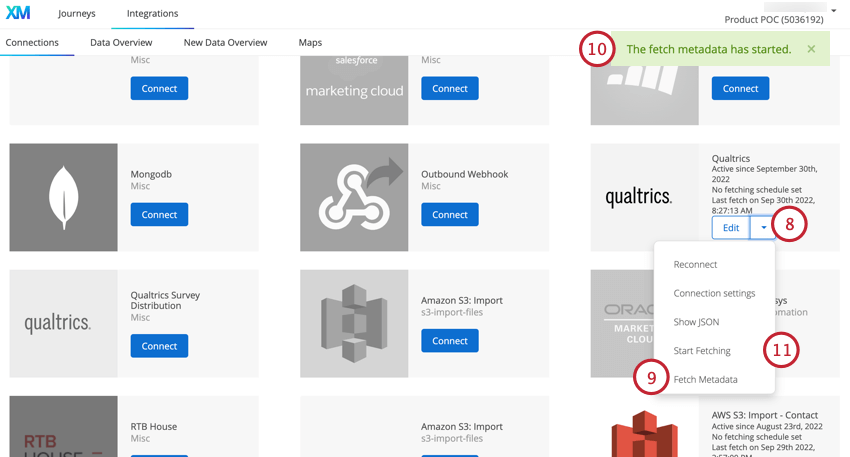
- Select Fetch Metadata.
- A green pop-up will appear when the metadata is ready to be fetched.
- In the same dropdown menu, click Start Fetching.
- Navigate to the Data overview tab.
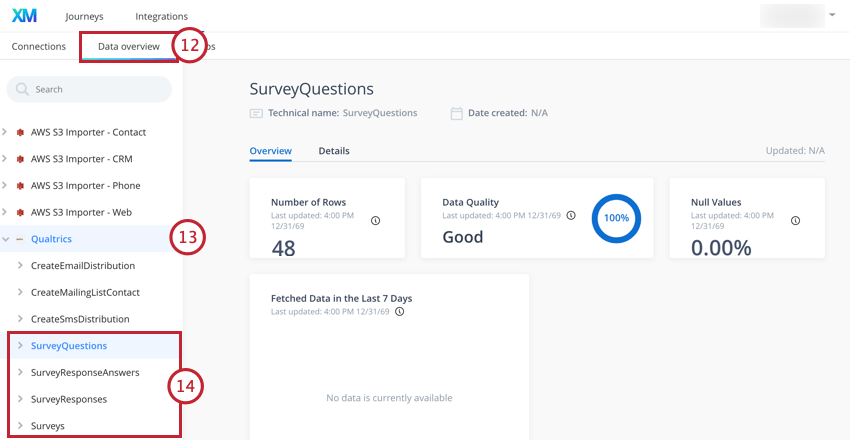
- Select the Qualtrics data source.
- Click into the Surveys, SurveyQuestions, SurveyResponseAnswers, and SurveyResponses entities. You should have values for all of these.
If your entities appear empty, check the following:
- Make sure that you have the correct data center and API Token for the connection.
- Make sure that the Qualtrics account you connected is a Brand Administrator.
Adding CX Data to Milestones
After you’ve ingested your Qualtrics survey data, you’re ready to add your CX data to milestones. For an overview of milestones, see Building Journey Milestones.
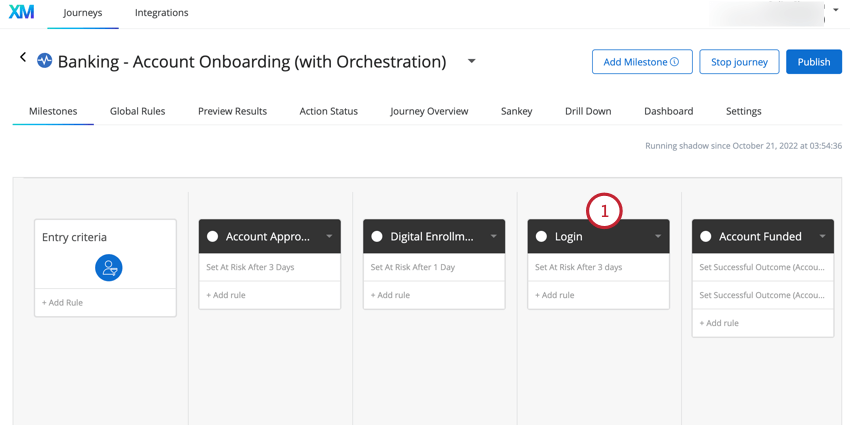
- While viewing your journey, click on the Milestone that you would like to add CX data to.
- Go to the Settings tab.
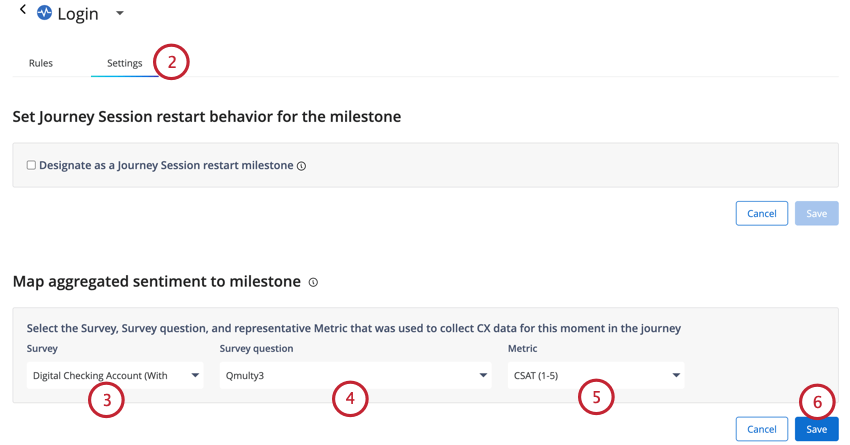
- Select the Survey that contains the question that measures your CX metric.
- Choose the Survey question that measures your CX metric.
- Select the CX Metric you’re measuring.
Qtip: The options available to you in this dropdown will change based on your selected question. For example, if you select an NPS question in the previous dropdown, you will only be able to select NPS (0-10) as the metric.
- Click Save.
- To add open-ended topics and sentiment, select the Survey that contains your open-ended question.
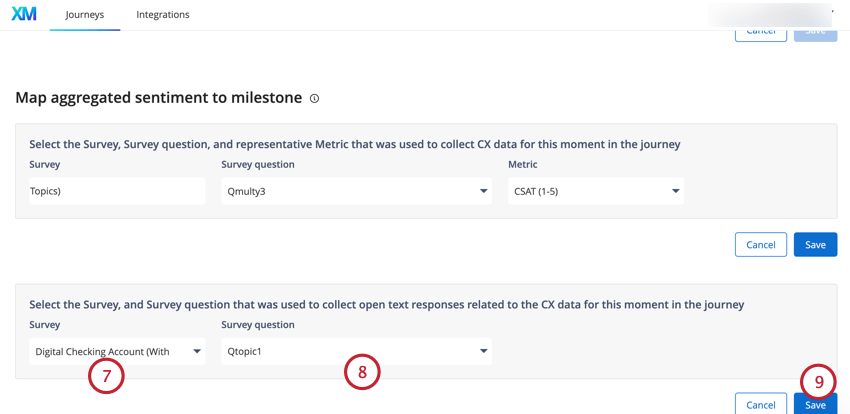
- Choose the Survey question where you’ve performed Text iQ analysis on the open-ended responses.
- Click Save.
Using Milestone Analysis
After your CX data is connected to your milestones, you can view the CX data in the Milestone analysis tab.
Click View detail on a milestone card to pull open a side panel with more information.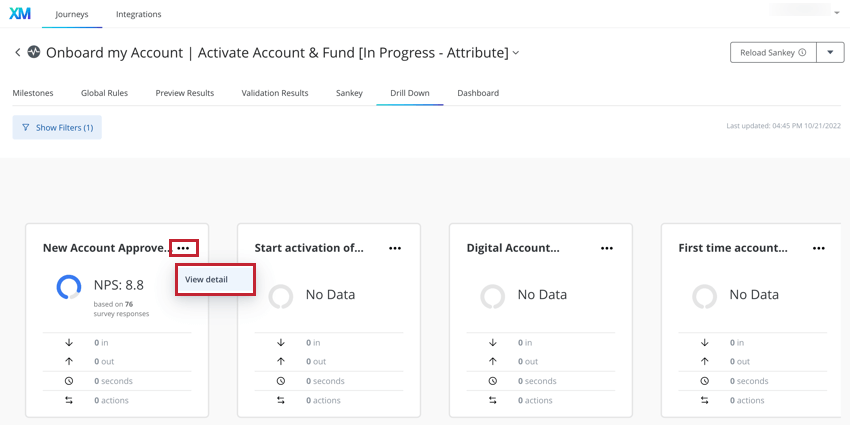
The side panel displays the following information about your milestone:
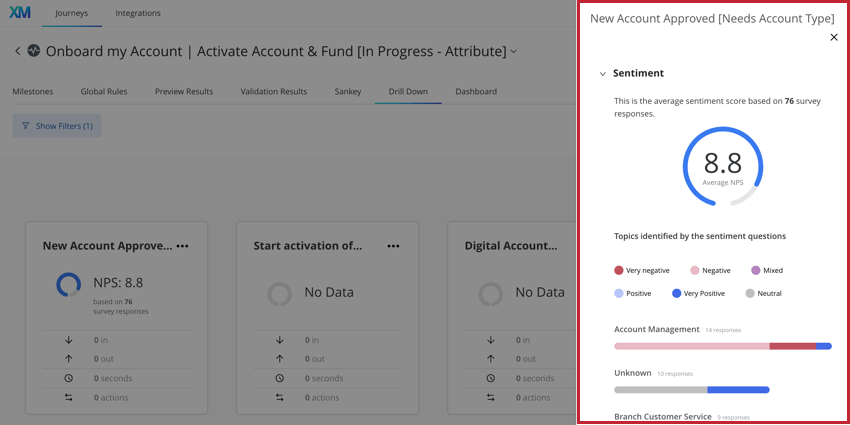
- CX Metric: A gauge chart shows you the average for your chosen CX metric (CSAT, CES, NPS).
- Topics & Sentiment: A list of text topics and their associated sentiment breakdown.
- Travelers: The number of travelers who entered and exited the milestone.
- Time: Displays the average amount of time travelers spent in this milestone. This number is calculated by looking at the travelers who left the milestone within the last 7 days.
- Actions: Aggregates the actions that resulted from this milestone within the last 7 days.
Paths To and From Milestone
Click on a milestone on the milestone analysis page to view a journey paths diagram that shows the different traveler paths into and from that milestone.
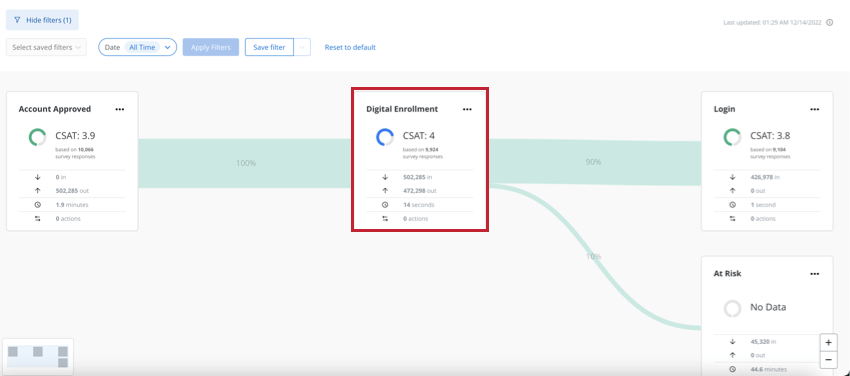
The cards in this diagram display the following information about each milestone:
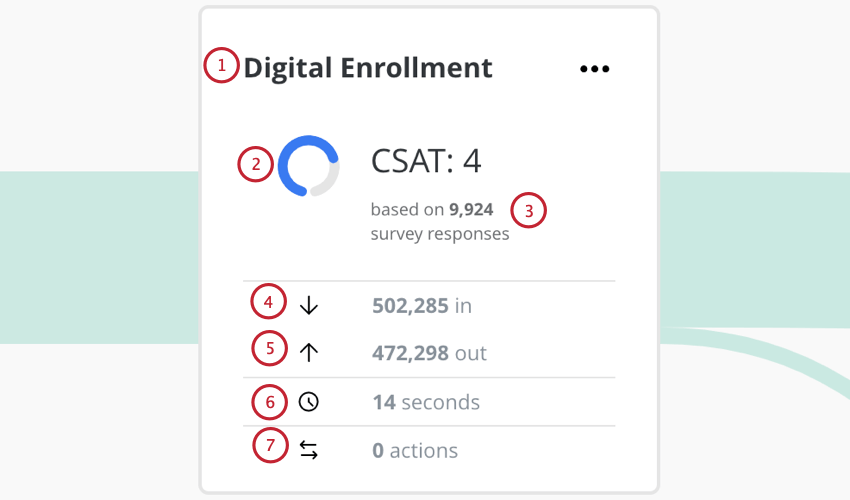
- The name of the milestone.
- Your chosen CX metric score for the milestone.
- The number of survey responses used to calculate the CX score.
- The number of traveler sessions that entered the milestone.
- The number of traveler sessions that exited the milestone.
- The average amount of time a traveler spends in this milestone.
- The number of actions generated by this milestone.