-

Qualtrics Platform -

Customer Journey Optimizer -

XM Discover -

Qualtrics Social Connect
Reporting on Journey Outcomes & Actions
About Reporting on Journey Session Outcomes and Actions
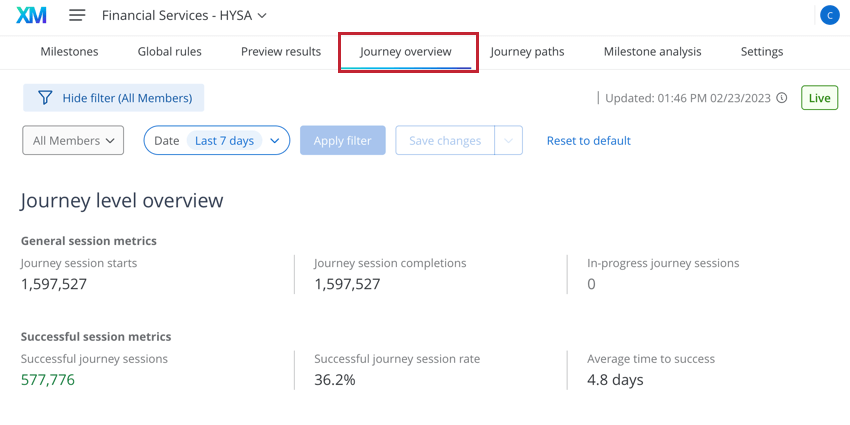
The Journey overview tab contains the results of your journey. Here you can view key statistics about your journey, such as the number of unique sessions, the frequency of different customer outcomes, the actions generated by your journey, and more.
There are 3 main sections to the journey overview report. Visit the linked sections to learn more:
- Journey level overview: View data about the journey, such as the number of sessions, whether or not those sessions were successful, and the average amount of time travelers spent in this journey.
- Journey outcome level overview: View data about your journey’s individual outcomes.
- Action overview: View data about the different actions that were sent as a result of your journey.
Qtip: You can filter the data that appears in this report. See Creating & Using Journey Filters for more information. When filtering by date, only sessions that started and ended within the selected time range will be displayed on this page. Sessions that started but did not end within the selected time range will not be displayed.
Qtip: You won’t see any data in this tab unless your journey is published live or in shadow mode.
Journey Level Overview
The Journey level overview section shows you the following data about your journey:
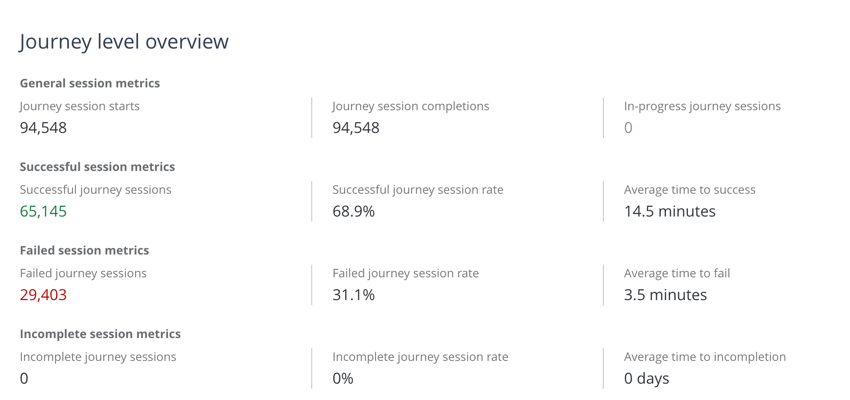
- Journey session starts: The total number of journey sessions that have been started.
- Journey session completions: The number of journey sessions that have ended with an outcome and status. There’s an exception for the “Incomplete” status, which may or may not have an outcome, but will still be considered complete.
- In-progress journey sessions: The number of journey sessions that have not yet reached an outcome or status.
- Successful journey sessions: The number of journey sessions that reached a “Success” status.
- Successful journey session rate: The percentage of journey sessions that reached a “Success” status.
- Average time to success: The average session length for journey sessions that reach a “Success” status.
- Failed session sessions: The number of journey sessions that reached a “Failed” status.
- Failed journey session rate: The percentage of journey sessions that reached a “Failure” status.
- Average time to fail: The average session length for journey sessions that reach a “Failure” status.
- Incomplete session sessions: The number of journey sessions that did not reach an outcome (i.e. were restarted before reaching an outcome) or have a status other than “Failed” or “Success.”
- Incomplete journey session rate: The percentage of journey sessions that did not reach an outcome or have a status other than “Failed” or “Success.”
- Average time to incompletion: The average session length for journey sessions that did not reach an outcome or have a status other than “Failed” or “Success.”
Journey Outcome Level Overview
The Journey outcome level overview section contains a table with data about each of your journey’s possible outcomes. The data displayed in this table includes:
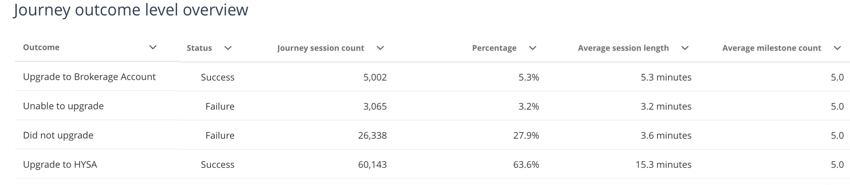
- Outcome: The name of the outcome.
- Status: The status that is applied to sessions that reach this outcome.
- Journey session count: The number of journey sessions that have reached this outcome.
- Percentage: The percentage of all journey sessions that reach this outcome.
- Average session length: The average amount of time it takes for a customer to reach this outcome.
- Average milestone count: The average number of milestones the customer travels through to reach the outcome.
Qtip: This table only displays sessions that have an outcome. Some journey sessions (like those still in progress) have not yet reached an outcome. Since not all journey sessions are shown in this table, the sum of percentages may be less than 100%.
Action Overview
The Action overview section contains data about the actions that have been sent as a result of your journey:
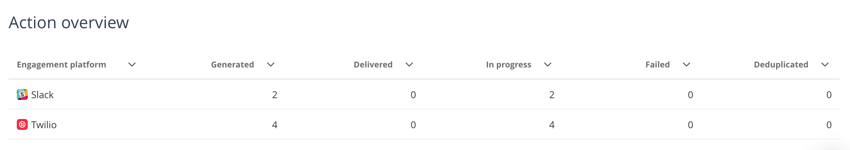
- Engagement Platform: The name of the third-party platform that was sent the action.
- Generated: The number of actions that have been generated by rules in a specific journey. This includes unreleased and released actions.
- Delivered: The number of released actions that have been successfully sent to third-party systems.
- In Progress: The number of unreleased actions that are being evaluated against duplication settings. This number includes the number of actions that may have been deduplicated or capped in addition to any actions yet to be delivered.
- Failed: The number of actions that couldn’t be completed due to errors. Actions can fail for a variety of reasons, such as the connection was set up correctly or you’ve reached a limit on the connection’s side (for example, you’ve met your monthly email send limit). If you are noticing a large number of failed actions, please contact your Customer Journey Optimizer Delivery team to resolve the failures.
- Deduplicated: The number of actions that have the same payload as already delivered actions. These actions are not released to avoid duplicate actions.