
Adding, Copying, & Removing a Dashboard (EX)
What's on this page
Qtip: This page describes functionality available to Engagement, Lifecycle, Ad Hoc Employee Research, Pulse, and 360 projects. For more details on each, see Types of Employee Experience Projects.
Adding a Dashboard
Attention: There is a limit to the number of dashboards you can create in a single project. This limit is 15 dashboards for all EX project types except pulse, which has a limit of 8. This limit includes dashboard copies. As you approach the project’s limit, the dashboard creation window will warn you how many dashboards you have remaining until the ability to create or copy dashboards is disabled.
Navigate to the Dashboards tab.
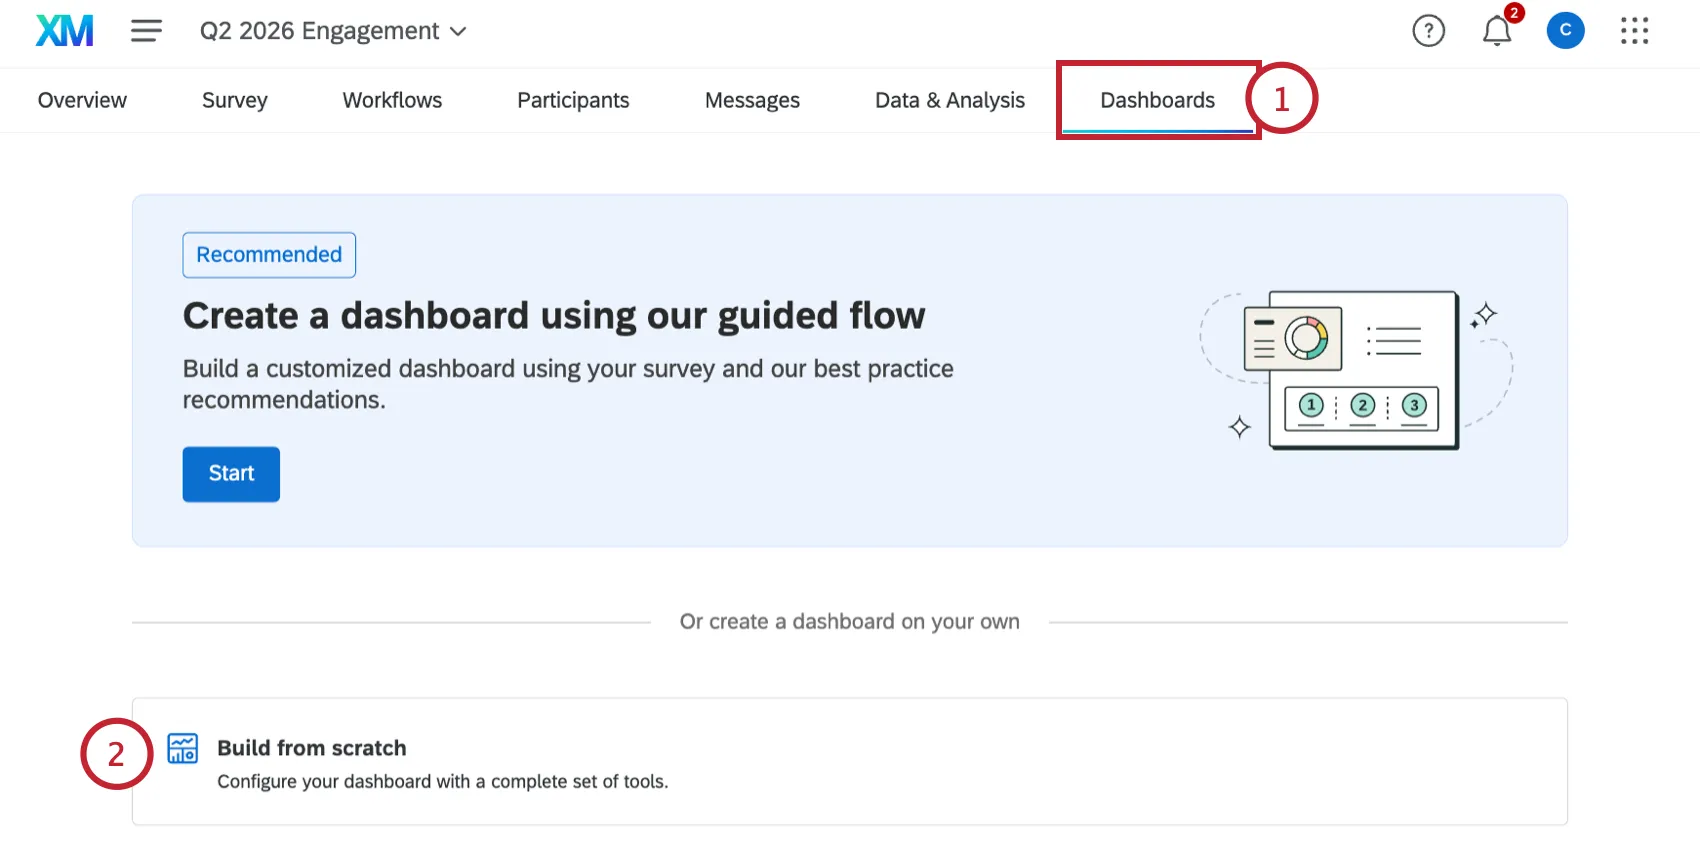
Select Build from scratch.
Type a name for your dashboard.
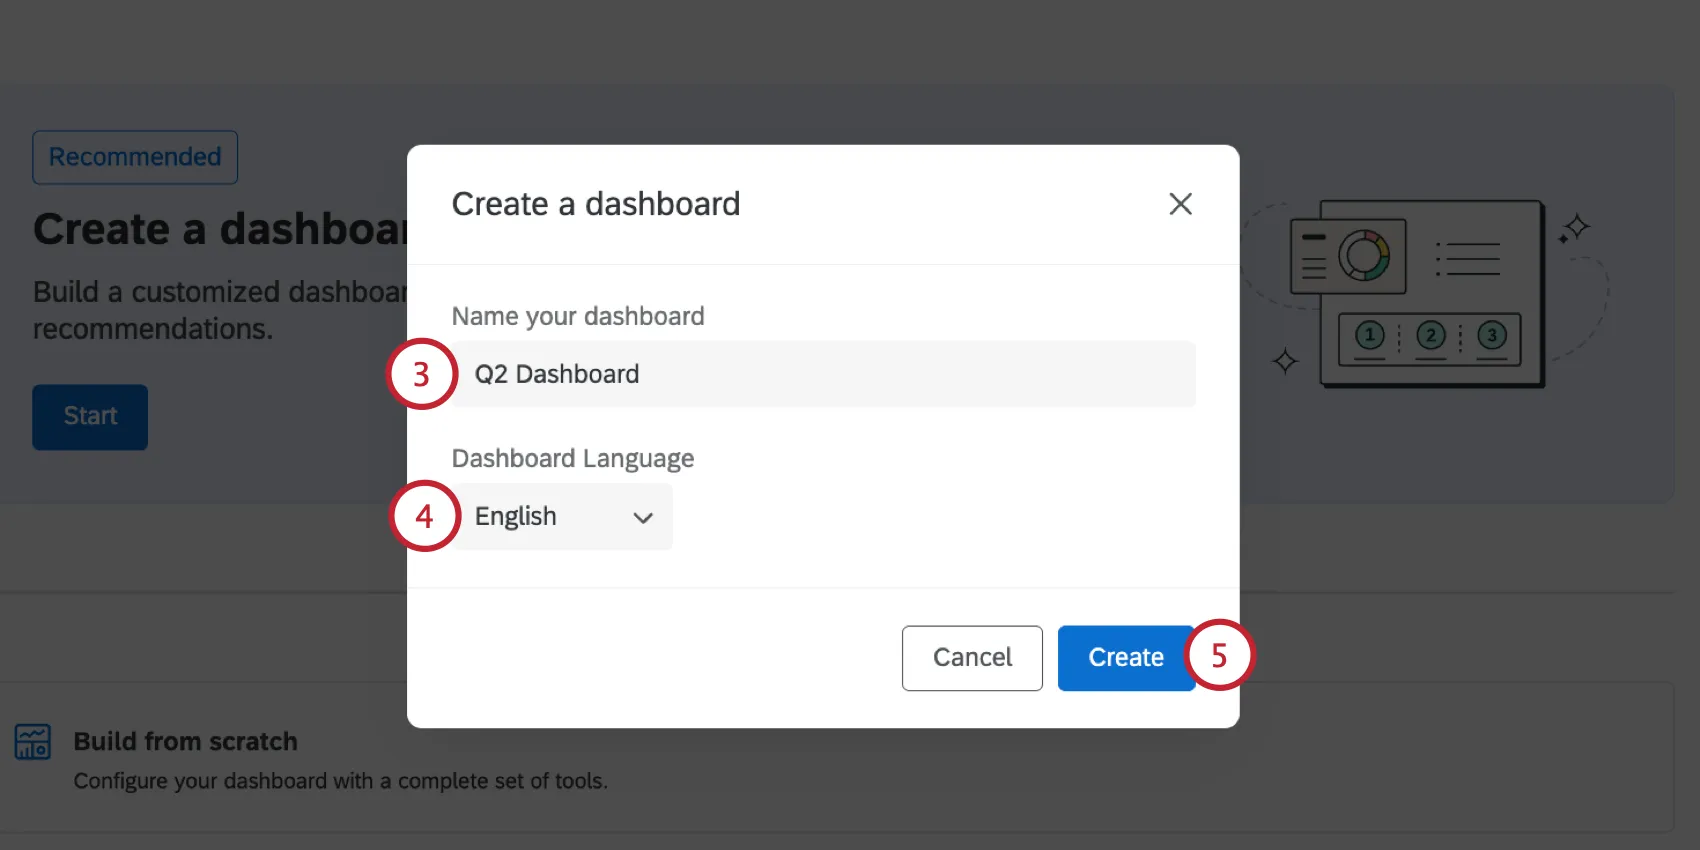
Choose the language for your dashboard. You can later add translations to make the dashboard available in multiple languages.
When finished, click Create.
Guided Flow for Engagement Dashboards
Need help building an Engagement dashboard from scratch? Check out the in-product guidance to help you get started. By answering a few short questions, Qualtrics will build a beginning Engagement dashboard for you based on the Qualtrics EX25 methodology. You can then further customize this dashboard for your organization’s specific needs.
Qtip: Your project must have the following to use the guided dashboard flow:
- At least 2 multiple choice questions. Only multiple choice questions and text entry questions will be used to build the dashboard. Any other question types (e.g, NPS) will be excluded and must be manually added later.
- Participants with metadata.
Qtip: While not required, if you plan on analyzing open text data with Text iQ, then you should do this before building your dashboard. The guided flow will automatically map your Text iQ fields and build Text iQ bubble chart widgets.
Navigate to the Dashboards tab of your Engagement project.
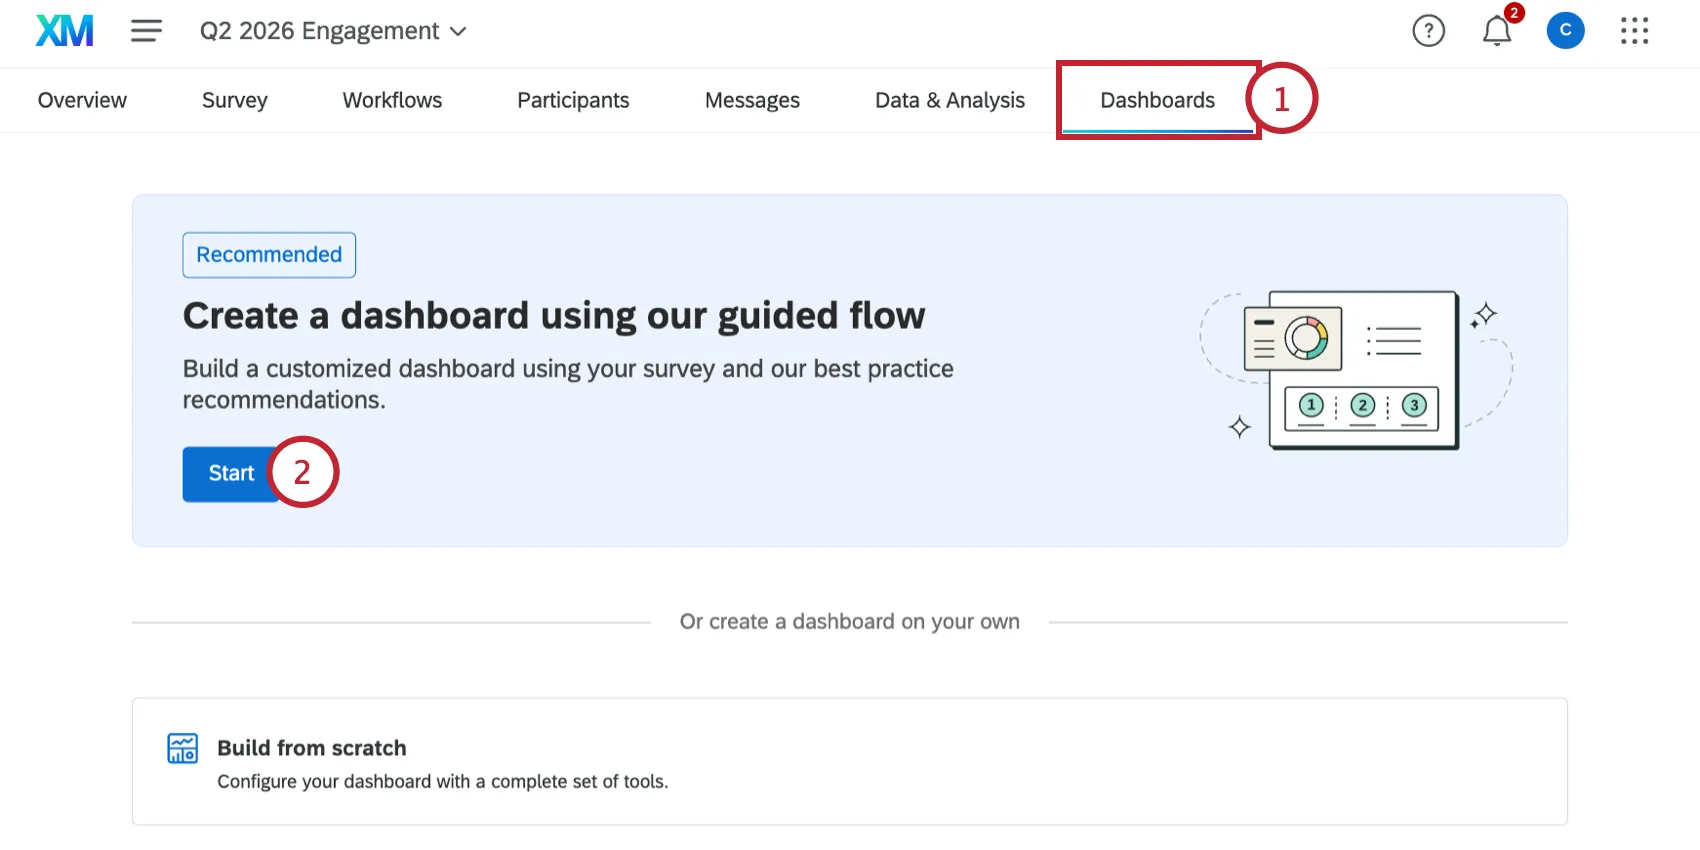
Click Start under "Create a dashboard using our guided flow."
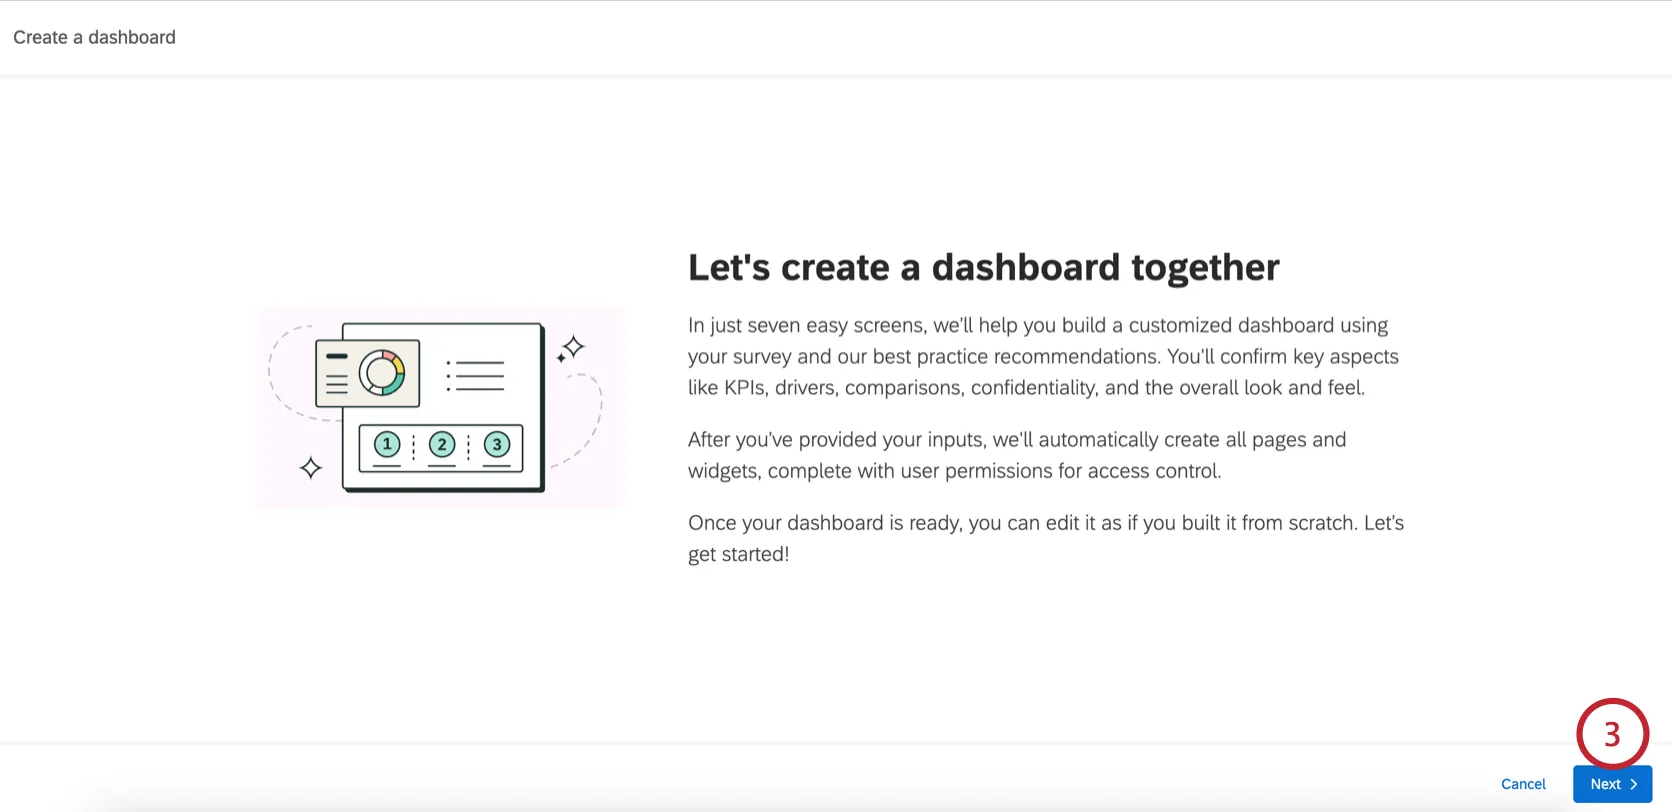
Click Next.
Qtip: If your project does not meet the requirements, you’ll see a message prompting you to adjust your project before you can continue with the guided flow.
Configure the KPIs, which are automatically pulled from your Engagement survey. You can click the pencil icon next to any existing KPI to rename it.
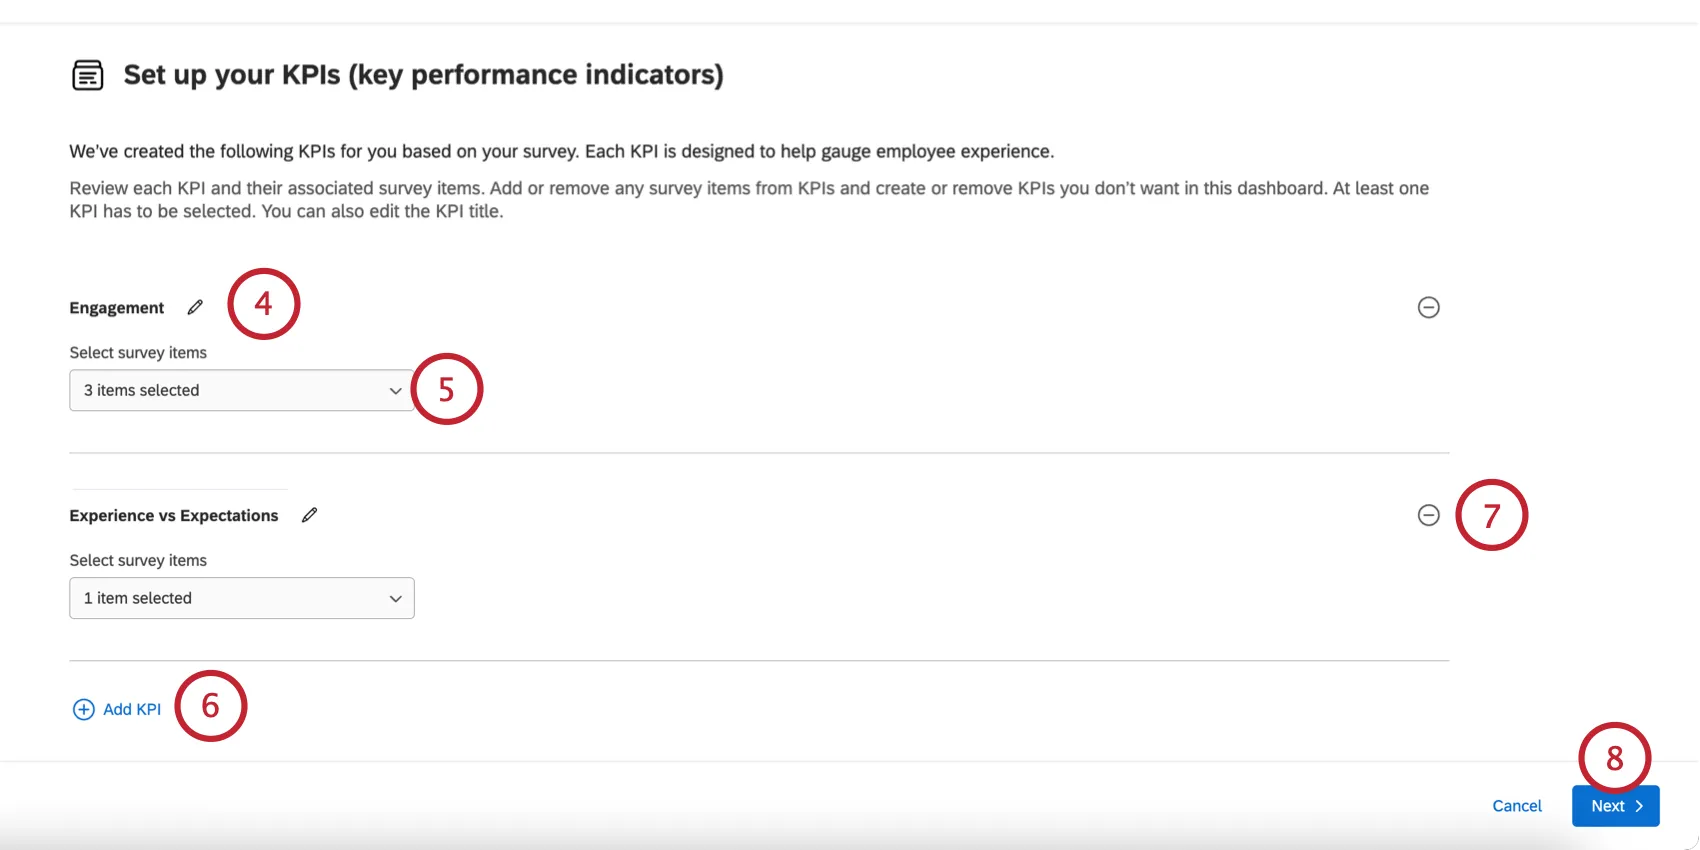
You can adjust the survey items included in the KPI by using the dropdown below the KPI.
Click Add KPI to track additional KPIs.
Qtip: You can add up to 5 KPIs.
To remove a KPI, click the minus sign ( – ) next to it.
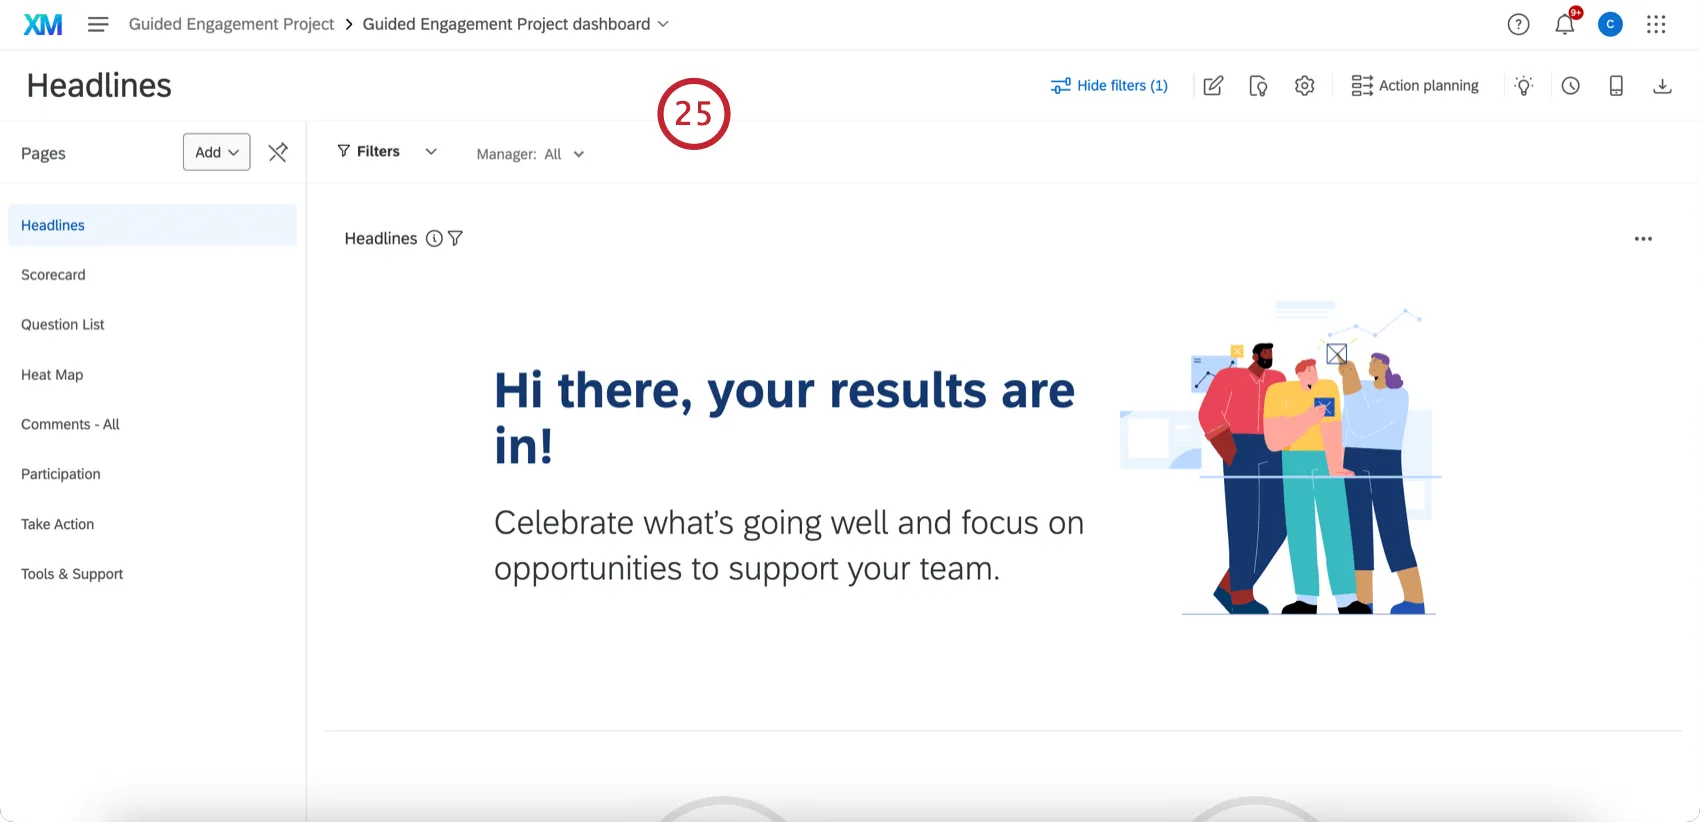
Click Next.
Configure the driver categories, which are automatically pulled from your Engagement survey. You can click the pencil icon next to any driver to rename it. Use the dropdown menu below the driver to edit the items that contribute to the driver.
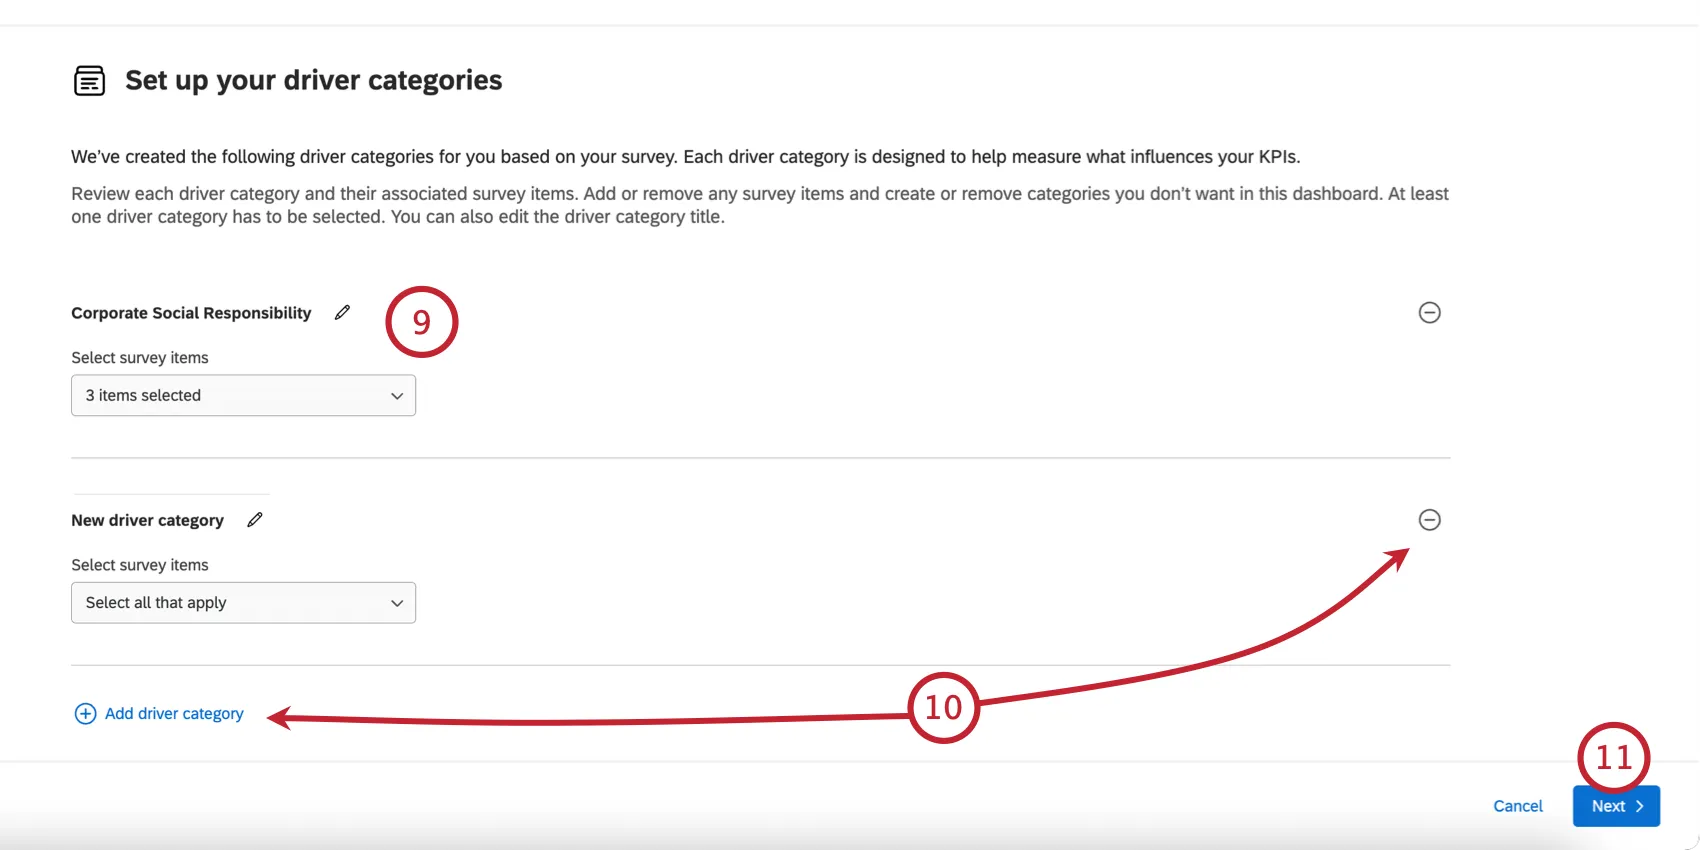
You can add drivers by clicking Add driver category and you can remove a driver by clicking the minus sign ( – ) next to it.
Qtip: You can add up to 35 driver categories. You can add up to 100 questions across all driver categories and up to 100 items per category.
Click Next.
Choose the comparisons you’d like included in your dashboard:
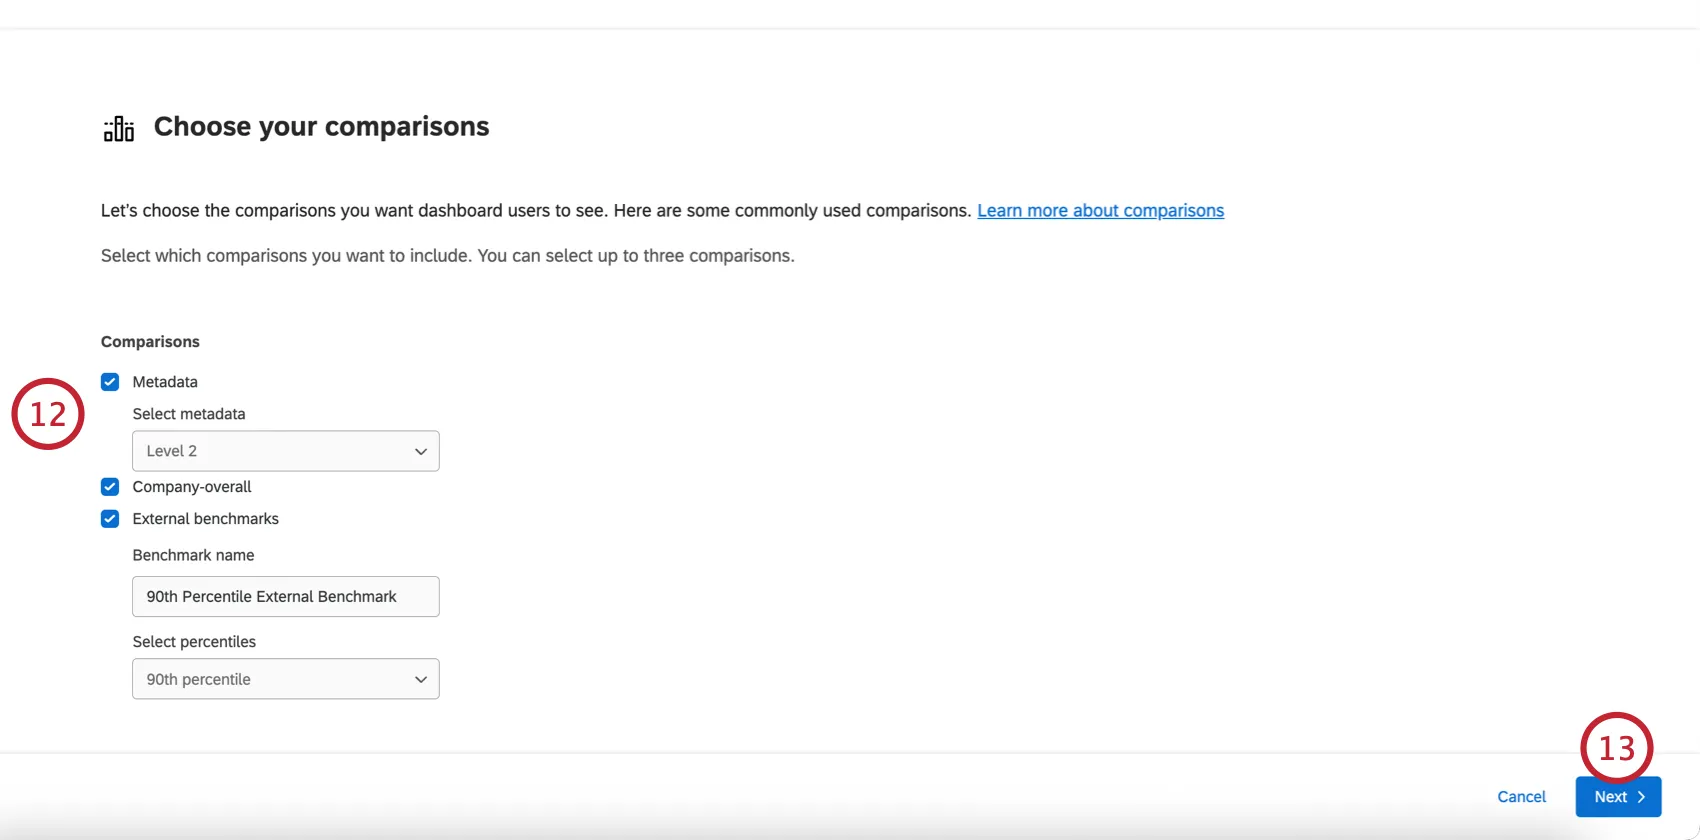
- Metadata: Add a comparison based on a metadata field. After selecting this option, choose the metadata field to compare by (e.g., “Location”).
- Company-overall: Add a comparison for the company overall vs the current unit.
- External benchmarks: Add a percentile-based comparison from an external benchmark. After selecting this option, name the benchmark and choose the percentile.
Click Next.
Choose your anonymity threshold for displaying data points.
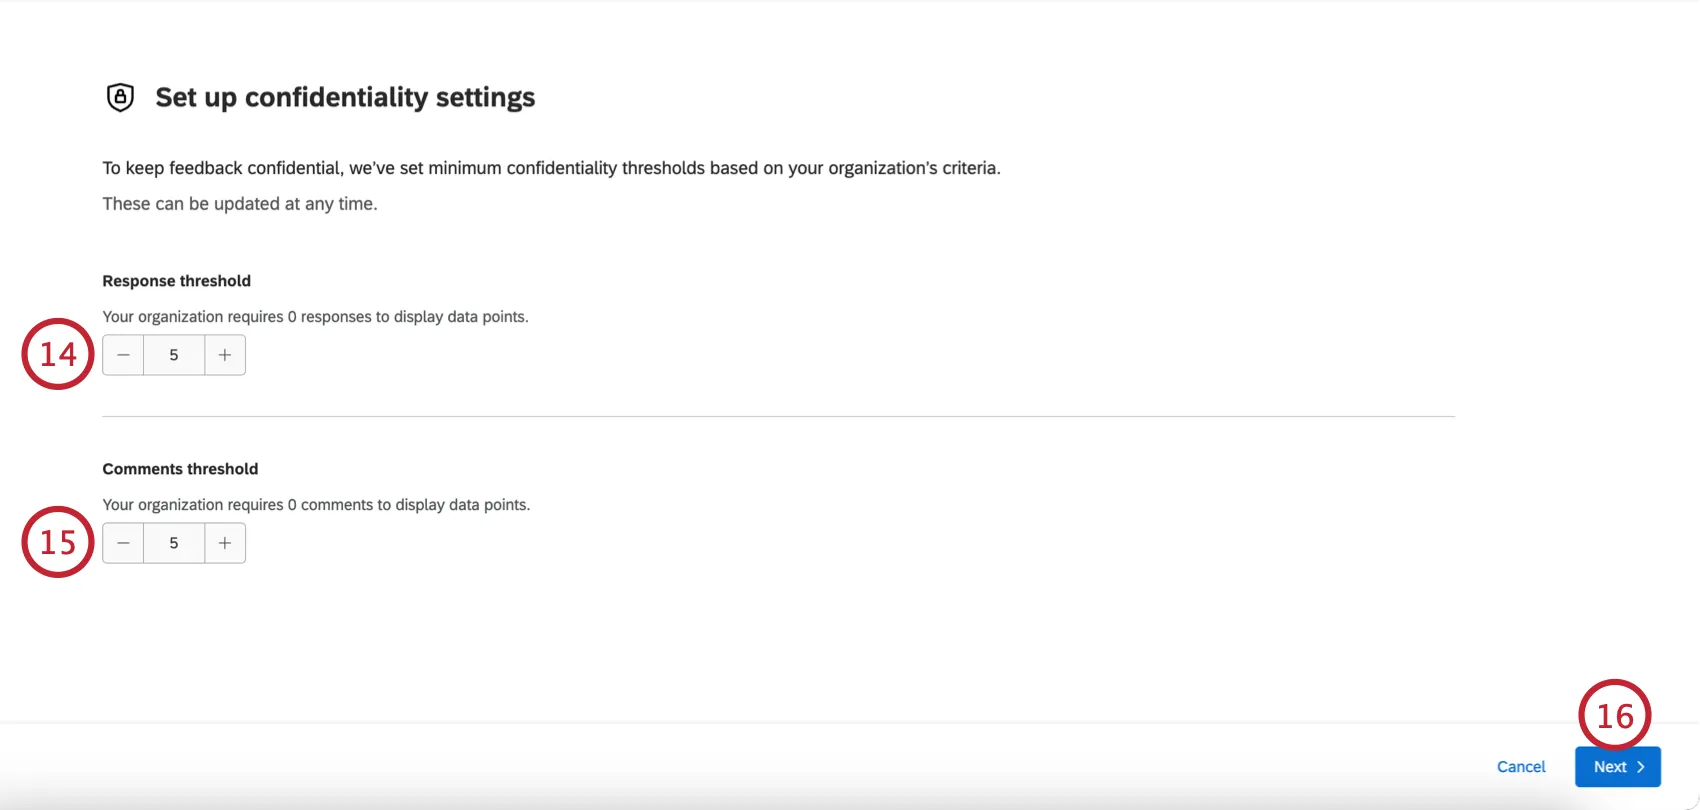
Choose your anonymity threshold for displaying text comments.
Qtip: Default minimum thresholds will be set based on your organization’s settings.
Click Next.
Edit the filters and breakouts in your dashboard:
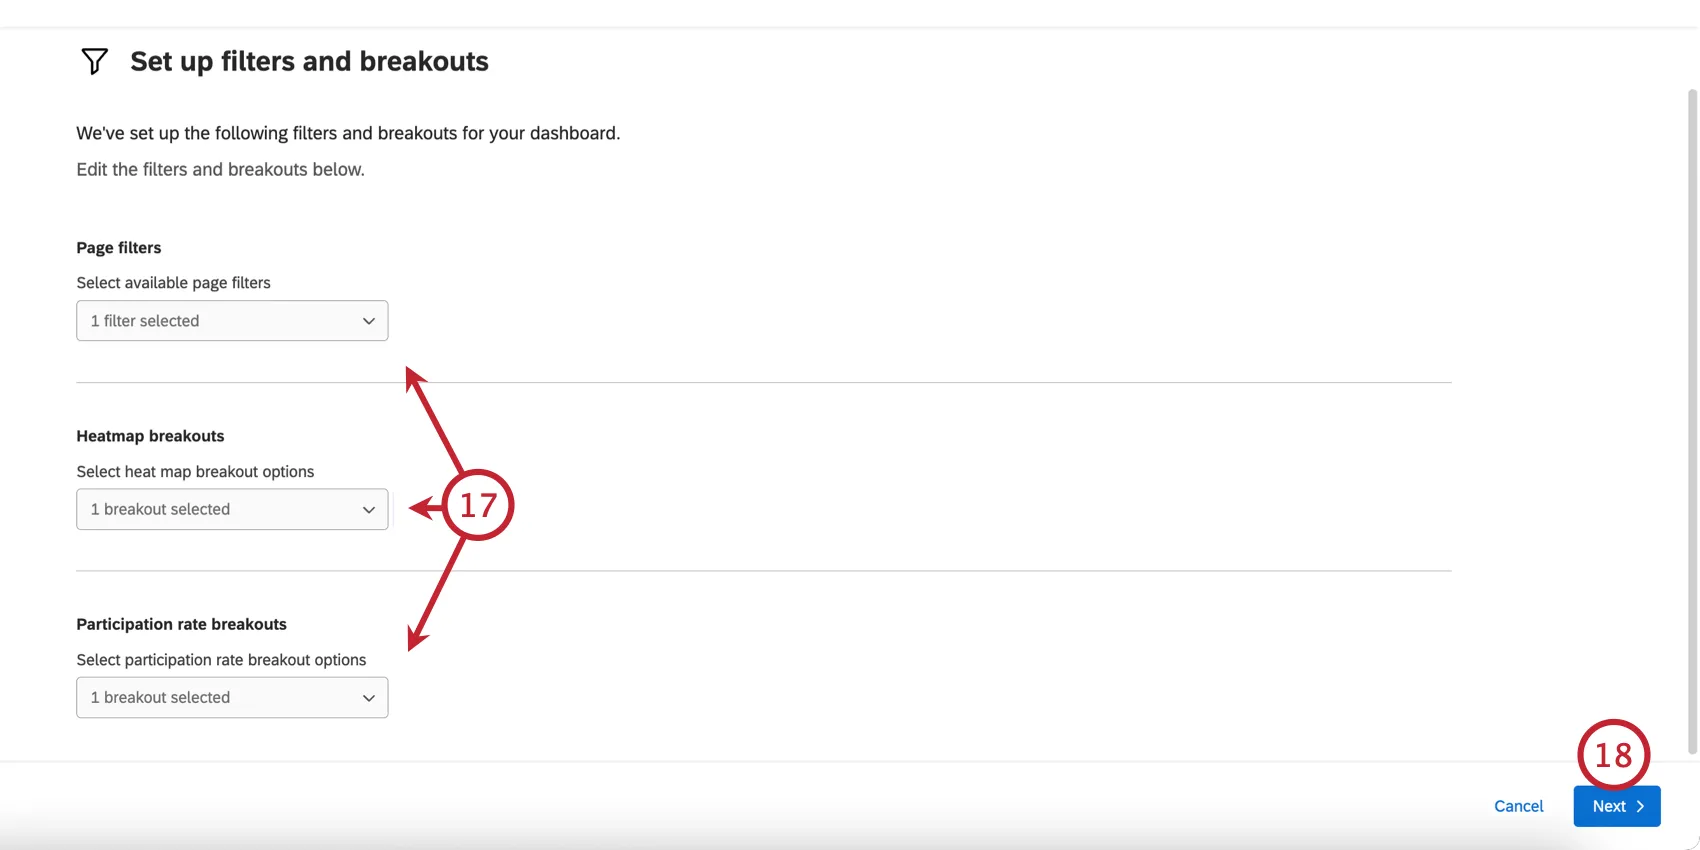
- Page filters: Select the metadata fields to use as dashboard page filters.
- Heatmap breakouts: Choose the breakouts to use in your heatmap widget.
- Participation rate breakouts: Choose the breakouts to use in your participation rate table widget.
Click Next.
Choose if you’d like to enable Action planning. You can always change this later in your dashboard settings.
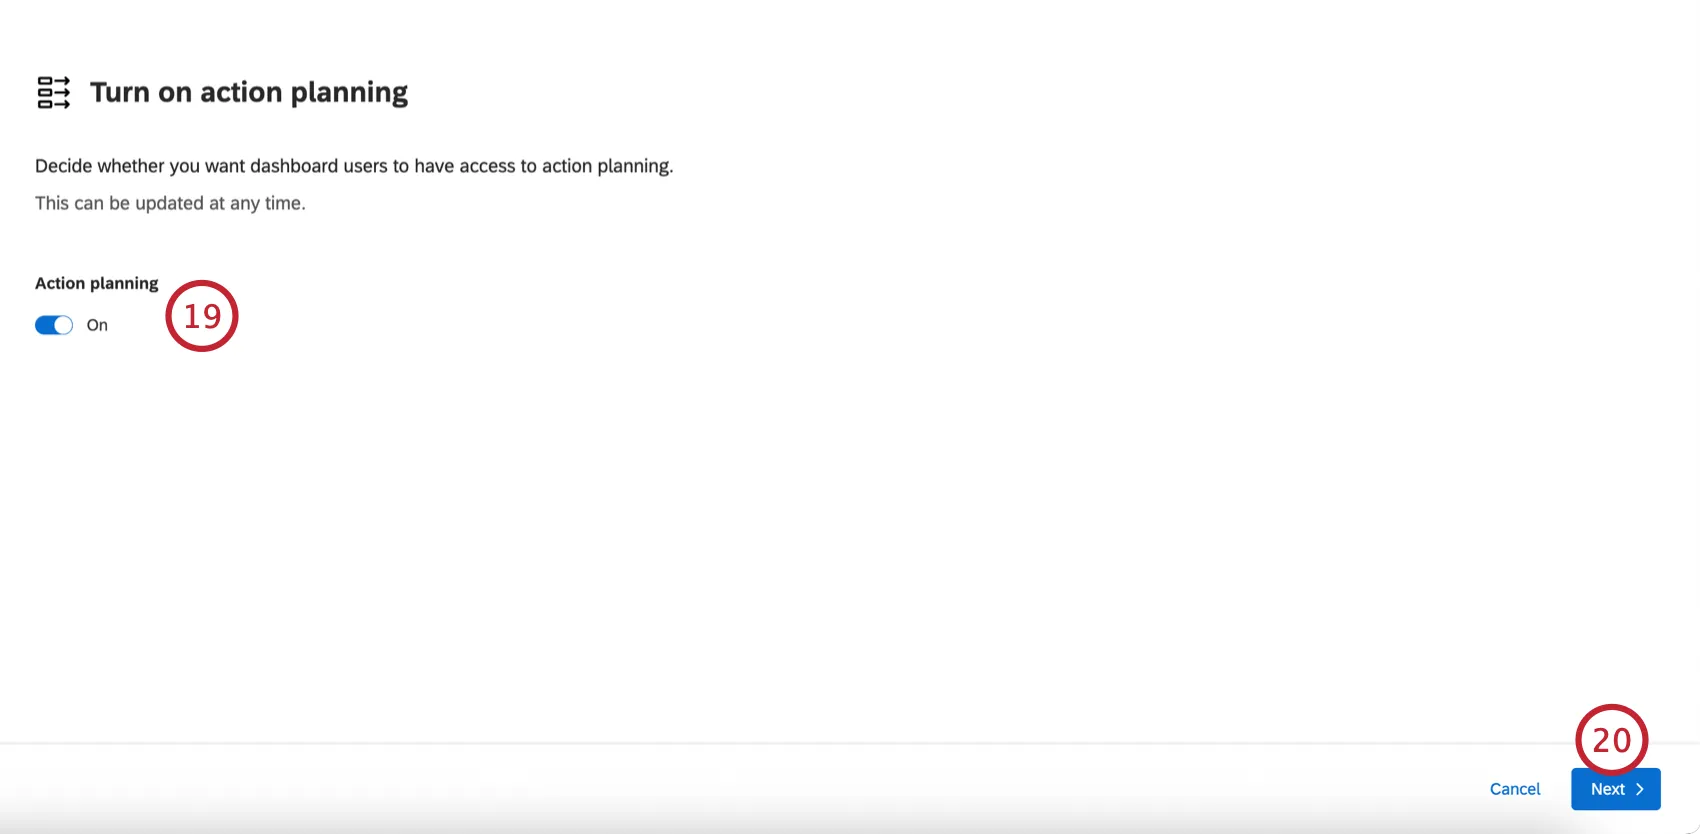
Click Next
Customize your dashboard look and feel. This includes:
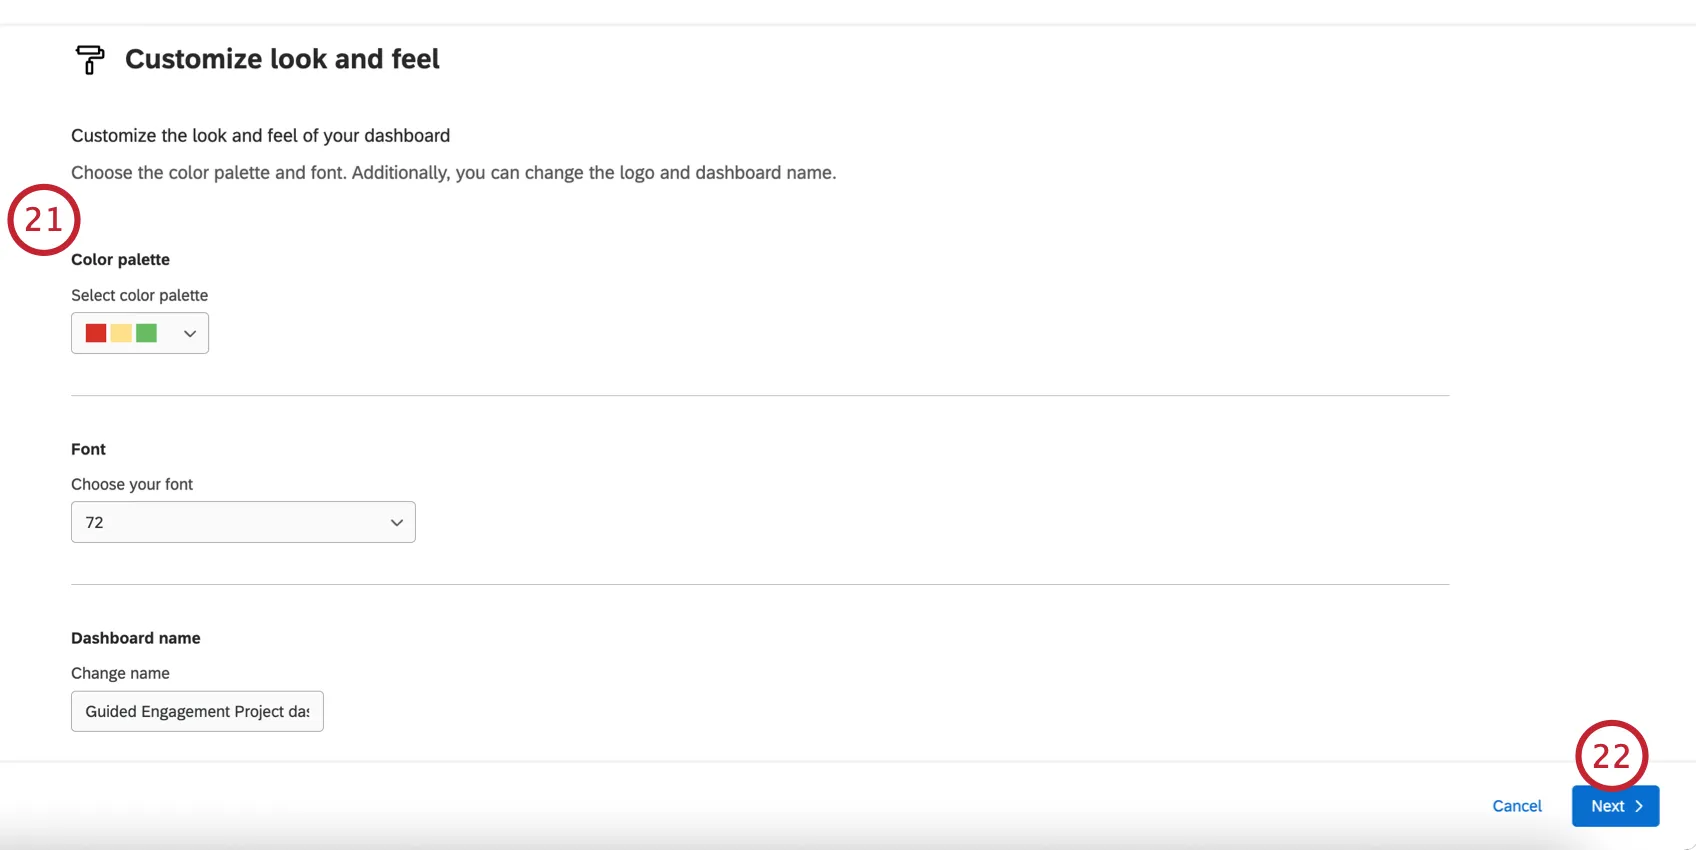
- Color palette: Select a color palette for your dashboard.
- Font: Choose a default font for your dashboard:
- Dashboard name: Enter a name for your dashboard. You can rename it later if needed.
- Logo: If you’d like to add a logo to the dashboard, enter a logo’s URL.
Click Next.
Review your dashboard settings. If needed, you can click “Back” to return to previous steps in the setup.
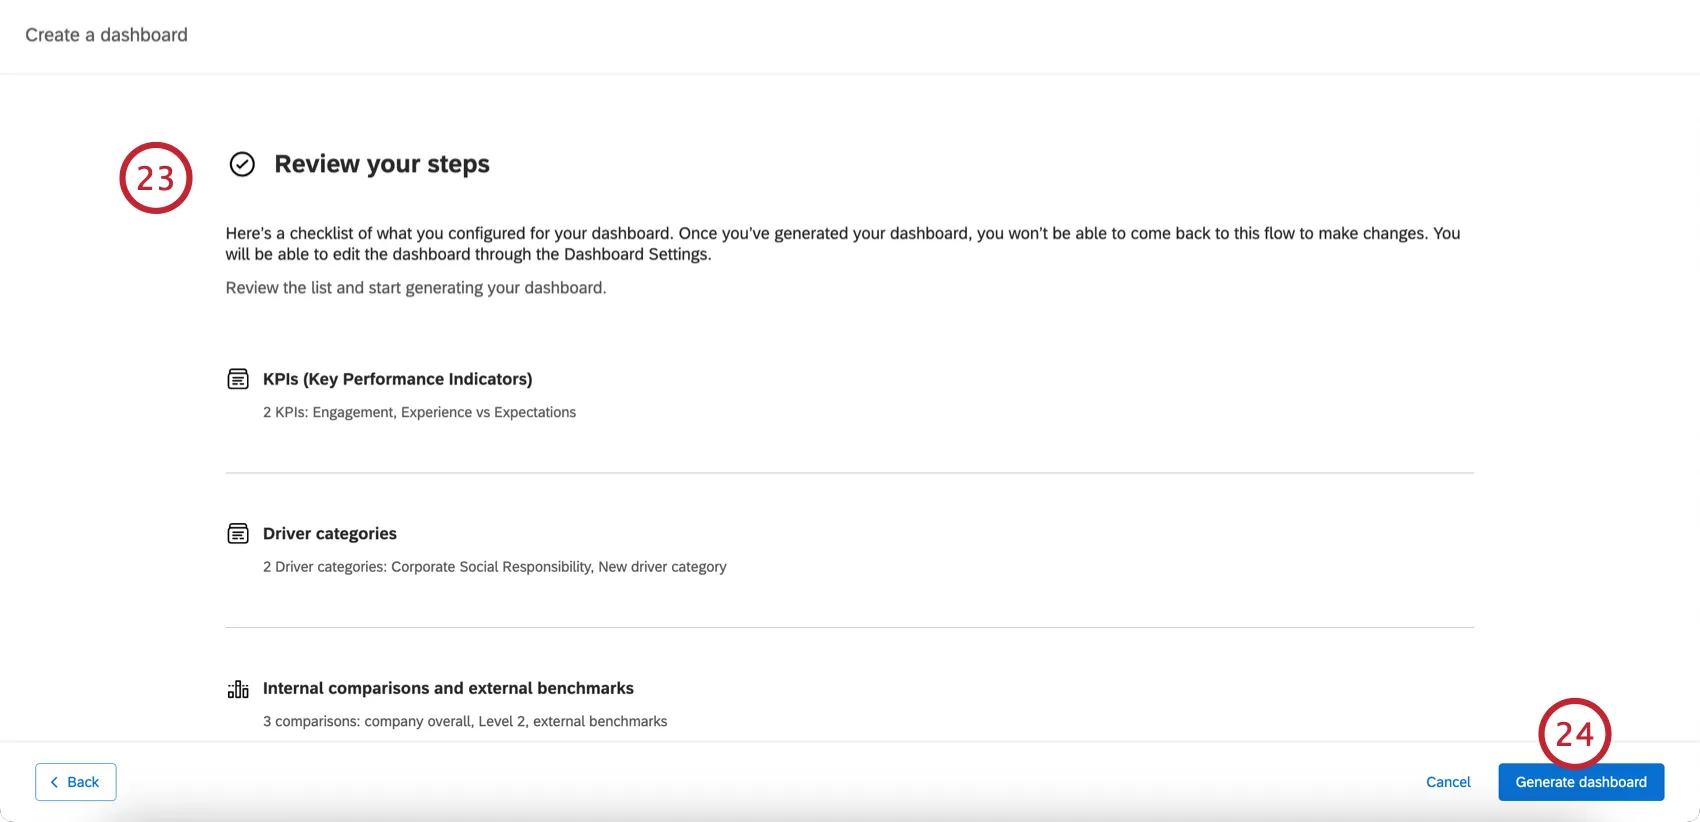
Click Generate dashboard.
If needed, you can further edit your dashboard.
Removing a Dashboard
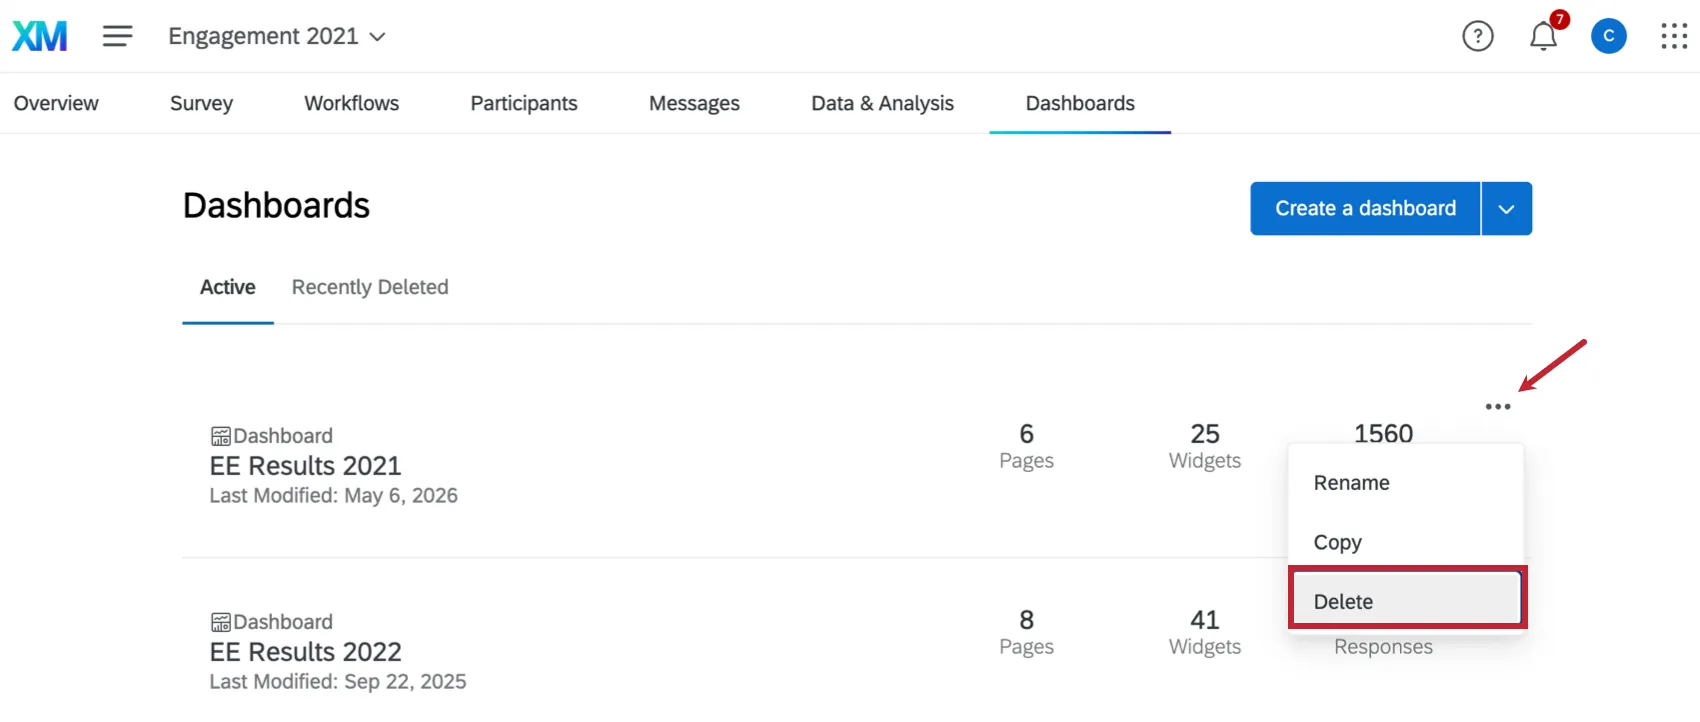
You can delete a dashboard by clicking the dashboard dropdown menu next to a dashboard and selecting Delete.
Attention: Deleted dashboards can be restored for 30 days after they are deleted. After 30 days, the dashboard and all of its resources are permanently deleted and cannot be recovered. See Restoring Recently Deleted Dashboards for more information on restoring deleted dashboards. Note that this page is about CX Dashboards, but the functionality is the same in EX dashboards.
Copying a Dashboard
Have you ever wanted to add a second, similar dashboard, without starting from scratch? Have you ever wanted to use a duplicate dashboard for testing? You can duplicate a dashboard’s pages, widgets, and all other settings.
What’s Included in a Dashboard Copy
Dashboard copies do carry over the following from the original dashboard:
- Widgets
- Filters
- Dashboard settings
- Data sources
- Comparisons
- Categories
- Scales
- Anonymity settings
- Translations (label, data, and guided)
Roles (including all permissions)

Qtip: Roles are deactivated by default. See Dashboard Viewing Permissions below.
- Org hierarchies
Not every setting and detail in a dashboard is duplicated when you copy a dashboard. The following features do not carry over:
- Report Templates
- Report Template Translations
How to Copy a Dashboard
Click the dashboard actions dropdown.
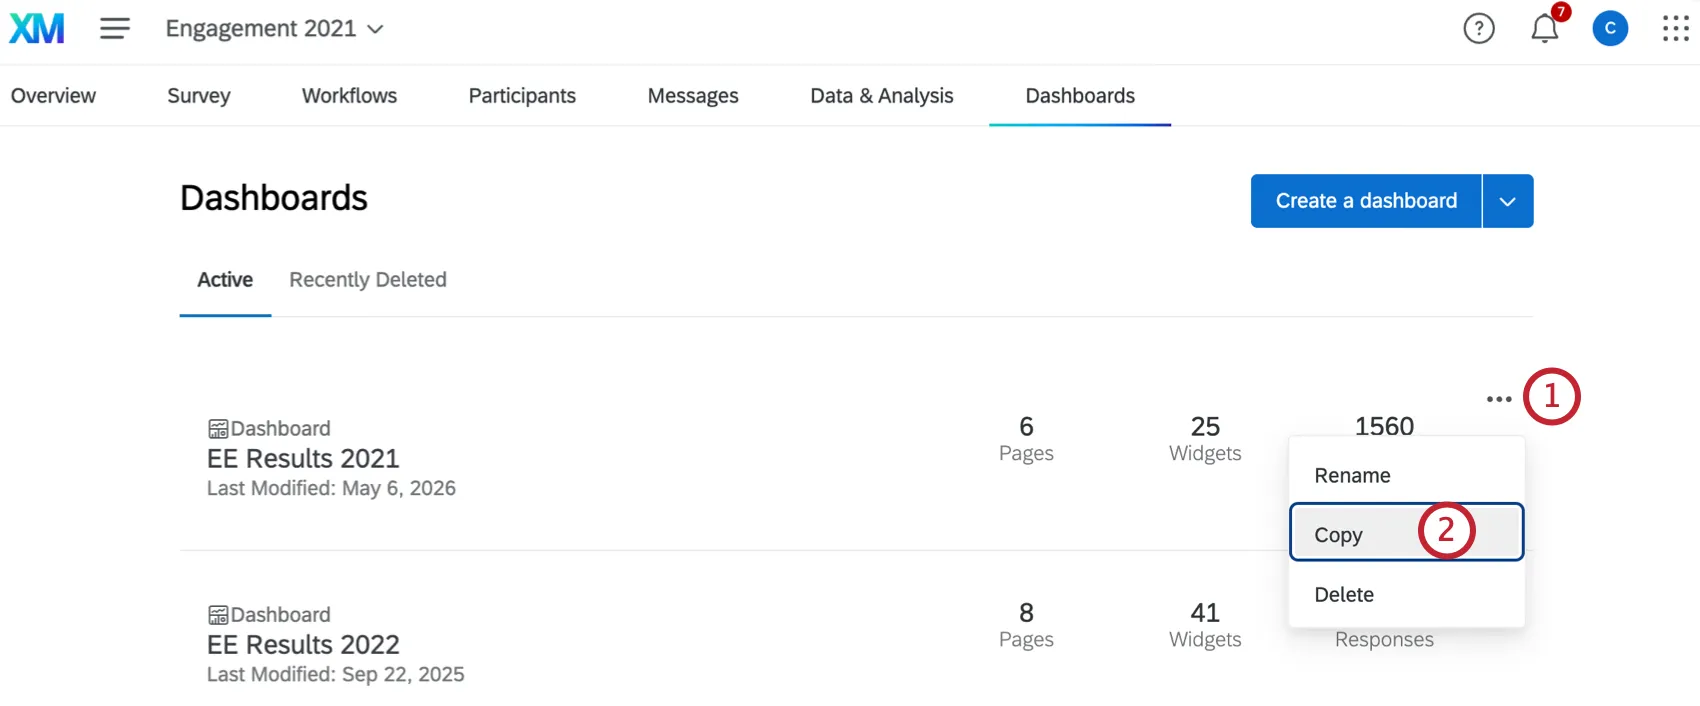
Select Copy.
Name your dashboard.
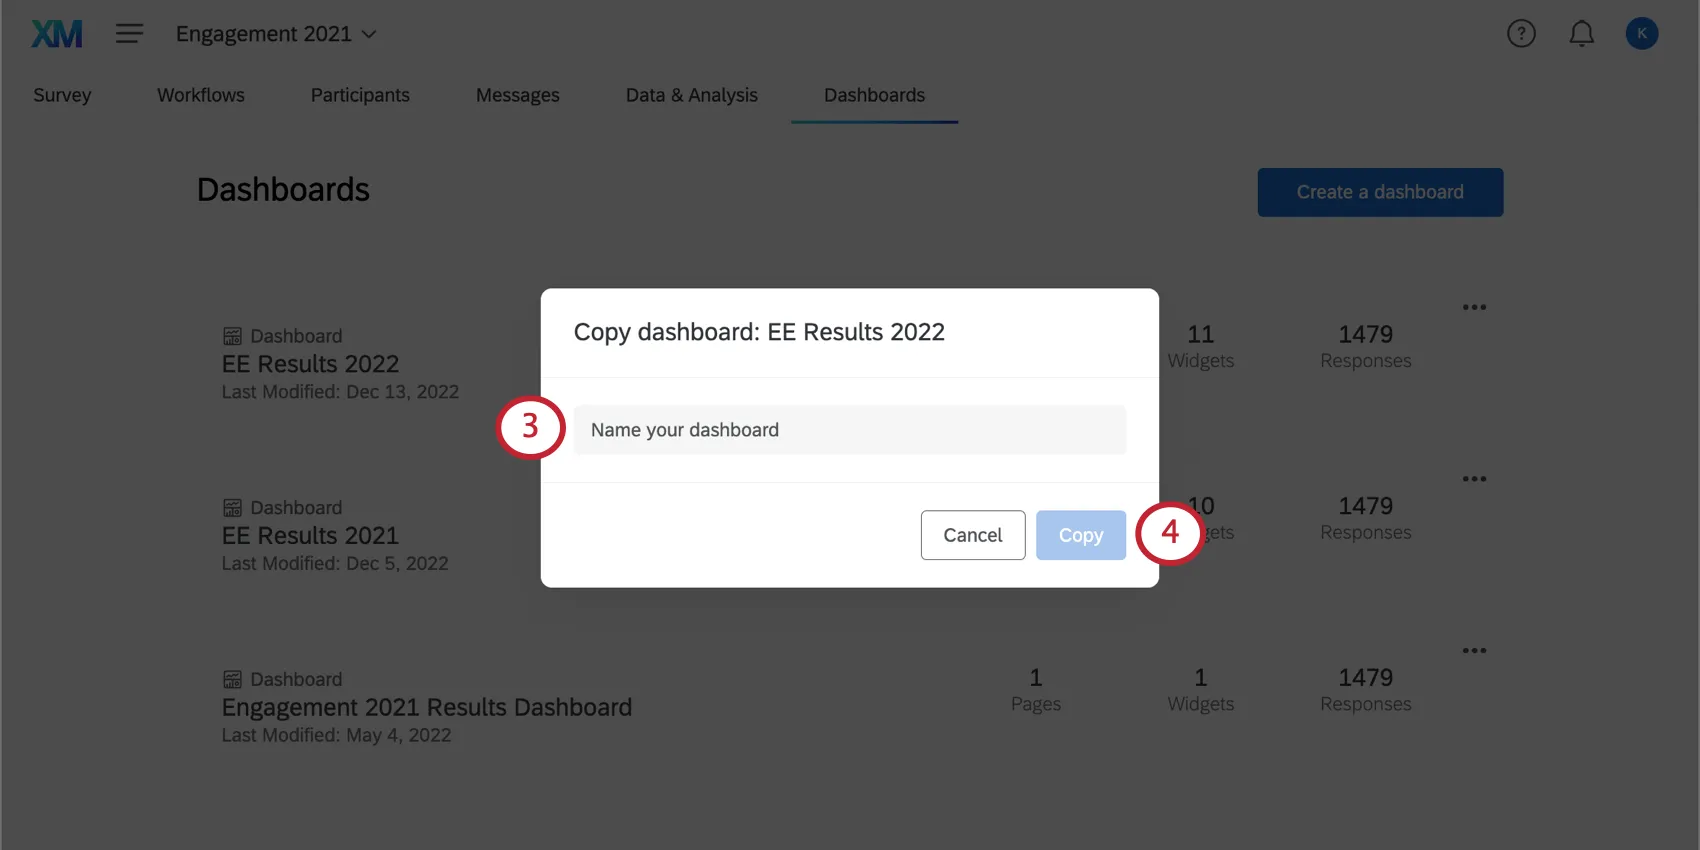
Click Done.
Dashboard Viewing Permissions
When you copy a dashboard, you also duplicate dashboard role permissions. However, the dashboard isn’t activated; you must manually enabled theActivate Dashboard permission.
Example: In the screenshot below, this role gave members the ability to access to Company Dashboard 1. When Company Dashboard 1 was copied, participants in this role were automatically given access to Company Dashboard 2 (the copy), too.
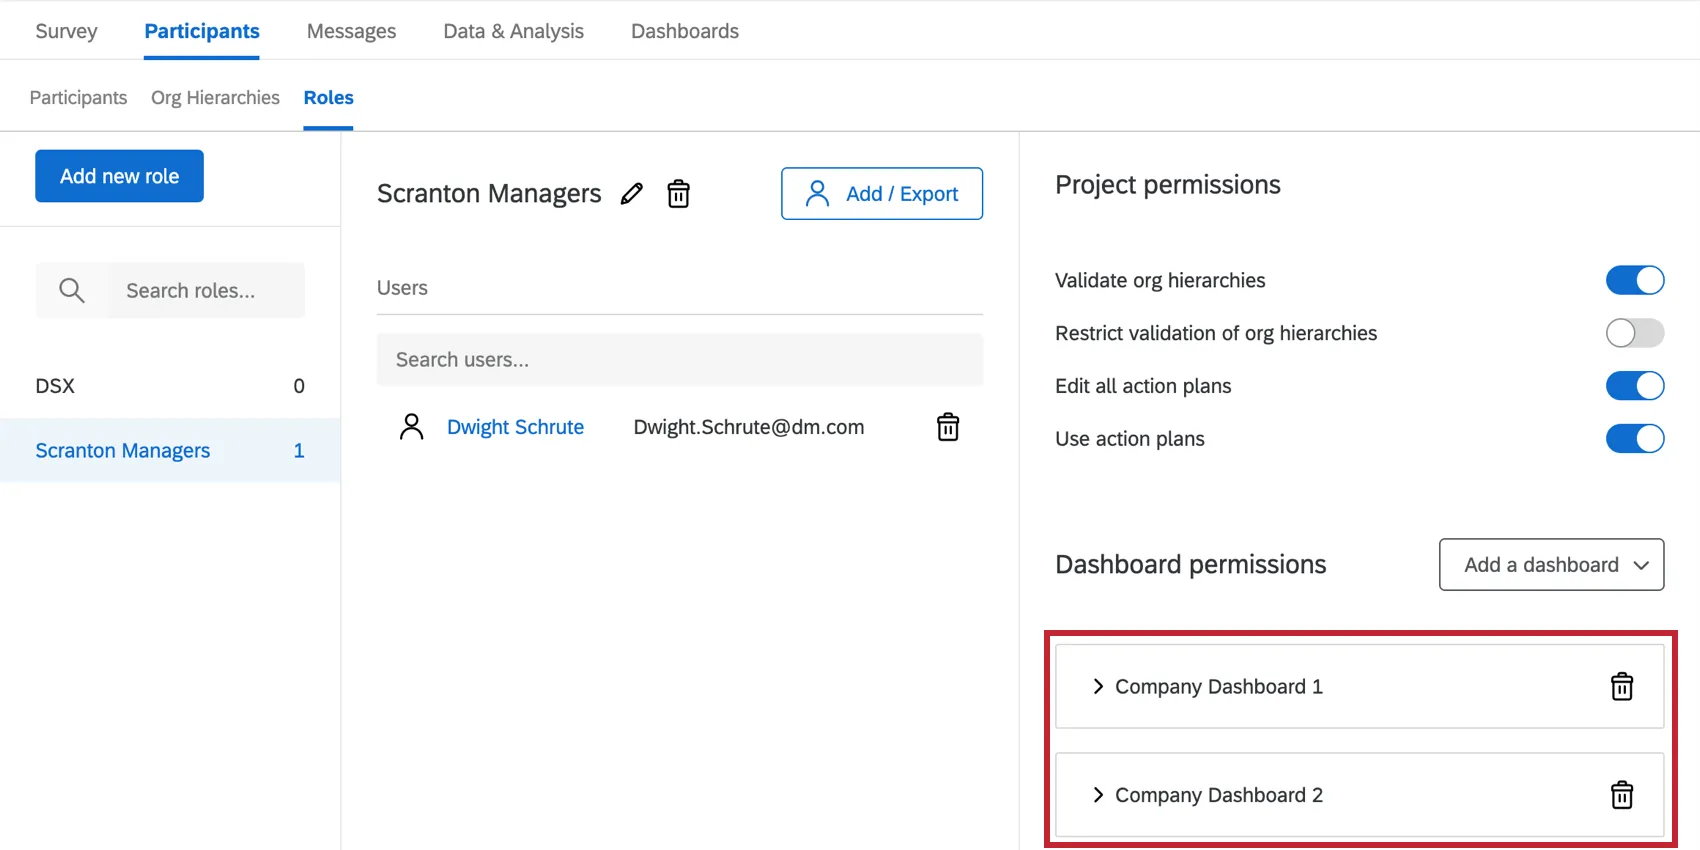
Copying a dashboard does not copy user-level access!
Example: If you give John Doe user-level access to Company Dashboard 1, then copy this dashboard, John Doe will not have access to the copy.
Dataset Utilization Limits
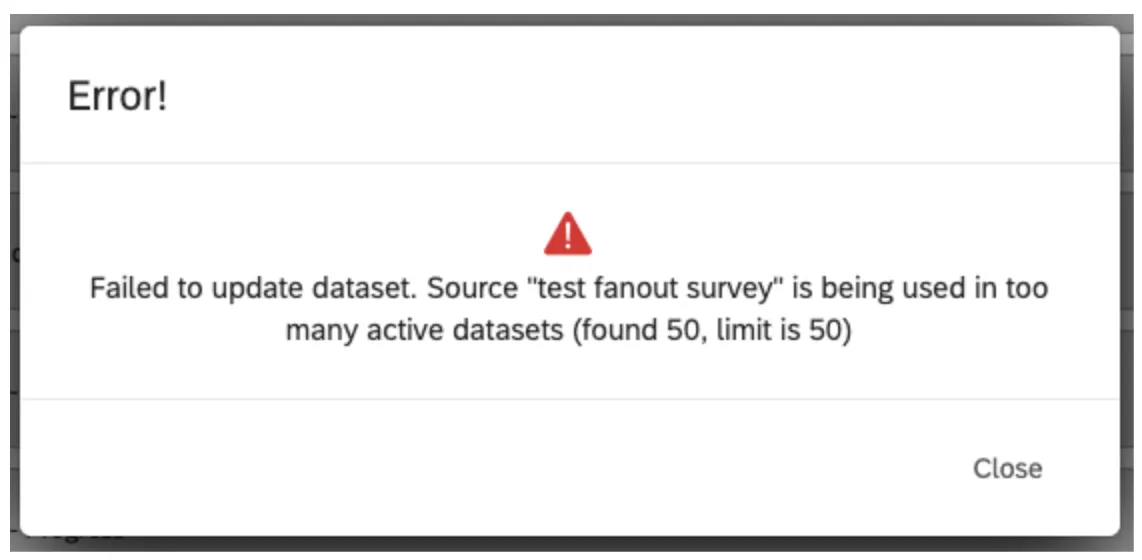
Our data platform imposes a limit on the number of times a single data source can be used in active datasets. Currently, a single data source can only be in 50 active datasets to guarantee timely data processing. For external data, the limit is 5 active datasets. These limits are subject to change over time as our platform and features grow. If your datasource reaches this utilization limit, an error dialog is displayed while adding the source in the data mapper or copying the dashboard.
Qtip: For example, a survey used in two dashboards creates three active datasets (1 for data & analysis, 2 for EX dashboards). An active dataset is a dataset that has been accessed within 30 days.
Additional Options
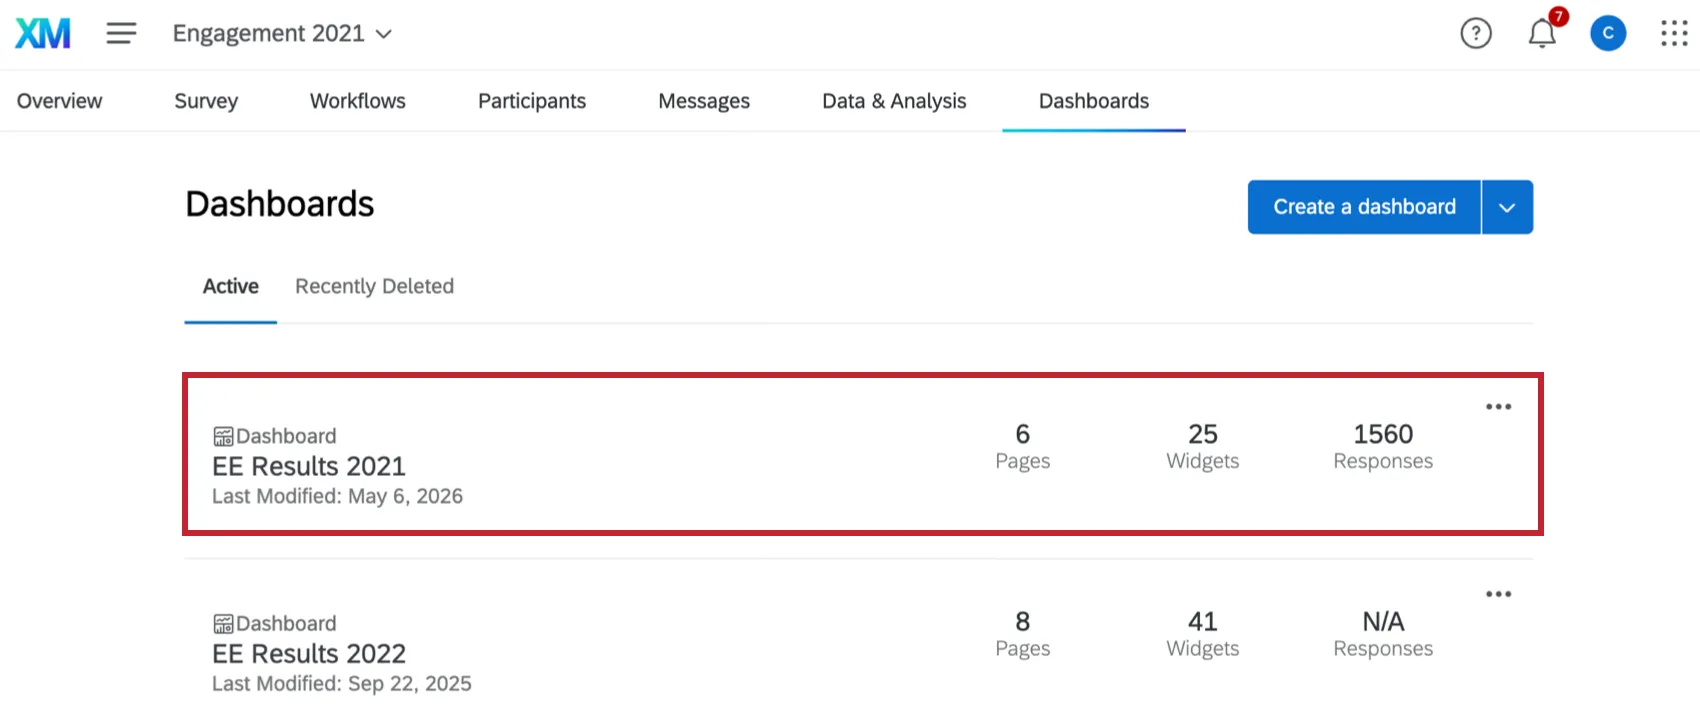
Each dashboard listed on the Dashboards tab shows the number of pages, widgets, and responses it has.
You can access your dashboard and start editing by clicking anywhere on it.
Qtip: If you’re having trouble viewing the dashboard, make sure you’ve added yourself to the project and given yourself permission to view the dashboard.
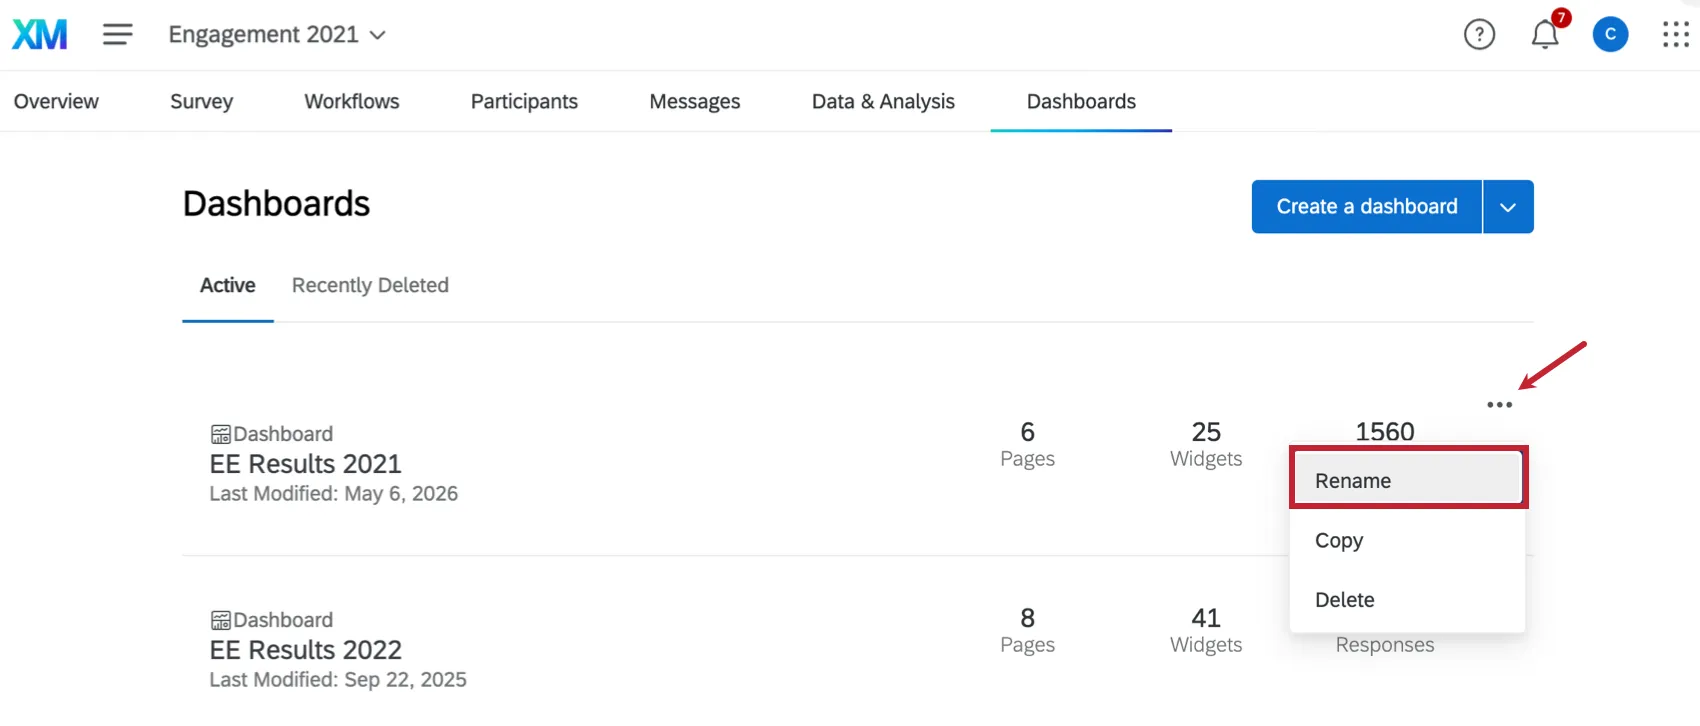
You can change a dashboard’s name by clicking the dashboard dropdown menu next to a dashboard and selecting Rename.
Qtip: Ready to start editing your dashboard widgets? Check out our Dashboard Overview page.
FAQs
I don't have the tab described on this page! What do I do?
I don't have the tab described on this page! What do I do?
That's great! Thank you for your feedback!
Thank you for your feedback!