
Filtering Dashboards (EX)
What's on this page
About Filtering Dashboards
You can filter your Employee Experience dashboards by applying a filter to every widget on a page or by applying filters to individual widgets. This allows you to dive into the data and find trends that you would not be able to see with the data in aggregate alone.
Detailed below is how to add and use dashboard page filters; if you would like more information about widget-level filters, visit the Widget-Level Filters section of the Widget Overview support page.
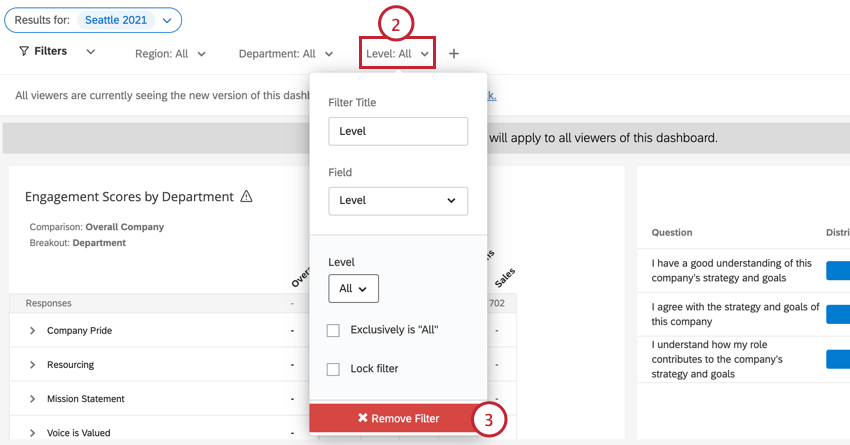
Note that adding filters in this manner only makes the filter available for dashboard viewers to use. When viewing a dashboard, you will still have to click your filter and define its conditions in order to have it apply to your results.
Attention: When filtering on a Number Set or Text Set field, the filter will display a maximum of 5,000 values.
Qtip: By default, dashboard page filters aggregate data across all mapped data sources. To limit what data sources are included in your filters, enable the Limit page filters to specific data sources setting in your Dashboard Settings.
Types of Dashboards Covered Here
This page describes how filtering works in the following dashboards:
Qtip: Keep in mind that only Engagement projects include hierarchies.
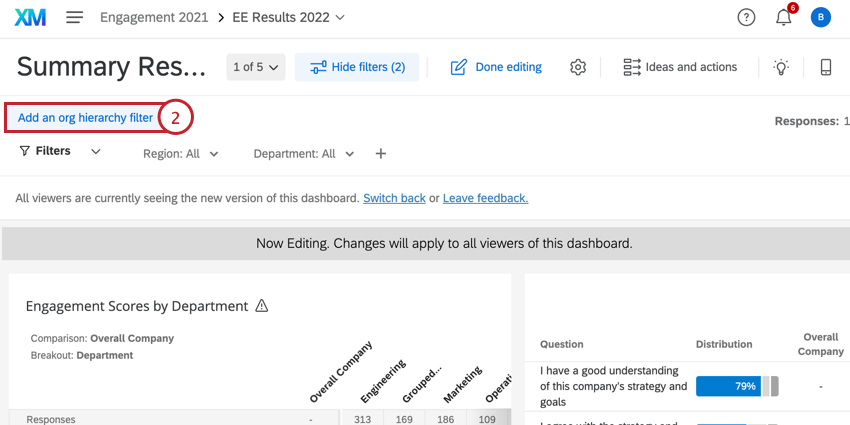
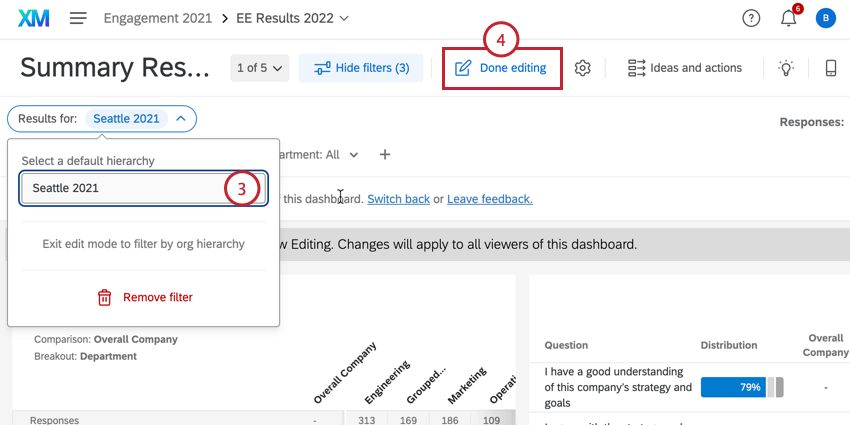
Filtering Dashboards by a Hierarchy
Some widgets require a hierarchy in order to function properly. Therefore, it is important to add a hierarchy filter to your dashboard first.
Qtip: If the “Limit page filters to specific data sources” setting is disabled, the page filters will include data for all mapped data sources, but the hierarchy filter will only use the primary data source.
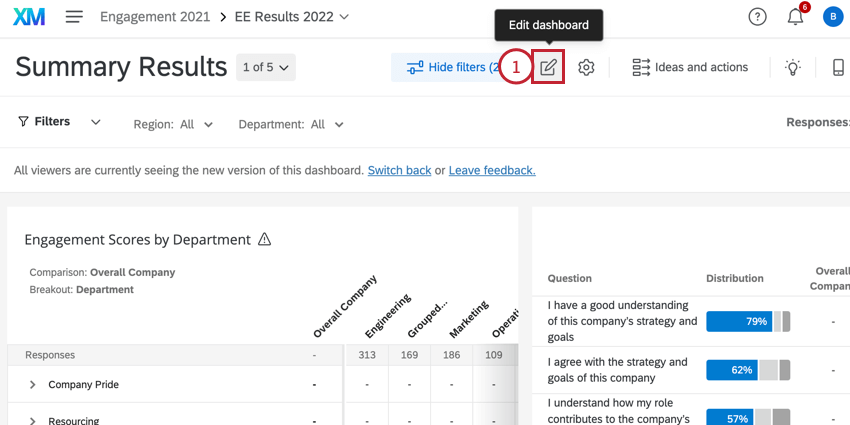
Adding Filters to Dashboard Pages
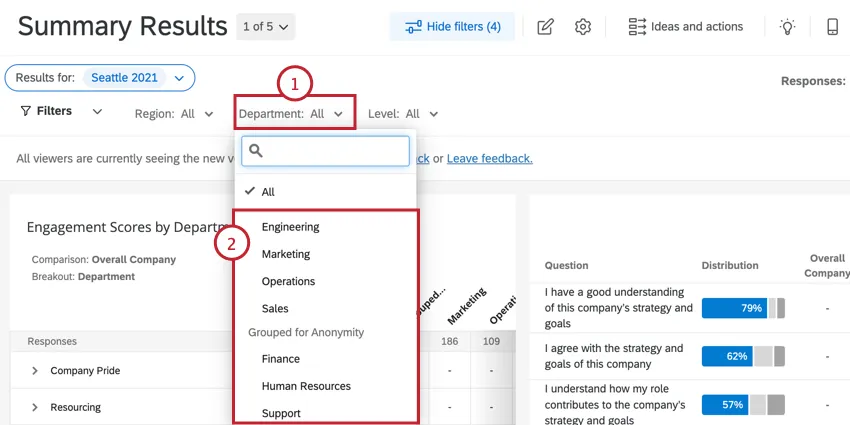
You can also filter your dashboard pages based on questions, Embedded Data, and metadata.
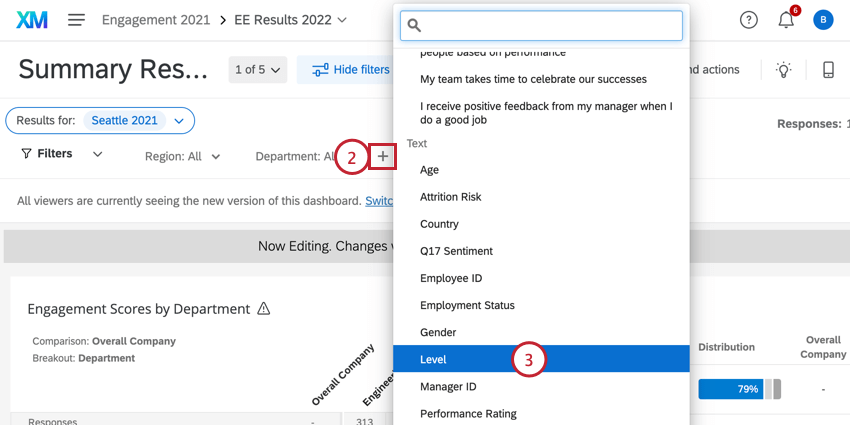
Qtip: Different data types will result in different kinds of filter options. For example, Text Sets will give you a dropdown list of options, while Numbers will give you a slider scale from which to select a number range (the number range corresponds to the answer choices’ recode values). You can change the data types of your questions and metadata inside the Dashboard Data.
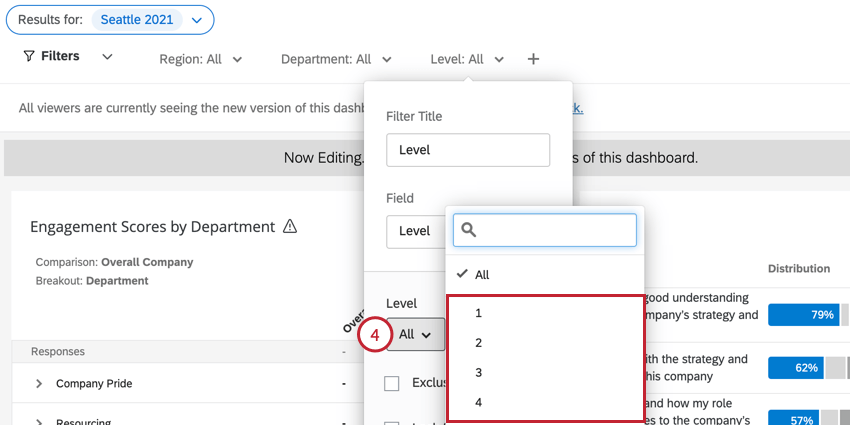
Example: Using this screenshot as an example, if you select “All,” users can switch between filters for any combination of employee levels. If you select only “1” and “2,” users will not be able to select the “3,” “4,” or “5” levels.
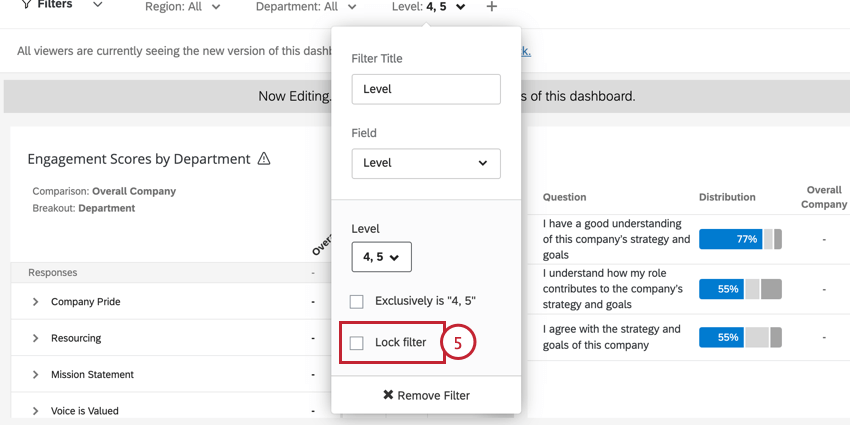
Warning: Locked filters are not a replacement for applying data restrictions to dashboard viewers. If you need to limit what data your dashboard viewers have access to, we highly advise you set up data restrictions using roles.
Applying Filters
Qtip: If you have enabled editing on your dashboard, the filters you select will not just filter the dashboard for you, but change the filter settings available to dashboard users. Click Done editing to disable editing and then apply filters.
Using an Org Hierarchy Filter
Qtip: The functionality described in this section also applies to CX Dashboards.
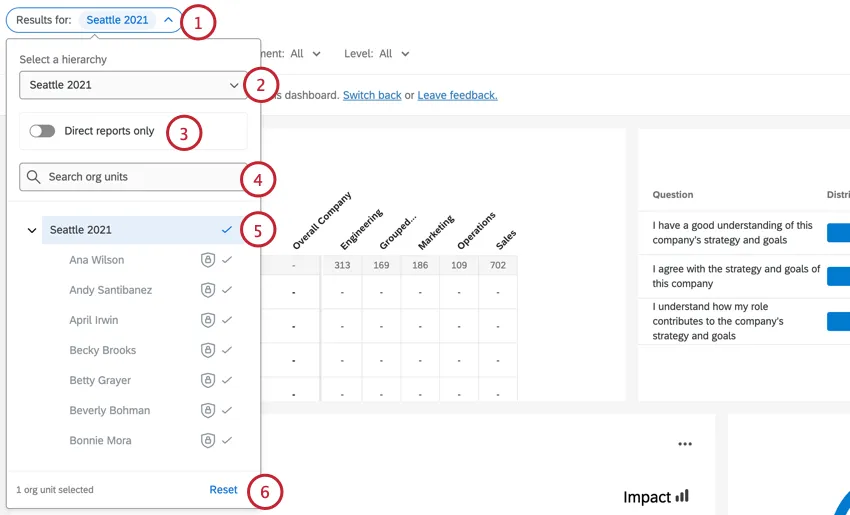
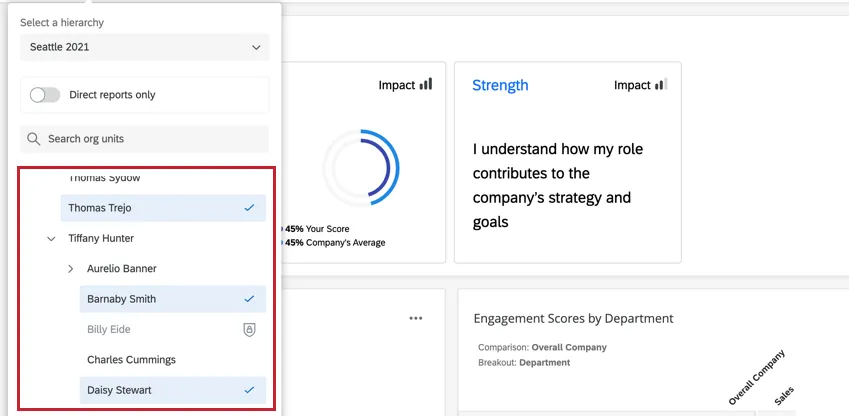
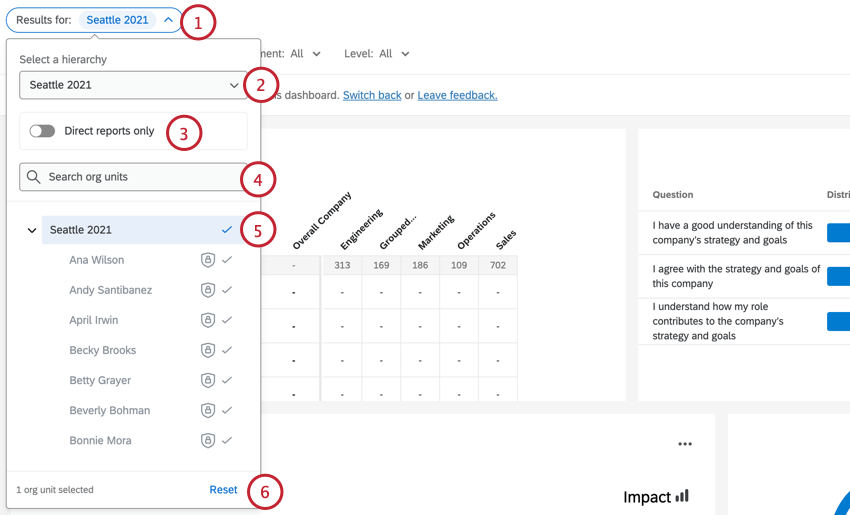
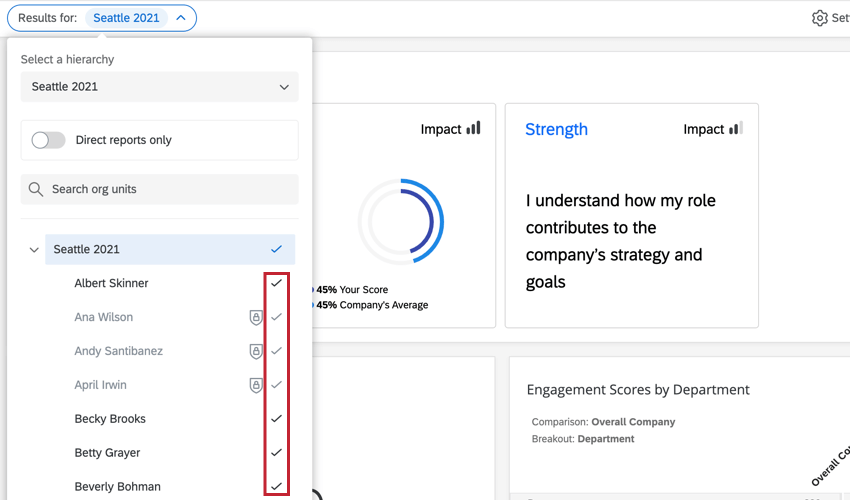
To use an org hierarchy filter, click on the filter and choose the unit you want to view. If the multi-select org hierarchy dashboard setting is enabled, you can choose multiple units to view their data in aggregate. Selected units will be highlighted in blue. You can also see the number of selected units in the bottom left hand corner of the filter. Any units that are being displayed will have a check mark next to them.
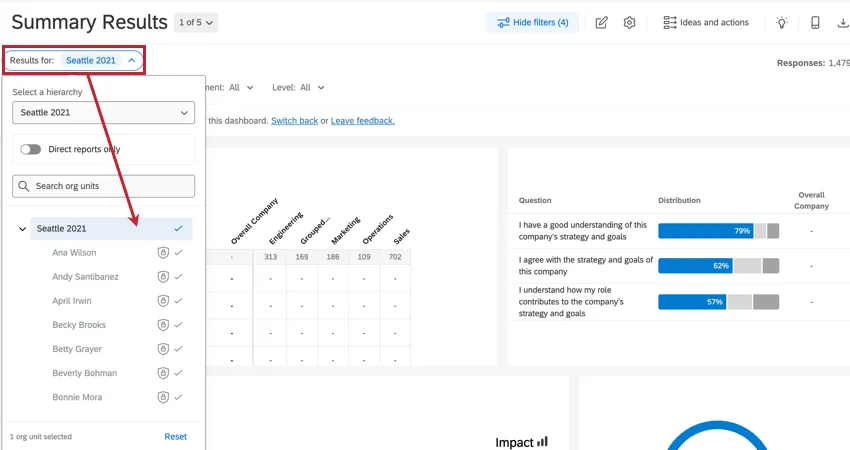
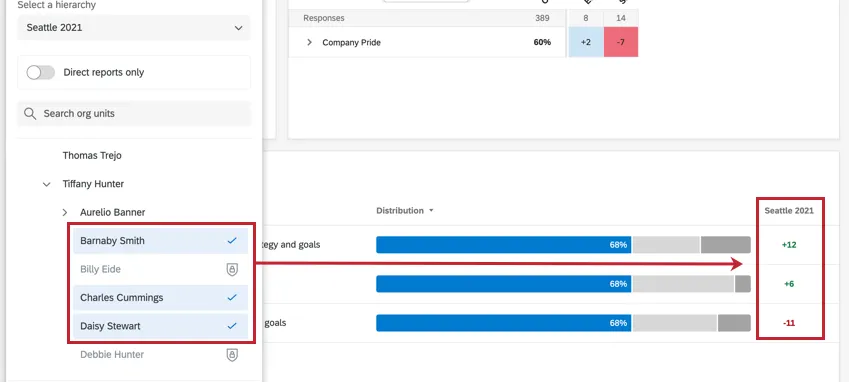
If a unit is grayed-out, that means you do not have permission to view data in that unit, or that unit does not meet your confidentiality threshold. Hover over the shield icon to see more information about that unit.
Qtip: If you see the wrong number of responses when filtering by the hierarchy, it’s likely that your hierarchy was updated but the changes were not pushed to the dashboard. This can be fixed by running an Update all responses with current metadata job.
The main parts of an org hierarchy filter are:
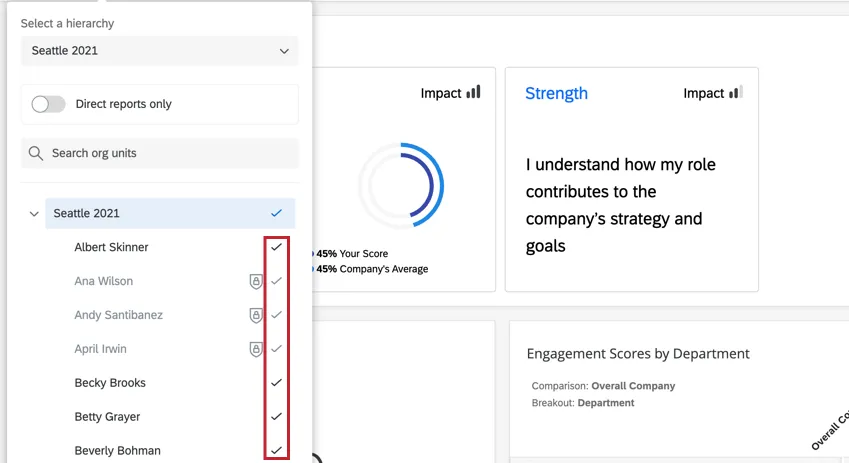
When using the filter, it is important to pay attention to what data is included in your selected unit. If you select a unit that has sub-units, the sub-unit data will also be included. Included sub-units will have a checkmark next to their unit name.
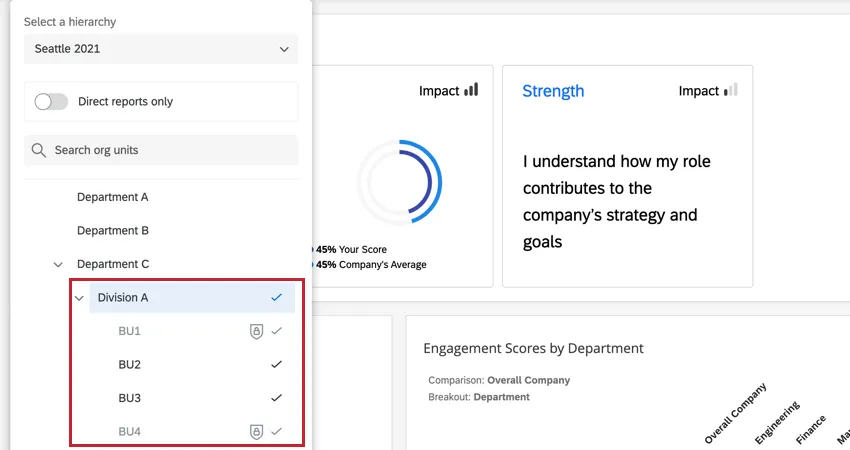
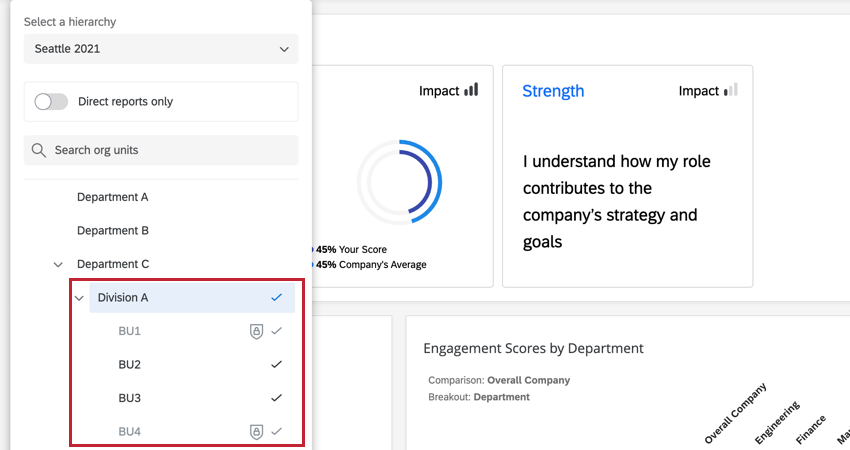
Example: In this example, the Division A unit is selected. This unit has four sub-units: BU1, BU2, BU3, and BU4. When Division A is selected, you will see the data for participants in Division A, BU1, BU2, BU3, and BU4.
Qtip: If you have a large hierarchy with “All Results Below Them (all levels)” dashboard permission enabled, the hierarchy filter might not display properly. In the event that the hierarchy filter does not display properly for users with this permission, switch to using the “In or Below” dashboard permissions for the affected users.
Selecting Multiple Units with an Org Hierarchy Filter
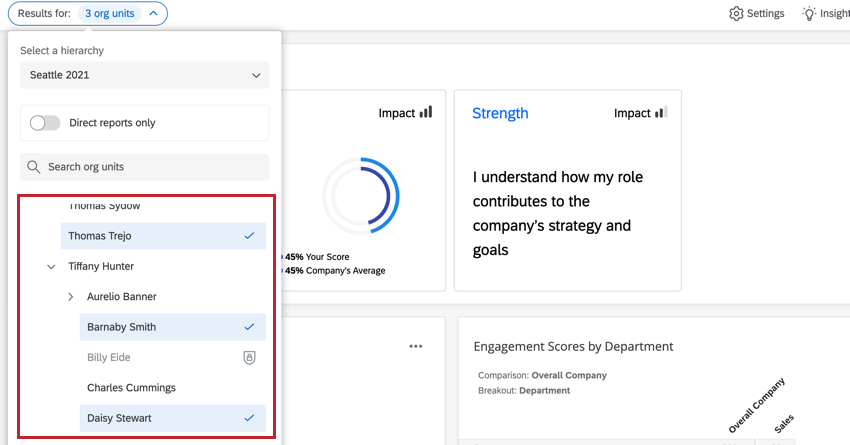
When filtering your dashboard by an org hierarchy, you can select multiple units to include in the filter. Results are aggregated across all selected units when multiple units are selected.
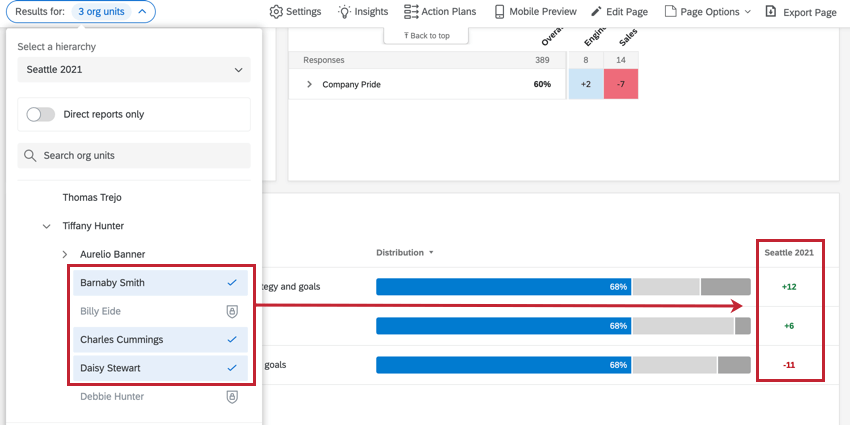
Example: In this example, we’ve selected three units in our org hierarchy filter, as indicated by the units being highlighted in blue.
Please be aware of the following limitations and interactions when filtering for multiple org hierarchy units:
- You may select up to 20 units with your org hierarchy filter.
- The Direct Reports Only filter option changes the behavior of selecting multiple units. Note that this option is disabled by default:
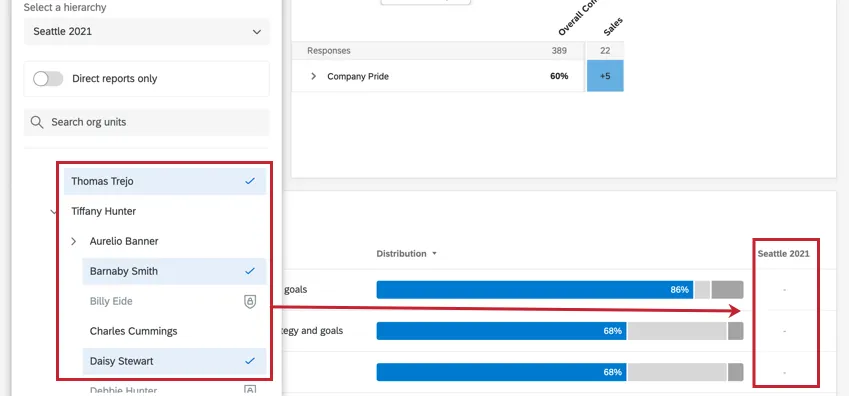
- Disabled: When disabled, you cannot select units that are direct ancestors or descendants of other units. This is to prevent the double counting of responses. Example: In this example, Charles Cummings and Daisy Stewart are child units of Tiffany Hunter and they are initially selected in the hierarchy filter. Since direct reports only is disabled, when Tiffany is selected, the other two units are deselected. Similarly, if Charles or Daisy are reselected, then Tiffany will be deselected.

- Enabled: When enabled, you can select units that are direct ancestors or descendants of other units. This is because you are only displaying direct reports, meaning responses will not be double counted when units with the same ancestry are selected. Example: In this example, Alden Hart, Alyce Locklear, and Charles Lewis are child units of Aurelio Banner. Since direct reports only is enabled, when Aurelio is selected, all units remain selected.

- Disabled: When disabled, you cannot select units that are direct ancestors or descendants of other units. This is to prevent the double counting of responses.
- If the number of responses for a unit is below your confidentiality threshold, then you cannot select that unit for filtering. This is to protect the confidentiality of respondents; even if the total aggregate number of responses is over the threshold, you cannot select an individual unit if the number of responses in that unit is below the confidentiality threshold.
- Enhanced confidentiality is supported for multi-select org hierarchy filters.
- Action planning does not support multi-select org hierarchy filters. You must filter for one unit with action plans.
- If a dashboard uses multiple data sources with a hierarchy filter and hierarchy mapping, then historical comparisons will show aggregated data for only the available mapped units when multiple hierarchy units are selected.
- If you have a dashboard comparison set up for parent unit, and you select multiple units in your org hierarchy filter, then the comparison will behave as follows:
- The comparison will populate with data if the parent unit of the selected units are the same.
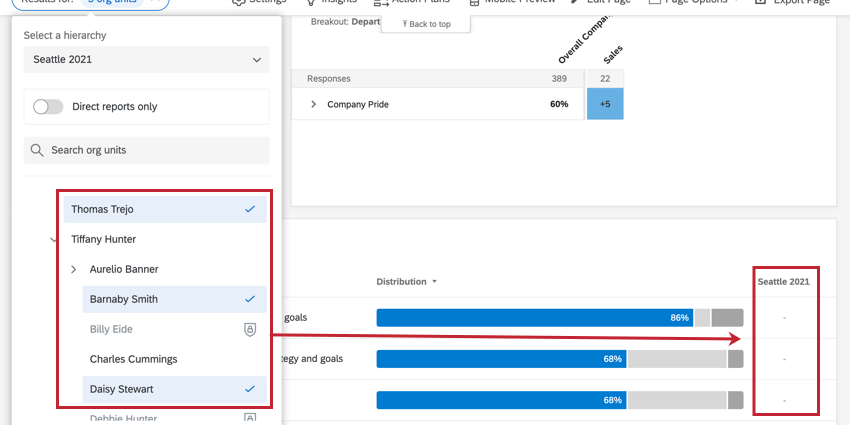
- The comparison will populate with a dash if the parent unit of the selected units is not the same.
- The comparison will populate with data if the parent unit of the selected units are the same.
- If you have a dashboard comparison set up for current unit, it is incompatible with this feature. If you select multiple units in your org hierarchy filter, the data will only ever populate with a dash, regardless of whether the units share parents or not.

Removing Filters
Filter Interactions
Filters & Response Rates/Participation Summary Widgets
Response Rates and Participation Summary widgets can only be filtered by Org Hierarchies and participant metadata. The widgets will instead display an error message if they are filtered by a different field type. Simply remove the filter to avoid this error message.
Qtip: Interested in seeing response rates based on demographic information? Check out the Response Rates widget page for information on applying a break-out instead.
Filters & Sensitive Fields
If a field is marked as sensitive in your Dashboard Data and the dashboard user has the permission to View Sensitive Fields disabled, they will not be able to view or interact with that filter until the field is no longer marked as sensitive or the user’s permissions are changed. If you set your default filter value for a sensitive field to something other than All, it is possible that the dashboard user will not be able to see any data if they do not have the ability to View Sensitive Fields.
Dashboard Page & Widget-Level Filter Interactions
Generally speaking, page filters will apply to widgets that also have a widget-level filter applied. However, in circumstances where the widget-level filter and page filter conflict, the widget-level filter will override the page filter.
For example, if a page filter is set to show only responses from male respondents and a specific widget has a filter to show only responses from female respondents, the page filter will be ignored and the widget will only show female responses.
However, in a situation where a page filter does not completely contradict a widget-level filter, both filters will be applied. For example, if a filter is set to only show responses from male respondents and the widget-level filter is set to show only responses from participants ages 18-24, then the widget will show responses for males who are 18-24 years of age.
Filter Pages Independently
You can choose whether you want your dashboard’s users to be able to filter pages independently. For example, let’s say you add a date filter to the Overview page. You may not want this to carry over as you visit other dashboard pages.
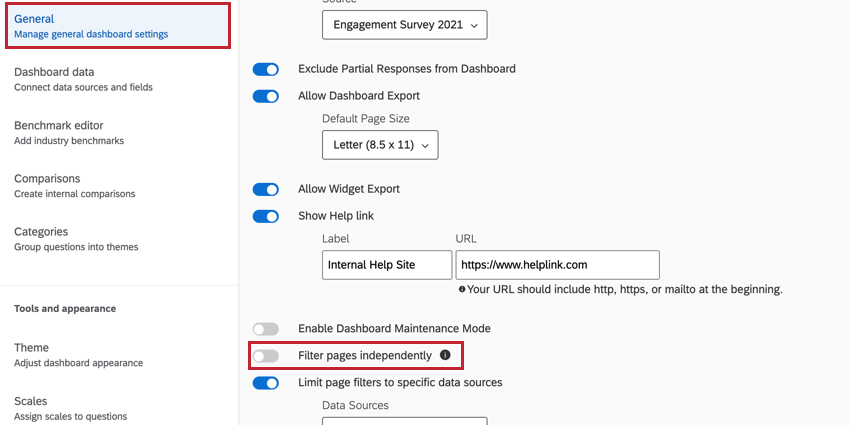
To keep page filters separate from one another, go to your dashboard Settings and enable Filter pages independently.
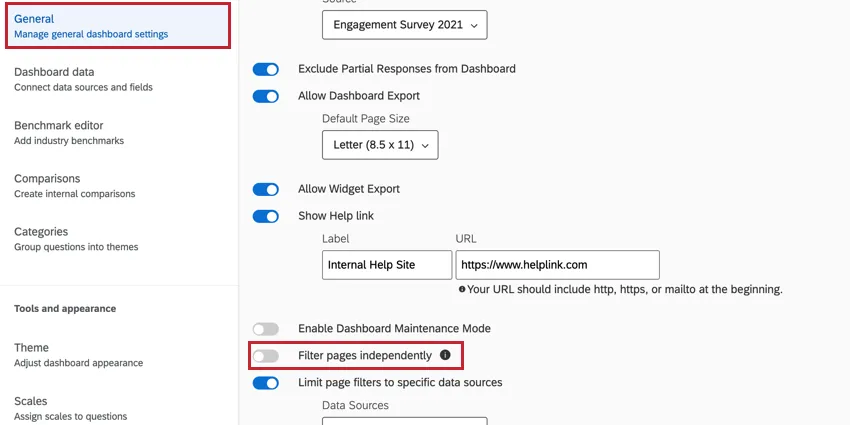
When enabled, filter selections will only apply to the selected page. When disabled, applied filter selections will persist when navigating to other pages.
Qtip: Org Hierarchy page filters do not follow this setting. Org Hierarchy filters will always apply to every page in your dashboard if you use them.
Qtip: Filter pages independently will be disabled by default. You need to manually turn it on in dashboards where you wish to use it.
Exclusively is “X”
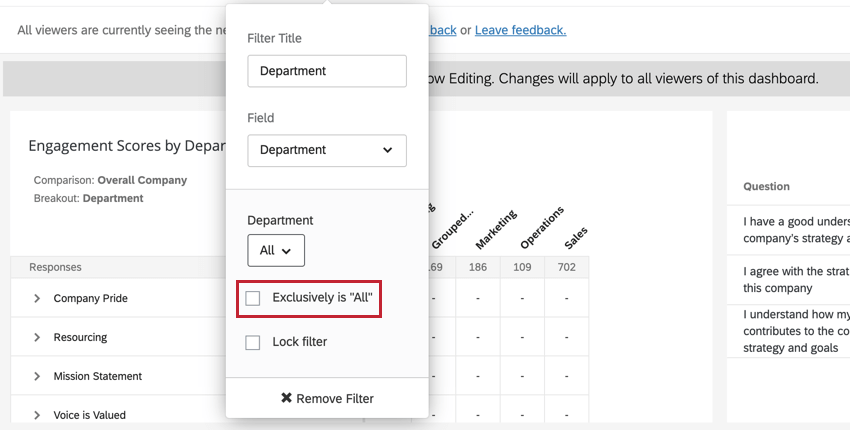
For fields that have been mapped as Multi-Answer Text Sets, you will have an option called Exclusively is ‘X’ when adding the field as a filter. When selecting this option, the filter will only return data if the user responded with exactly your selection.
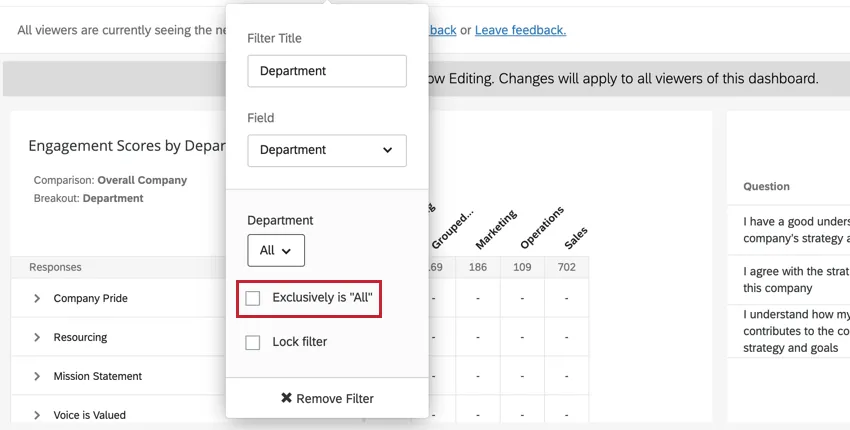
For example, if the question was, “What modes of transportation do you use: Train, Car, Bus” and you specified “Exclusively is: Train, Car,” you would only get responses where the user selected both Train and Car, nothing else.
Date Filters
Filters made for fields of the Date field type are unique in a couple of ways. For one, when specifying the date range, you have a lot of unique options. In addition, these filters themselves have ways of offsetting the data you pull in.
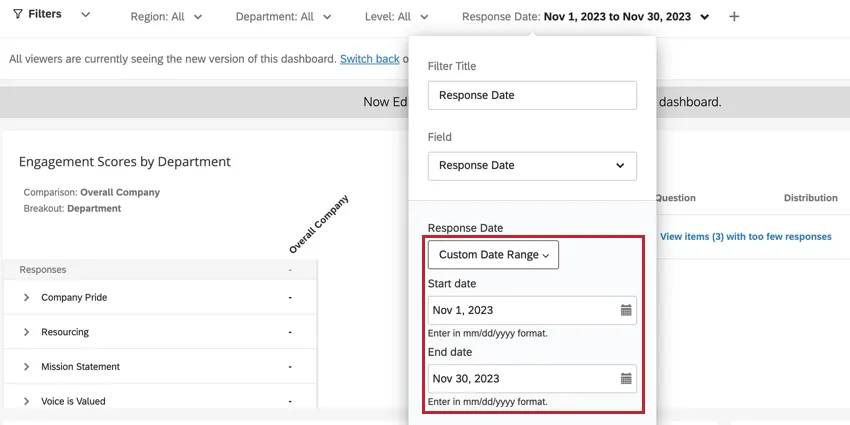
Specifying the Date Range
- Today/This Week/Last Days/Last 180 Days/etc.: This date range is dynamic. If you have “This Week” selected, the data that appears will literally be from the past week, changing as you progress through weeks.
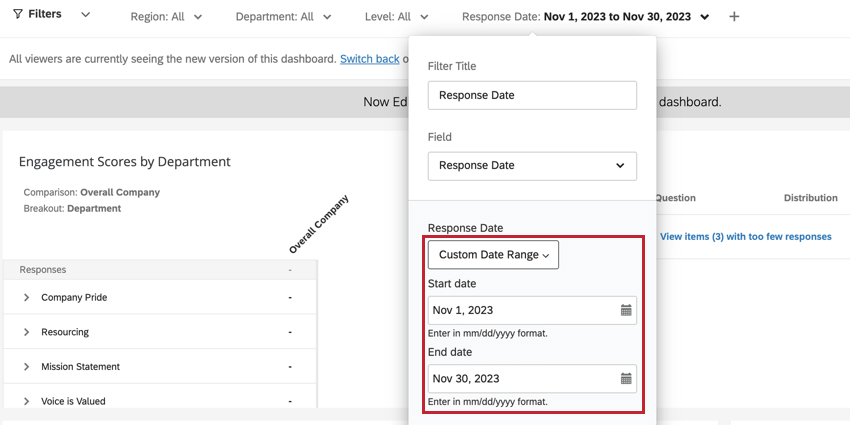
- Custom Date Range: Using the calendars, specify the dates over which you want data included.
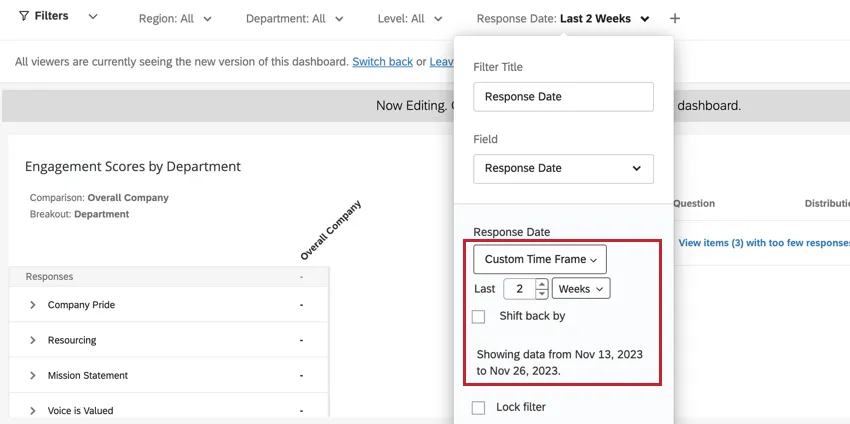
- Custom Time Frame: Custom Time Frame allows you to filter for data collected within the last number of days, weeks, months, quarters, or years. You then have the option to “Shift back” the data by a given period of time. This “Shift back” is described below. For example, in looking at data from the last two quarters, you can “Shift back” by one year to see what the data looked like in the same two quarters one year ago. The filter will describe the exact dates it is covering.
Shift back by Quarter or Year
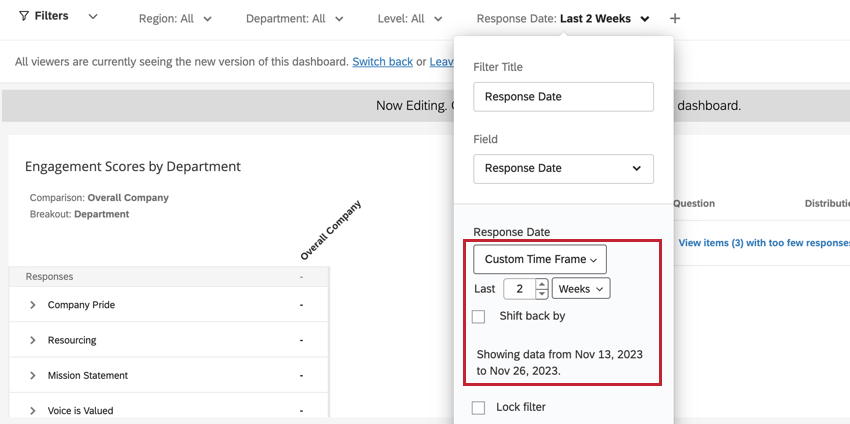
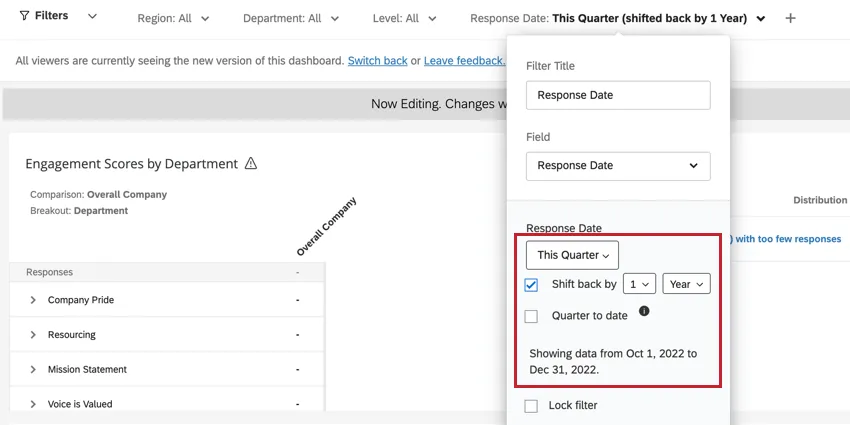
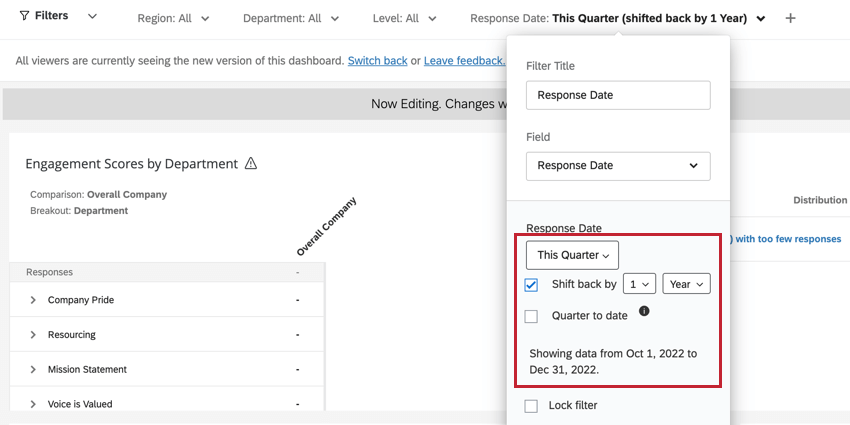
When you select a preset timeframe like Last 180 Days, or choose Custom Timeframe, you can select Shift back by to adjust the data being displayed in the dashboard to the same period in the amount of time specified. For example, let’s say I want a page of my dashboard to always tell me how my company performed the exact same time last year. Thus shifting back date filters allows us to make helpful comparisons to our current performance.
You can shift back filters by as many years or quarters you want.
Example: I want the page to display how we were performing in this same quarter last year. To accomplish this, I first filter the data for This Quarter. I then shift the date back 1 year.
Widget to Widget Filtering
Enable widget to widget filtering to filter other widgets in your dashboard after clicking on a specific data point. For more information, see Widget to Widget Filtering.

That's great! Thank you for your feedback!
Thank you for your feedback!