Powerful AI for knowing what matters,
and acting when it counts
We continuously build and incorporate safe and secure AI into our platform to help
you overcome the core challenges of doing experience management at scale.
Protect your brand
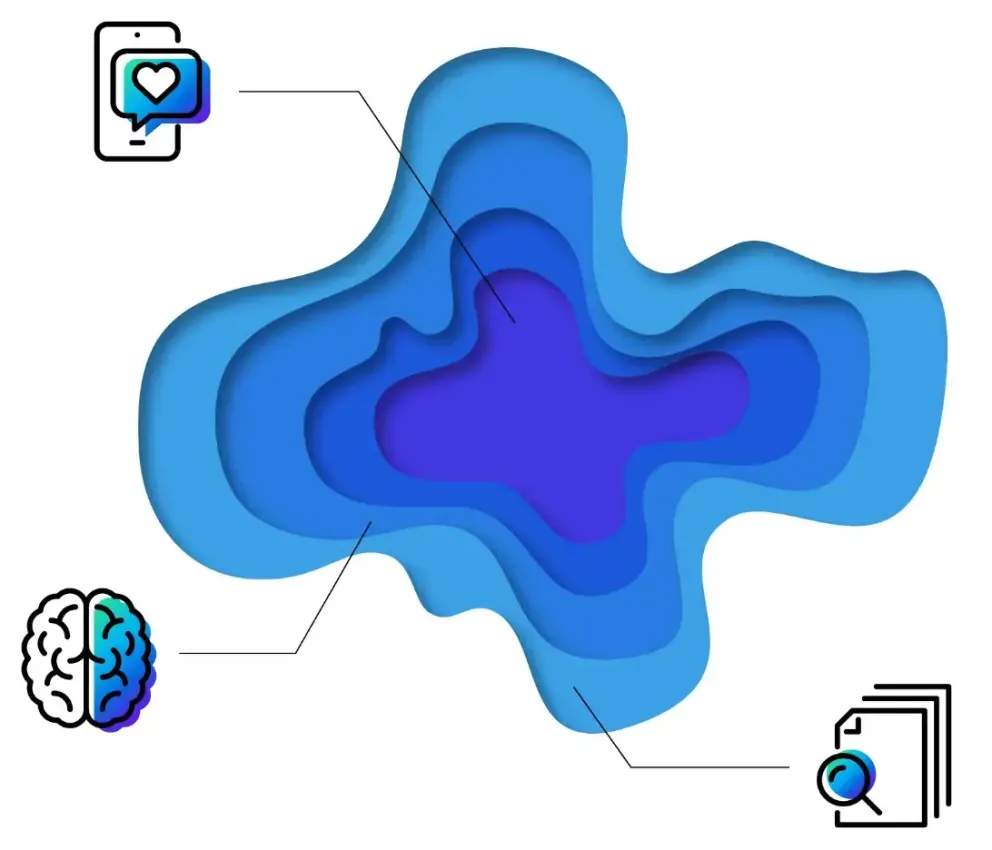
Detect friction as it happens and act instantly with Experience Agents that detect friction, resolve issues, and safeguard relationships.
Get ahead of trends
Receive tailored recommendations and adapt faster than your competitors to changing market conditions
Discover blind spots
Easily analyze structured and unstructured data from previously untapped sources
Specialized, secure and trusted
Our AI helps you make sense of your data, and we make sure it stays yours.
XM OPTIMIZED_
Qualtrics AI delves deep into the experiences of your customers, employees, and prospects to understand personal preferences, proactively anticipate needs, and offer scalable, actionable recommendations across your business.
EASILY INTEGRATED_
Qualtrics AI meets you where you are, connecting to every system of record and action in your enterprise, enabling you to embrace AI on your terms and customize your integration as your business grows and your needs change.

PRIVATE AND SECURE_
The Qualtrics platform supports enterprise grade compliance, governance, and security out of the box. We're committed to safeguarding your proprietary insights and competitive advantages.